1311 N Van Buren St · Marion, IL
Flood risk No data
- FEMA flood zone
- —
- Chance of flooding over 30 yrs
- —
- Est. flood insurance / yr
- —
Fire risk No data
- Est. fire insurance / yr
- —
Heat risk No data
- Hot days now (above threshold)
- —
- Hot days in 30 yrs
- —
Wind risk No data
- Chance of severe wind over 30 yrs
- —
Air-quality risk No data
- Unhealthy air days now
- —
- Unhealthy air days in 30 yrs
- —
Risk factors via First Street. Map © Google.
Why this score? — see what drove the D+ grade
The composite is a weighted blend of 9 inputs, each scored 0–100. Each bar is that input's sub-score; the figure is the points it added to the 100-point composite (weight × sub-score).
- Cash flow +23.5/30.0
- DSCR +7.6/10.0
- 1% rule +5.1/10.0
- Rent growth +4.6/5.0
- Condition / age +3.8/5.0
- Livability +3.1/5.0
- Schools +2.2/10.0
- ARV discount +0.0/15.0
- Appreciation +0.0/10.0
$135,000
🖨 Deal sheet 📄 Offer letter ✓ Due diligence
Listing remarks
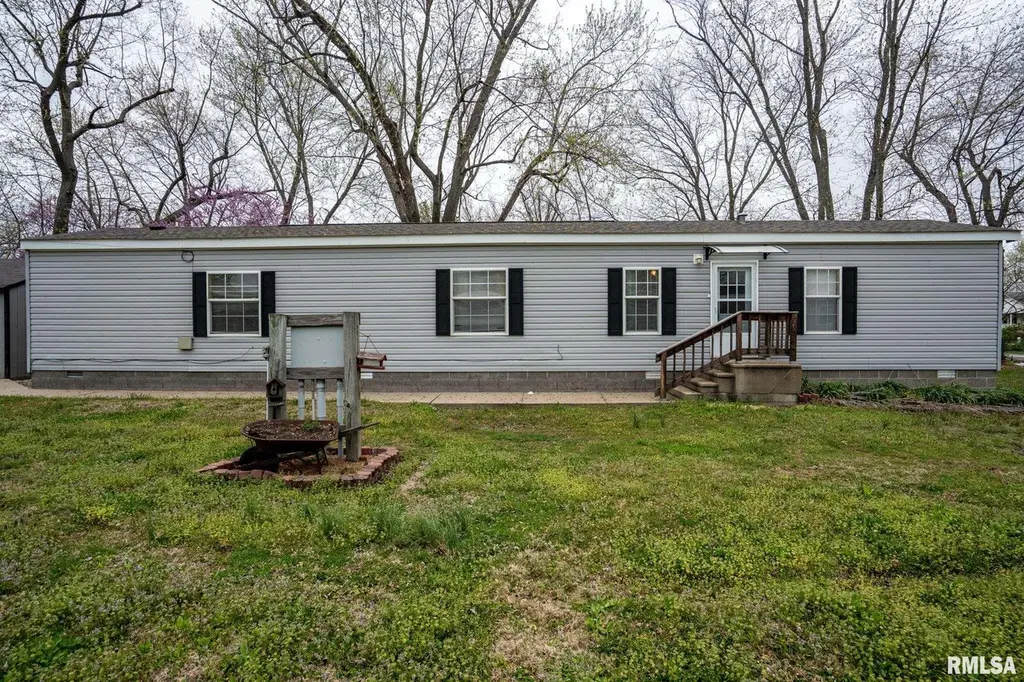
Opportunity is knocking with this unique property offering TWO mobile homes situated across FIVE lots, providing extra space, flexibility, and investment potential. Whether you’re looking to live in one and rent the other, accommodate extended family, or expand your portfolio, this setup delivers. The first home features 2 bedrooms and 2 full bathrooms, along with a spacious kitchen complete with appliances that stay. You’ll appreciate the dedicated laundry room and the newer back deck. The second home offers a clean, modern feel with neutral gray tones throughout and an open-concept layout connecting the living and kitchen areas. This home includes 2 bedrooms and 1 full bath, m
Key facts
- Spacious kitchen
- Newer back deck
- Open-concept layout
Tags
Property features AI
Exterior
- Parking: Detached garage (1 car); Parking pad
- Utilities: Public water; Public sewer
- Home design: Single-family residence; Double wide body type; One story (main level primary living) ; Shingle roof
- Construction: Built in 2011; Crawl space basement
- Exterior features: Level lot; Additional/extra lot; Paved road access
Interior
- Kitchen: Dishwasher; Refrigerator
- Bedrooms: 4 bedrooms; Egress windows in bedrooms
- Flooring: Laminate flooring throughout main living areas and bedrooms
- Bathrooms: 3 full bathrooms
- Heating & cooling: Forced air heating; Central air conditioning
- Interior features: Cable available; High-speed internet
- Laundry & utility: Main-level laundry room
Neighborhood map
What this means for you Summary
Snapshot
- This is a 4-bed/3.0-bath single-family listed at $135k. Condition is rated good.
Deal economics
- At list price, monthly cash flow is $253 ($3k/yr) — positive.
- The deal already cash-flows at list — no discount required.
- Meets the 1% rule at list price ($1k rent vs $135k).
- Recommended offer: $131k (3.0% below list) — sets the bar for market timing.
- Cap rate 8.5% vs local median 4.0% in Marion — top-decile yield for the area; either an underpriced asset or a hidden risk that comps aren't pricing in. Stress-test before assuming the spread holds.
Location & tenants
- Location reads 61/100 on livability (#896 in IL) — a middle-class / working-renter tenant base. Strengths: cost of living A+, housing A+; Watch: employment D, crime F, amenities F.
- Marion CUSD 2 (urban): math 20% / reading 31% proficiency, ranked #317 of 620 in IL (top 51%) — low school quality limits family demand, transient renter base, plan for 1-2y turnover.
- Zoned schools: Marion Jr High School (math 16% / reading 31%, grade F, #371 of 665 statewide, top 56%, 726 students, 0% FRL); Marion High School (math 14% / reading 18%, grade F, #457 of 693 statewide, top 66%, 1,159 students, 0% FRL) — zoned schools average 0% FRL vs 47% district-wide (47 pts lower); this property's tenant base skews higher-income than the district average.
- Market conditions: Rents rising fast (+8.4%/yr); 226 active listings in the ZIP; 130 units permitted in Williamson County in 2024 (5 in 5+ unit buildings).
Forward outlook
- Local home prices are declining (-3.0%/yr); year-one equity from $933 of loan paydown is wiped out by about $4k of value loss. Plan a longer hold.
- At projected returns (-3.0% appreciation + 8.0% rent growth), your $38k cash investment doubles in ~8 years — after that, you're playing with house money.
Negotiation context
- It's been on market 46 days — a 3% lower offer ($131k) is reasonable based on typical stale-listing flexibility.
- Current owner paid $90k; list at $135k implies a 50% gain — meaningful room to come down on a strong offer.
Questions for the listing agent
- It's been on market 46 days. Have you received any prior offers? Is the seller open to a 3% concession, seller financing, or rate buy-down credit?
- Is there a deadline driving the sale (1031 exchange, divorce, estate, relocation)? That informs how much negotiation room exists.
- Schools are F-rated, which usually means shorter tenancies and higher turnover. Who's the typical renter profile here, and what's been the actual vacancy rate?
- Crime grade is F in this area — have there been break-ins, vandalism, or insurance claims at this property in the last 3 years? What carrier currently insures it and at what premium?
- The area grade is low — what's the realistic commute time and amenity access for the typical tenant pool here? Any planned neighborhood developments (good or bad) we should know about?
- What's the average days-on-market for RENTAL listings here right now (not sales)? A rising rental-DOM trend means longer vacancies and softer asking-rent achievability than the comps imply.
- What's the recent tenant-quality profile in this submarket — average credit score on applications, eviction rate, late-payment / NSF rate, and stable-employment percentage? A property-management company in the area should have these aggregated.
- How much new for-sale + rental construction is in the pipeline within 1–3 miles? Heavy new supply typically softens prices + rents 12–24 months out; constrained supply supports both.
Investment metrics
- 1% rule
- 1.01% ✓
- Cap rate
- 8.54%
- Cash-on-cash
- 8.04%
- DSCR
- 1.36
- GRM
- 8.3
CMA / ARV
- ARV (median comp)
- $98,327
- List price
- $135,000
- Delta
- 37.30%
- Verdict
- OVERPRICED
- Comps
- 20 within 1.0 mi
Show comp detail 10 sales within ~0.75 mi
| Address | Dist | Beds/Ba | Sqft | Sold | Price | $/sf | Match |
|---|---|---|---|---|---|---|---|
| 1315 N Glendale St | 0.16mi | 3/2.0 (-1) | 1,030 (+1%) | 21mo | $120,000 | $117 | 64 |
| 908 N Johnson St | 0.50mi | 3/1.0 (-1) | 1,036 (+2%) | 2mo | $151,000 | $146 | 60 |
| 1208 Morgan Ave | 0.62mi | 3/1.5 (-1) | 1,032 (+1%) | 6mo | $70,000 | $68 | 54 |
| 403 N Madison St | 0.71mi | 3/2.0 (-1) | 1,040 (+2%) | 17mo | $72,500 | $70 | 40 |
| 603 N Logan St | 0.69mi | 3/1.0 (-1) | 970 (-5%) | 9mo | $89,000 | $92 | 39 |
| 907 N Garfield St | 0.54mi | 3/1.0 (-1) | 1,120 (+10%) | 14mo | $64,980 | $58 | 34 |
| 407 N Buchanan St | 0.72mi | 3/2.0 (-1) | 1,139 (+12%) | 6mo | $50,000 | $44 | 33 |
| 314 Red Row | 0.72mi | 3/2.0 (-1) | 1,056 (+4%) | 23mo | $210,000 | $199 | 33 |
| 1703 Beverly St | 0.48mi | 3/2.0 (-1) | 1,152 (+13%) | 18mo | $63,000 | $55 | 32 |
| 106 E Stockton St | 0.34mi | 3/2.0 (-1) | 1,170 (+15%) | 24mo | $91,500 | $78 | 31 |
Match score weights: distance 35% · size 25% · config 20% · recency 20%. Top-matched comps best support the ARV.
Projected returns pro-forma
-3.0% appreciation · 8.0% rent growth · sell at horizon
- IRR
- 0.9%
- Equity multiple
- 1.04×
- Total profit
- $1,380
- Equity at exit
- $20,129
- IRR
- 14.7%
- Equity multiple
- 2.44×
- Total profit
- $54,453
- Equity at exit
- $11,672
Cash invested: $37,800 (down + closing). Projections, not guarantees.
Landlord ↔ Tenant lean methodology
- Overall (STATE)
- 43 Moderately Tenant-Leaning
- State Illinois
- 43 Moderately Tenant-Leaning · D+7
- County
- — inherits STATE
- City
- — inherits STATE
ZIP-level market 62959
- Rents YoY
- 8.4%
- Active inventory
- 226
- Price-to-rent
- 8.3×
Monthly cashflow live
- Estimated rent
- $1,359 medium interval (Pro) →
- Mortgage (P&I)
- −$708
- Tax from tax record
- −$56 /mo · $676/yr
- Insurance
- −$56
- HOA
- −$0
- Vacancy / Maint / Mgmt
- −$285
- Net cashflow
- $253
Break-even live
UW: 25.0% down · 7.5% · 30yr · 1.5% tax · 5.0% vac · 8.0% maint · 8.0% mgmt
Financing live
Cash to close
- Down payment
- $33,750
- Closing costs
- $4,050
- Reserves months
- —
- Total cash needed
- —
Loan-product check · same deal, 3 products live
Conventional
25% down · 7.5% · 30yr
- Down + closing
- —
- Monthly P&I
- —
- Monthly cashflow
- —
- DSCR
- —
- Eligible?
- —
Personal DTI + credit; lowest rate.
DSCR
20% down · 8.5% · 30yr
- Down + closing
- —
- Monthly P&I
- —
- Monthly cashflow
- —
- DSCR
- —
- Eligible?
- —
No personal income docs; deal must DSCR.
Hard money
10% down · 12.0% · 12mo
- Down + closing
- —
- Monthly P&I
- —
- Monthly cashflow
- —
- DSCR
- —
- Eligible?
- —
Short-term bridge; refi at stabilization.
Listing history 19 events
-
2026-06-19days on market $135,000 Active 46 DOM
-
2026-06-18days on market $135,000 Active 45 DOM
-
2026-06-17days on market $135,000 Active 44 DOM
-
2026-06-16days on market $135,000 Active 43 DOM
-
2026-06-15days on market $135,000 Active 42 DOM
-
2026-06-14days on market $135,000 Active 40 DOM
-
2026-06-13days on market $135,000 Active 39 DOM
-
2026-06-10days on market $135,000 Active 37 DOM
-
2026-06-09days on market $135,000 Active 36 DOM
-
2026-06-09days on market $135,000 Active 35 DOM
-
2026-06-07days on market $135,000 Active 34 DOM
-
2026-06-05days on market $135,000 Active 31 DOM
-
2026-06-03days on market $135,000 Active 30 DOM
-
2026-06-02days on market $135,000 Active 29 DOM
-
2026-06-01days on market $135,000 Active 28 DOM
-
2026-05-31days on market $135,000 Active 27 DOM
-
2026-05-30days on market $135,000 Active 26 DOM
-
2026-05-04$149,900 Active 979-char remark
-
2025-07-31soldstatus $90,000
ⓘ Source: listings_history table (triggers on properties + properties_extension) + one-shot
backfill from property_details.listing_events for pre-trigger history.
Tax reassessment forecast IL · Partial reset (capped growth)
- Current annual tax
- $676 · $56/mo
- Projected year-2 tax
- $1,870 · $156/mo
- Expected delta
- +$1,194/yr (+$100/mo · 176.7%)
ⓘ Screening estimate from a state-policy table — verify with the county assessor before closing.
Nearby sold comps map
Loading sold comps map…
Walkable amenities ~0.75 mi
Loading nearby amenities…
Taxation est. · year 1
- Rental income
- $16,309
- − Mortgage interest
- −$7,562
- − Property taxes
- −$676
- − Insurance
- −$675
- − Repairs & maintenance
- −$1,305
- − Management
- −$1,305
- − Depreciation
- −$3,927
- Taxable income
- $859
- Est. tax owed @ 24.0%
- −$206
- After-tax cash flow
- $2,831/yr
For passive investors: Depreciation is non-cash, so a rental often shows a tax loss while cash-flowing — sheltering income. Rental losses are passive: they offset passive income freely, and up to $25,000/yr can offset ordinary (W-2) income if you actively participate and your MAGI is under $100k (phasing out to $0 by $150k); unused losses carry forward. On sale, claimed depreciation is recaptured at up to 25%, and gains may owe capital-gains tax (a 1031 exchange can defer both). Figures are a year-1 estimate at your 24.0% rate — not tax advice; consult a CPA.
Condition & rehab AI · 12 photos
This mobile home is in good condition with cosmetic updates needed to enhance its curb appeal and interior aesthetics. The property offers a unique opportunity with two homes on five lots, providing flexibility and investment potential.
Value-add opportunities
- Both Painting exterior and interior — Fresh paint enhances curb appeal and interior aesthetics
- Both Landscaping and curb appeal improvements — Enhances curb appeal and makes the property more inviting
- Resale New flooring in bathrooms — Fresh flooring improves the look and feel of the bathrooms
Renovation cost estimate screening
Value-add ROI direction
- Both Painting exterior and interior — Fresh paint enhances curb appeal and interior aesthetics ↑
- Both Landscaping and curb appeal improvements — Enhances curb appeal and makes the property more inviting ↑
- Resale New flooring in bathrooms — Fresh flooring improves the look and feel of the bathrooms ↑
ⓘ Cost ranges are severity-bucket heuristics (US national rule-of-thumb). Get contractor quotes + a written scope before underwriting a rehab budget.
Schools (NCES district)
- District
- Marion CUSD 2
- NCES district ID
- 1724600
- Math proficiency
- 20% ▼ -11.00%
- Reading proficiency
- 31% ▼ -11.00%
- Median HH income
- $46,221
- Composite
- 22.07/100
- National rank
- #8189
- State rank
- #317 of 620 in IL
Livability — Marion
- Score
- 61/100
- State rank
- #896
- US rank
- #17434
Category grades
Schools grade is shown separately in the Schools card above.
Census & demographics
- Census place
- Marion, IL
- County
- Williamson County · 38,451 people
- City population
- 27,793
- Metro
- Carbondale-Marion, IL
- Population (ZIP)
- 27,793
- Household income
- $71,063
- Rent vs Own
- Severe rent burden
- 763.0
Population outlook (Williamson County) Hauer SSP2
- Today (2025)
- 69,553 people
- By 2030
- 70,090 · +0.8%
- By 2040
- 70,345 · +1.1%
- By 2050
- 69,394 · -0.2%
- By 2075
- 63,590 · -8.6%
- By 2100
- 51,154 · -26.5%
Race, ethnicity, and origin ACS 2023
- Neighborhood character
- Predominantly White (87%)
- Race & ethnicity
- White 87% Black 5% Two or more races 4% Hispanic / Latino 3% Asian 2%
- Common ancestry
- Lithuanian 2% Italian 2% Slovak 1%
- Foreign-born
- 2% · Canada
- Languages at home
- 97% English-only · Spanish 1% Other Asian/Pacific 1% Other Indo-European 1%
Political lean MEDSL · Williamson
- 2024 margin
- Solid R (+38.8) · D 30.0% · R 68.8% · Other 1.3%
- 2008→2024 swing
- -24.0pp toward R · 2008: -14.8pp · 2024: -38.8pp
- All cycles
- 2024: R+38.8 2020: R+37.3 2016: R+41.2 2012: R+25.0 2008: R+14.8
Not yet ingested
- Civics
- —
Market trends
- HPI YoY
- ▼ -76.41%
- Current HPI
- 137.5955
- Rent YoY
- ▲ 8.40%
- Metro
- Carbondale-Marion, IL
- State GDP YoY
- ▲ 1.59%
- F500 in state
- 60
Industry mix (Fortune 500 HQ in IL)
| Industry | F500 HQs | Revenue |
|---|---|---|
| Insurance | 4 | $201B |
|
||
| Consumer Goods | 4 | $87B |
|
||
| Industrial Machinery | 3 | $64B |
|
||
| Healthcare | 2 | $55B |
|
||
| Retail / Pharmacy | 1 | $148B |
|
||
| Agriculture / Food | 1 | $86B |
|
||
Price history
+50.0% since first listed3 events — show timeline
- 2026-05-22 Price Changed $135,000 RMLSA as Distributed by MLS Grid
- 2026-05-04 Listed $149,900 RMLSA as Distributed by MLS Grid
- 2025-07-31 Sold (Public Records) $90,000 Public Records
Property tax history
-0.9%/yrLatest (2025): $676 · -0.9% YoY. Source: county tax records.
Cash-flow waterfall
monthlySold comps — $/sqft
last 12 mo · ≤1 miLoading sold comps…