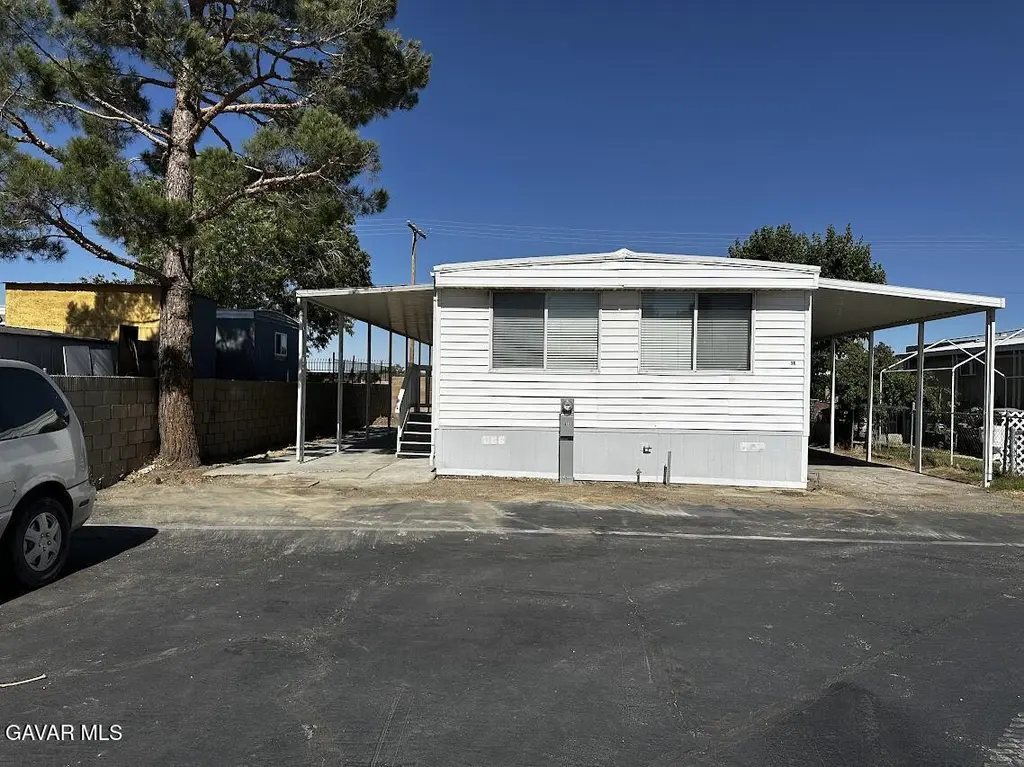
1449 E Avenue I Unit A 36 · Lancaster, CA
Flood risk 1/10 · Minimal
- FEMA flood zone
- X (unshaded)
- Chance of flooding over 30 yrs
- 0.0%
- Est. flood insurance / yr
- $507 – $1,088
Fire risk 5/10 · Moderate
- Est. fire insurance / yr
- $659 – $1,223
Heat risk 7/10 · Major
- Hot days now (above 101°F)
- 5 days/yr
- Hot days in 30 yrs
- 14 days/yr
Wind risk 1/10 · Minimal
- Chance of severe wind over 30 yrs
- —
Air-quality risk 8/10 · Major
- Unhealthy air days now
- 16 days/yr
- Unhealthy air days in 30 yrs
- 21 days/yr
Risk factors via First Street. Map © Google.
Why this score? — see what drove the B- grade
The composite is a weighted blend of 9 inputs, each scored 0–100. Each bar is that input's sub-score; the figure is the points it added to the 100-point composite (weight × sub-score).
- Cash flow +30.0/30.0
- 1% rule +10.0/10.0
- DSCR +10.0/10.0
- ARV discount +6.0/15.0
- Livability +3.4/5.0
- Rent growth +2.5/5.0
- Schools +2.5/10.0
- Condition / age +2.5/5.0
- Appreciation +0.0/10.0
$155,000
🖨 Deal sheet 📄 Offer letter ✓ Due diligence
Listing remarks
2 bed 2 bath total renovated mobile home with new kitchen, new roof, ready to move in
Key facts
- New kitchen
- New roof
- 3,400 sq ft lot
Tags
Property features AI
Finance
- Other: Manufactured by Golden West; model/trade name GOLDEN WEST; length 58 ft, width 20 ft; Serial/ID numbers recorded; Space number A 36; Manager name: Ursula
- HOA & community: Located in Crestview MH Park with amenities including an RV park and pool; Park allows all ages; Space rent / new space rent $660; Park deposit $660
Exterior
- Utilities: 220V electric; Circuit breaker panel
- Home design: Mobile/manufactured home (located in a park); Single-story entry
- Construction: Composition shingle roof; Exterior: metal, siding, combination, wood; Built in 1967; Skirted
- Exterior features: Block fencing; Awning
Interior
- Kitchen: Disposal; Refrigerator; Gas range
- Bathrooms: 2 full bathrooms
- Heating & cooling: Central heat (gas); Central air
- Interior features: Disposal; Refrigerator; Gas range; Central air
Neighborhood map
What this means for you Summary
Snapshot
- This is a 2-bed/2.0-bath manufactured listed at $155k.
Deal economics
- At list price, monthly cash flow is $902 ($11k/yr) — positive.
- The deal already cash-flows at list — no discount required.
- Meets the 1% rule at list price ($2k rent vs $155k).
- Cap rate 13.3% vs local median 4.3% in Lancaster — top-decile yield for the area; either an underpriced asset or a hidden risk that comps aren't pricing in. Stress-test before assuming the spread holds.
Location & tenants
- Location reads 68/100 on livability (#282 in CA) — a middle-class / working-renter tenant base. Strengths: commute A+, housing A+, amenities B+; Watch: health & safety C-, schools F, crime F.
- Lancaster Elementary (suburban): math 18% / reading 32% proficiency, ranked #1,161 of 1,400 in CA (top 83%) — low school quality limits family demand, transient renter base, plan for 1-2y turnover; 72% free/reduced lunch — lower-income household profile, screen leases tightly.
- Market conditions: Rents flat; 1169 active listings in the ZIP; 20 comparable units currently listed for rent nearby; rentals leasing fast (median 2d on market — plan ~1-2 weeks tenant-placement turnaround); 19,697 units permitted in Los Angeles County in 2024 (9,426 in 5+ unit buildings).
- This rent runs 43% of the median local income ($70k/yr) — at the standard rent-burdened threshold; future hikes will face affordability resistance.
Forward outlook
- Local home prices are declining (-3.0%/yr); year-one equity from $1k of loan paydown is wiped out by about $5k of value loss. Plan a longer hold.
- Los Angeles County population projected at +9% by 2050 — modest demand growth; plan on rents tracking national, not racing it.
- At projected returns (-3.0% appreciation + 0.1% rent growth), your $43k cash investment doubles in ~6 years — after that, you're playing with house money.
Negotiation context
- Only 11 days on market — expect competitive offers; lowballing is unlikely to land.
Risks & watch-outs
- Climate carrying-cost: moderate wildfire risk; extreme-heat days projected 5→14/yr by 2055 (HVAC capex compounding) — expect insurance premiums to compound above CPI over the hold.
Questions for the listing agent
- Built in 1967 — when were the roof, HVAC, electrical panel, plumbing, and water heater last replaced?
- Is there a deadline driving the sale (1031 exchange, divorce, estate, relocation)? That informs how much negotiation room exists.
- Schools are F-rated, which usually means shorter tenancies and higher turnover. Who's the typical renter profile here, and what's been the actual vacancy rate?
- Crime grade is F in this area — have there been break-ins, vandalism, or insurance claims at this property in the last 3 years? What carrier currently insures it and at what premium?
- What's the average days-on-market for RENTAL listings here right now (not sales)? A rising rental-DOM trend means longer vacancies and softer asking-rent achievability than the comps imply.
- What's the recent tenant-quality profile in this submarket — average credit score on applications, eviction rate, late-payment / NSF rate, and stable-employment percentage? A property-management company in the area should have these aggregated.
- How much new for-sale + rental construction is in the pipeline within 1–3 miles? Heavy new supply typically softens prices + rents 12–24 months out; constrained supply supports both.
Investment metrics
- 1% rule
- 1.61% ✓
- Cap rate
- 13.28%
- Cash-on-cash
- 24.95%
- DSCR
- 2.11
- GRM
- 5.2
CMA / ARV
- ARV (on-the-fly)
- $150,000
- Comps found
- 12
Show comp detail 12 sales within ~0.75 mi
| Address | Dist | Beds/Ba | Sqft | Sold | Price | $/sf | Match |
|---|---|---|---|---|---|---|---|
| 1449 E Avenue I Spc B22 | 0.00mi | 2/2.0 | 1,200 (0%) | 13mo | $130,000 | $108 | 89 |
| 1501 E Avenue I #147 | 0.13mi | 3/2.0 (+1) | 1,232 (+3%) | 4mo | $190,000 | $154 | 81 |
| 1501 E Avenue I #142 | 0.13mi | 3/2.0 (+1) | 1,232 (+3%) | 8mo | $135,000 | $110 | 78 |
| 1301 E Avenue I #348 | 0.25mi | 3/2.0 (+1) | 1,248 (+4%) | 1mo | $159,000 | $127 | 76 |
| 1501 East Ave I #174 | 0.13mi | 3/2.0 (+1) | 1,104 (-8%) | 12mo | $195,000 | $177 | 66 |
| 1501 E Avenue I #180 | 0.13mi | 3/2.0 (+1) | 1,248 (+4%) | 21mo | $175,600 | $141 | 65 |
| 1301 E Avenue I #240 | 0.25mi | 2/2.0 | 1,056 (-12%) | 9mo | $145,000 | $137 | 61 |
| 1301 E I Ave #92 | 0.24mi | 3/2.0 (+1) | 1,248 (+4%) | 21mo | $149,999 | $120 | 59 |
| 2121 E Avenue I #75 | 0.74mi | 3/2.0 (+1) | 1,248 (+4%) | 14mo | $148,000 | $119 | 42 |
| 2121 E Avenue I #64 | 0.74mi | 3/2.0 (+1) | 1,344 (+12%) | 7mo | $168,500 | $125 | 35 |
| 2121 E Avenue I #17 | 0.74mi | 3/2.0 (+1) | 1,344 (+12%) | 9mo | $155,000 | $115 | 33 |
| 2121 East Avenue I #24 | 0.74mi | 2/2.0 | 1,344 (+12%) | 22mo | $135,000 | $100 | 27 |
Match score weights: distance 35% · size 25% · config 20% · recency 20%. Top-matched comps best support the ARV.
Projected returns pro-forma
-3.0% appreciation · 0.14% rent growth · sell at horizon
- IRR
- 15.1%
- Equity multiple
- 1.59×
- Total profit
- $25,400
- Equity at exit
- $23,111
- IRR
- 21.6%
- Equity multiple
- 2.59×
- Total profit
- $69,185
- Equity at exit
- $13,402
Cash invested: $43,400 (down + closing). Projections, not guarantees.
Landlord ↔ Tenant lean methodology
- Overall (STATE)
- 18 Strongly Tenant-Friendly
- State California
- 18 Strongly Tenant-Friendly · D+13
- County
- — inherits STATE
- City
- — inherits STATE
ZIP-level market 93535
- Home prices YoY
- -24.3%
- Rents YoY
- 0.1%
- Active inventory
- 1169
- Price-to-rent
- 5.2×
Monthly cashflow live
- Estimated rent
- $2,498 high interval (Pro) →
- Mortgage (P&I)
- −$813
- Tax est. 1.5%
- −$194 /mo · $2,325/yr
- Insurance
- −$65
- HOA
- −$0
- Vacancy / Maint / Mgmt
- −$525
- Net cashflow
- $902
Break-even live
UW: 25.0% down · 7.5% · 30yr · 1.5% tax · 5.0% vac · 8.0% maint · 8.0% mgmt
Financing live
Cash to close
- Down payment
- $38,750
- Closing costs
- $4,650
- Reserves months
- —
- Total cash needed
- —
Loan-product check · same deal, 3 products live
Conventional
25% down · 7.5% · 30yr
- Down + closing
- —
- Monthly P&I
- —
- Monthly cashflow
- —
- DSCR
- —
- Eligible?
- —
Personal DTI + credit; lowest rate.
DSCR
20% down · 8.5% · 30yr
- Down + closing
- —
- Monthly P&I
- —
- Monthly cashflow
- —
- DSCR
- —
- Eligible?
- —
No personal income docs; deal must DSCR.
Hard money
10% down · 12.0% · 12mo
- Down + closing
- —
- Monthly P&I
- —
- Monthly cashflow
- —
- DSCR
- —
- Eligible?
- —
Short-term bridge; refi at stabilization.
Rent comps 20 comps
| Address | Beds | Baths | Sqft | Rent | $/sqft | DOM | Units | Dist |
|---|---|---|---|---|---|---|---|---|
| 45041 Colleen Dr Lancaster, CA | 3.0 | 3.0 | 1303 | $3,100 | $2.38 | 1d | 1 | 0.26mi |
| 45118 Parkview Ln Lancaster, CA | 2.0 | 2.0 | 980 | $2,500 | $2.55 | 24d | 1 | 0.47mi |
| 1734 Lightcap St Lancaster, CA | 3.0 | 2.0 | 1467 | $2,700 | $1.84 | 1d | 1 | 0.64mi |
| 837 Sunrise Ct Lancaster, CA | 3.0 | 2.0 | 1259 | $2,895 | $2.30 | 4d | 1 | 0.65mi |
| 837 Sunrise Ct Lancaster, CA | 3.0 | 2.0 | 1259 | $3,000 | $2.38 | 22d | 1 | 0.65mi |
| 44732 12th St E Lancaster, CA | 3.0 | 2.0 | 1426 | $2,600 | $1.82 | 15d | 1 | 0.68mi |
| 44908 Logue Ave Lancaster, CA | 3.0 | 2.0 | 1473 | $2,495 | $1.69 | 1d | 1 | 0.82mi |
| 1004 E Newgrove St Lancaster, CA | 3.0 | 2.0 | 1160 | $2,800 | $2.41 | 1d | 1 | 0.83mi |
| 44532 15th St E #7 Lancaster, CA | 2.0 | 2.0 | 1062 | $2,150 | $2.02 | 24d | 1 | 0.84mi |
| 44532 15th St E #7 Lancaster, CA | 2.0 | 2.0 | 1062 | $2,050 | $1.93 | 1d | 1 | 0.84mi |
| 550 E Avenue H14 Lancaster, CA | 2.0 | 1.0 | 850 | $2,050 | $2.41 | 1d | 1 | 0.88mi |
| 1628 Cactus Dr Apt B Lancaster, CA | 2.0 | 1.5 | 1000 | $1,999 | $2.00 | 1d | 1 | 0.89mi |
| 1647 Orchid Ln Lancaster, CA | 2.0 | 2.0 | 1000 | $1,875 | $1.88 | 2d | 1 | 0.93mi |
| 1647 Orchid Ln Lancaster, CA | 3.0 | 3.0 | 1084 | $1,950 | $1.80 | 22d | 1 | 0.93mi |
| 44436 15th St E Lancaster, CA | 2.0 | 2.0 | 1056 | $2,024 | $1.92 | 1d | 1 | 1.02mi |
| 1827 East Avenue J Unit 2 Lancaster, CA | 2.0 | 2.0 | 1050 | $1,850 | $1.76 | 17d | 1 | 1.12mi |
| 45426 Stanridge Ave Lancaster, CA | 3.0 | 2.0 | 1443 | $2,975 | $2.06 | 15d | 1 | 1.28mi |
| 1743 , CA | 1.0–4.0 | 1.0–2.0 | 934 | $1,803 | $1.93 | 1d | 17 | 1.33mi |
| 44709 26th St E Lancaster, CA | 3.0 | 2.0 | 1316 | $2,300 | $1.75 | 18d | 1 | 1.35mi |
| 44236 20th St E Lancaster, CA | 2.0 | 1.0–2.5 | 900 | $1,712 | $1.90 | 1d | 1 | 1.38mi |
Listing history 9 events
-
2026-06-18days on market $155,000 Active 11 DOM
-
2026-06-17days on market $155,000 Active 10 DOM
-
2026-06-16days on market $155,000 Active 9 DOM
-
2026-06-15days on market $155,000 Active 8 DOM
-
2026-06-13days on market $155,000 Active 6 DOM
-
2026-06-13days on market $155,000 Active 5 DOM
-
2026-06-09days on market $155,000 Active 2 DOM
-
2026-06-08remarks 85-char remark
-
2026-06-08$155,000 Active 1 DOM
ⓘ Source: listings_history table (triggers on properties + properties_extension) + one-shot
backfill from property_details.listing_events for pre-trigger history.
Climate risk First Street
- Flood 1/10 Low FEMA zone X (unshaded) · 0% chance over 30 yrs
- Wildfire 5/10 Major
- Heat 7/10 Severe 5 d/yr ≥101°F today · 14 d/yr by 30 yrs out
- Wind 1/10 Low
- Air quality 8/10 Severe 16 unhealthy d/yr today · 21 by 30 yrs out
Nearby sold comps map
Loading sold comps map…
Walkable amenities ~0.75 mi
Loading nearby amenities…
Taxation est. · year 1
- Rental income
- $29,977
- − Mortgage interest
- −$8,682
- − Property taxes
- −$2,325
- − Insurance
- −$775
- − Repairs & maintenance
- −$2,398
- − Management
- −$2,398
- − Depreciation
- −$4,509
- Taxable income
- $8,889
- Est. tax owed @ 24.0%
- −$2,133
- After-tax cash flow
- $8,694/yr
For passive investors: Depreciation is non-cash, so a rental often shows a tax loss while cash-flowing — sheltering income. Rental losses are passive: they offset passive income freely, and up to $25,000/yr can offset ordinary (W-2) income if you actively participate and your MAGI is under $100k (phasing out to $0 by $150k); unused losses carry forward. On sale, claimed depreciation is recaptured at up to 25%, and gains may owe capital-gains tax (a 1031 exchange can defer both). Figures are a year-1 estimate at your 24.0% rate — not tax advice; consult a CPA.
Schools (NCES district)
- District
- Lancaster Elementary
- NCES district ID
- 0620880
- Math proficiency
- 18% ▲ 1.00%
- Reading proficiency
- 32% ▬ 0.00%
- Median HH income
- $46,440
- Composite
- 24.73/100
- National rank
- #13028
- State rank
- #1161 of 1400 in CA
Livability — Lancaster
- Score
- 68/100
- State rank
- #282
- US rank
- #9504
Category grades
Schools grade is shown separately in the Schools card above.
Census & demographics
- Census place
- Lancaster, CA
- County
- Los Angeles County · 9,444,647 people
- City population
- 194,251
- Metro
- Los Angeles-Long Beach-Anaheim, CA
- Population (ZIP)
- 79,409
- Household income
- $70,360
- Rent vs Own
- Severe rent burden
- 2494.0
Population outlook (Los Angeles County) Hauer SSP2
- Today (2025)
- 10,940,515 people
- By 2030
- 11,256,481 · +2.9%
- By 2040
- 11,729,929 · +7.2%
- By 2050
- 11,948,407 · +9.2%
- By 2075
- 11,818,114 · +8.0%
- By 2100
- 10,842,928 · -0.9%
Race, ethnicity, and origin ACS 2023
- Neighborhood character
- Diverse neighborhood (Simpson 0.63)
- Race & ethnicity
- Hispanic / Latino 55% Two or more races 25% Black 21% White 17% Asian 2% Native American 1%
- Hispanic origin (detail)
- Mexican 42%
- Common ancestry
- Romanian 1% Italian 1% Lithuanian 1%
- Foreign-born
- 13% · Canada
- Languages at home
- 60% English-only · Spanish 37% Tagalog/Filipino 1% Other Indo-European 1%
Political lean MEDSL · Los Angeles
- 2024 margin
- Solid D (+32.9) · D 64.8% · R 31.9% · Other 3.3%
- 2008→2024 swing
- -7.4pp toward R · 2008: 40.4pp · 2024: 32.9pp
- All cycles
- 2024: D+32.9 2020: D+44.2 2016: D+48.0 2012: D+40.0 2008: D+40.4
Not yet ingested
- Civics
- —
Market trends
- HPI YoY
- ▼ -144.13%
- Current HPI
- 449.4494
- Rent YoY
- ▲ 0.14%
- Metro
- Los Angeles-Long Beach-Anaheim, CA
- State GDP YoY
- ▲ 3.21%
- F500 in state
- 116
Industry mix (Fortune 500 HQ in CA)
| Industry | F500 HQs | Revenue |
|---|---|---|
| Technology | 27 | $1,492B |
|
||
| Financial Services | 3 | $174B |
|
||
| Retail | 3 | $44B |
|
||
| Insurance | 3 | $26B |
|
||
| Media / Entertainment | 2 | $115B |
|
||
| Pharmaceuticals / Biotech | 2 | $62B |
|
||
Price history
1 event — show timeline
- 2026-06-07 Listed $155,000 AVMLS
Cash-flow waterfall
monthlySold comps — $/sqft
last 12 mo · ≤1 miLoading sold comps…