 6-Plex
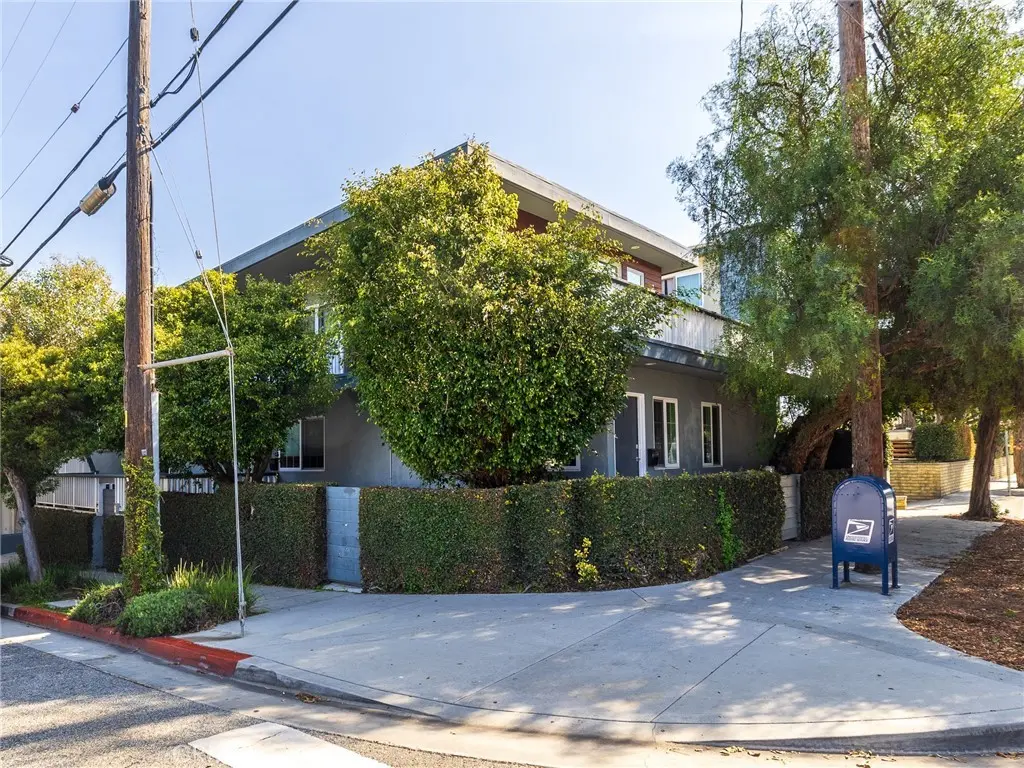
402 Pacific · Santa Monica, CA
Flood risk 1/10 · Minimal
- FEMA flood zone
- X (unshaded)
- Chance of flooding over 30 yrs
- 0.0%
- Est. flood insurance / yr
- $507 – $1,088
Fire risk 1/10 · Minimal
- Est. fire insurance / yr
- $659 – $1,223
Heat risk 7/10 · Major
- Hot days now (above 80°F)
- 6 days/yr
- Hot days in 30 yrs
- 17 days/yr
Wind risk 1/10 · Minimal
- Chance of severe wind over 30 yrs
- —
Air-quality risk 4/10 · Minor
- Unhealthy air days now
- 5 days/yr
- Unhealthy air days in 30 yrs
- 6 days/yr
Risk factors via First Street. Map © Google.
Why this score? — see what drove the D grade
The composite is a weighted blend of 9 inputs, each scored 0–100. Each bar is that input's sub-score; the figure is the points it added to the 100-point composite (weight × sub-score).
- ARV discount +7.5/15.0
- Appreciation +7.5/10.0
- Cash flow +7.4/30.0
- Schools +6.2/10.0
- Livability +3.6/5.0
- Rent growth +2.8/5.0
- Condition / age +2.5/5.0
- 1% rule +2.0/10.0
- DSCR +1.5/10.0
$3,500,000
🖨 Deal sheet 📄 Offer letter ✓ Due diligence
Multi-family units
County records classify this as Multi-Family (5+ Unit). Listing-text estimate: 6 units. confirmed
5+ unit building — per-unit beds/baths from public records are typically unavailable; the breakdown below (if shown) is an estimate from the listing text.
Listing remarks
Southern California lifestyle, This renovated 6 unit residential income property is only steps away from the iconic beaches of Santa Monica. The complex is comprised of 3 top floor single level units, and 3 townhome style units with tree top vistas, new kitchen cabinetry, and stainless-steel appliances. This beautiful complex has the luxury of an in-unit washer & dryers as well as air conditioning. The building has controlled entry, with a video com security system. Ideally located close to the historic Santa Monica pier and Third Street Promenade.
Key facts
- Townhome style units
- 5,357 sq ft lot
- 5 garage spots
Tags
Property features AI
Finance
- Other: No accessory dwelling unit
- Financial info: Total building area reported as 3,912; Gross scheduled income: $231,348; Gross income: $231,348; Net operating income: $173,826; Total operating expenses: $57,522 (includes insurance $4,847; water/sewer $4,000; trash $3,800; taxes reported separately); Units are rented with tenant-paid utilities: gas and electricity; There are six total rental units
- HOA & community: Property is subject to rent control
Exterior
- Parking: Total of 7 parking spaces; 5 garage spaces (assigned), plus 2 uncovered spaces; Each unit includes one assigned garage space
- Utilities: Public sewer; District/public water; Six separate gas meters; Six separate electric meters; One separate water meter
- Home design: Attached multi-unit property; Two stories
- Construction: One building; Year built source: Assessor
- Exterior features: No pool; Corner lot; Gutters and curbs in the community
Interior
- Kitchen: Kitchens in each unit (appliance details not provided)
- Bedrooms: Six separate units (each unit is 1 bedroom)
- Bathrooms: Multiple units with 1 or 2 full bathrooms (units list: four units with 1 bath, two units with 2 baths)
- Interior features: Two-level layout; Entry on main level
- Laundry & utility: In-unit laundry available (inside, stackable)
Neighborhood map
What this means for you Summary
Snapshot
- This is a 6 × 6-bed/9.0-bath units multifamily listed at $3.50M.
Deal economics
- At list price, monthly cash flow is $-5k ($-54k/yr) — negative. Per door: $-752/mo.
- To cash-flow at today's rent, offer at most $2.70M (22.8% below list).
- To meet the 1% rule (rent ≥ 1% of price), the offer needs to be $2.46M (29.7% below list).
- Recommended offer: $2.46M (29.7% below list) — sets the bar for 1% rule.
- Cap rate 4.7% vs local median 1.2% in Santa Monica — top-decile yield for the area; either an underpriced asset or a hidden risk that comps aren't pricing in. Stress-test before assuming the spread holds.
Location & tenants
- Location reads 72/100 on livability (#178 in CA) — a middle-class / working-renter tenant base. Strengths: schools A+, amenities A+, commute A+; Watch: health & safety C-, crime F, cost of living F.
- Santa Monica-Malibu Unified (urban): math 61% / reading 74% proficiency, ranked #123 of 1,400 in CA (top 9%) — acceptable for families but not a draw, mixed tenant base, ~2y average lease.
- Market conditions: Rents rising (+1.1%/yr); 100 active listings in the ZIP; 4 comparable units currently listed for rent nearby; rentals at typical pace (median 25d on market — plan ~3-4 weeks tenant-placement turnaround); high-income renter base; 19,697 units permitted in Los Angeles County in 2024 (9,426 in 5+ unit buildings).
- At $24,607/mo this rent would consume 244% of the median local household income ($121k/yr) (locally 2402% of renters already pay >50% of income on rent) — very limited rent-growth headroom before tenants either downsize or default.
Forward outlook
- In year one you build about $198k of equity ($24k loan paydown + $174k appreciation (5.0% local appreciation)).
- Los Angeles County population projected at +9% by 2050 — modest demand growth; plan on rents tracking national, not racing it.
- By year 2, paydown + projected appreciation supports a ~$317k cash-out refi (75% LTV) — recoverable capital for the next deal without selling this one.
Negotiation context
- Only 14 days on market — expect competitive offers; lowballing is unlikely to land.
- 17 sale attempts since 11y ago with the ask held roughly flat each time — persistent listings suggest the price (not the market) is what's stuck; bring a comps-based counter.
Risks & watch-outs
- Watch-outs: built in 1954 — expect roof / HVAC / electrical / plumbing capex.
- Climate carrying-cost: extreme-heat days projected 6→17/yr by 2055 (HVAC capex compounding) — expect insurance premiums to compound above CPI over the hold.
Questions for the listing agent
- What do current leases actually rent for vs. the listed asking? Can we see a recent rent roll and the last 12 months of T-12 income?
- Can we see the unit-by-unit rent roll, current vacancy, and any below-market leases? What's the average tenancy length?
- What capital expenditures (roof, boiler, parking lot, exteriors) have been made in the last 5 years, and what's planned in the next 2?
- Built in 1954 — when were the roof, HVAC, electrical panel, plumbing, and water heater last replaced?
- Is there a deadline driving the sale (1031 exchange, divorce, estate, relocation)? That informs how much negotiation room exists.
- Schools are A-rated — typically a magnet for longer-tenancy family renters. What's the average tenant stay here, and is there a school-zone premium baked into asking?
- Crime grade is F in this area — have there been break-ins, vandalism, or insurance claims at this property in the last 3 years? What carrier currently insures it and at what premium?
- The area grade is low — what's the realistic commute time and amenity access for the typical tenant pool here? Any planned neighborhood developments (good or bad) we should know about?
- What's the average days-on-market for RENTAL listings here right now (not sales)? A rising rental-DOM trend means longer vacancies and softer asking-rent achievability than the comps imply.
- What's the recent tenant-quality profile in this submarket — average credit score on applications, eviction rate, late-payment / NSF rate, and stable-employment percentage? A property-management company in the area should have these aggregated.
- How much new apartment / multifamily construction is in the pipeline within 1–3 miles? Heavy new supply (>2% of stock underway) typically softens rents 12–24 months out; light construction supports rent growth.
Investment metrics
- 1% rule
- 0.70% ✗
- Cap rate
- 4.75%
- Cash-on-cash
- -5.53%
- DSCR
- 0.75
- GRM
- 11.9
CMA / ARV
- ARV (on-the-fly)
- $1,494,504
- Comps found
- 3
Show comp detail 3 sales within ~0.75 mi
| Address | Dist | Beds/Ba | Sqft | Sold | Price | $/sf | Match |
|---|---|---|---|---|---|---|---|
| 1856 9th St | 0.41mi | 6/4.0 | 2,568 (-4%) | 16mo | $1,550,000 | $604 | 42 |
| 827 Cedar St | 0.41mi | 6/3.0 | 2,929 (+10%) | 7mo | $1,587,088 | $542 | 38 |
| 2511 4th St | 0.29mi | 6/4.0 | 3,031 (+14%) | 8mo | $1,700,000 | $561 | 37 |
Match score weights: distance 35% · size 25% · config 20% · recency 20%. Top-matched comps best support the ARV.
Projected returns pro-forma
4.97% appreciation · 1.05% rent growth · sell at horizon
- IRR
- 7.4%
- Equity multiple
- 1.47×
- Total profit
- $465,230
- Equity at exit
- $1,976,114
- IRR
- 8.8%
- Equity multiple
- 2.61×
- Total profit
- $1,574,385
- Equity at exit
- $3,404,491
Cash invested: $980,000 (down + closing). Projections, not guarantees.
Landlord ↔ Tenant lean methodology
- Overall (STATE)
- 18 Strongly Tenant-Friendly
- State California
- 18 Strongly Tenant-Friendly · D+13
- County
- — inherits STATE
- City
- — inherits STATE
ZIP-level market 90405
- Home prices YoY
- 1.2%
- Rents YoY
- 1.1%
- Active inventory
- 100
- Price-to-rent
- 71.1×
Monthly cashflow live
- Estimated rent
- $24,607 medium interval (Pro) →
- Mortgage (P&I)
- −$18,354
- Tax from tax record
- −$4,141 /mo · $49,687/yr
- Insurance
- −$1,458
- HOA
- −$0
- Vacancy / Maint / Mgmt
- −$5,167
- Net cashflow
- $-4,514
Break-even live
6-unit breakdown (identical units grouped — click to expand)
| Units | Beds | Baths | Est. rent |
|---|---|---|---|
| 6× units | 6 | 9 | $24,606 |
| #1 | 6 | 9 | $4,101 |
| #2 | 6 | 9 | $4,101 |
| #3 | 6 | 9 | $4,101 |
| #4 | 6 | 9 | $4,101 |
| #5 | 6 | 9 | $4,101 |
| #6 | 6 | 9 | $4,101 |
| Total (6 units) | $24,607 | ||
UW: 25.0% down · 7.5% · 30yr · 1.5% tax · 5.0% vac · 8.0% maint · 8.0% mgmt
Financing live
Cash to close
- Down payment
- $875,000
- Closing costs
- $105,000
- Reserves months
- —
- Total cash needed
- —
Loan-product check · same deal, 3 products live
Conventional
25% down · 7.5% · 30yr
- Down + closing
- —
- Monthly P&I
- —
- Monthly cashflow
- —
- DSCR
- —
- Eligible?
- —
Personal DTI + credit; lowest rate.
DSCR
20% down · 8.5% · 30yr
- Down + closing
- —
- Monthly P&I
- —
- Monthly cashflow
- —
- DSCR
- —
- Eligible?
- —
No personal income docs; deal must DSCR.
Hard money
10% down · 12.0% · 12mo
- Down + closing
- —
- Monthly P&I
- —
- Monthly cashflow
- —
- DSCR
- —
- Eligible?
- —
Short-term bridge; refi at stabilization.
Rent comps 4 comps
| Address | Beds | Baths | Sqft | Rent | $/sqft | DOM | Units | Dist |
|---|---|---|---|---|---|---|---|---|
| 44 Dudley Ave Venice, CA | 5.0 | 3.0 | 3128 | $14,245 | $4.55 | 4d | 1 | 0.99mi |
| 611 Flower Ave Venice, CA | 6.0 | 5.0 | 2618 | $14,950 | $5.71 | 7d | 1 | 1.02mi |
| 34 Park Ave Venice, CA | 5.0 | 4.0 | 2112 | $15,000 | $7.10 | 43d | 1 | 1.23mi |
| 1812 Navy St Santa Monica, CA | 5.0 | 3.0 | 3228 | $19,000 | $5.89 | 24d | 1 | 1.41mi |
Listing history 10 events
-
2026-06-18days on market $3,500,000 Active 14 DOM
-
2026-06-17days on market $3,500,000 Active 13 DOM
-
2026-06-16days on market $3,500,000 Active 12 DOM
-
2026-06-15days on market $3,500,000 Active 11 DOM
-
2026-06-13days on market $3,500,000 Active 9 DOM
-
2026-06-13days on market $3,500,000 Active 8 DOM
-
2026-06-09days on market $3,500,000 Active 5 DOM
-
2026-06-08days on market $3,500,000 Active 4 DOM
-
2026-06-07remarks 556-char remark
-
2026-06-07$3,500,000 Active 3 DOM
ⓘ Source: listings_history table (triggers on properties + properties_extension) + one-shot
backfill from property_details.listing_events for pre-trigger history.
Tax reassessment forecast CA · Resets to sale price
- Current annual tax
- $49,687 · $4,141/mo
- Projected year-2 tax
- $49,687 · $4,141/mo
- Expected delta
- $0/yr ($0/mo · 0.0%)
ⓘ Screening estimate from a state-policy table — verify with the county assessor before closing.
Climate risk First Street
- Flood 1/10 Low FEMA zone X (unshaded) · 0% chance over 30 yrs
- Wildfire 1/10 Low
- Heat 7/10 Severe 6 d/yr ≥80°F today · 17 d/yr by 30 yrs out
- Wind 1/10 Low
- Air quality 4/10 Moderate 5 unhealthy d/yr today · 6 by 30 yrs out
Nearby sold comps map
Loading sold comps map…
Walkable amenities ~0.75 mi
Loading nearby amenities…
Taxation est. · year 1
- Rental income
- $295,284
- − Mortgage interest
- −$196,054
- − Property taxes
- −$49,687
- − Insurance
- −$17,500
- − Repairs & maintenance
- −$23,623
- − Management
- −$23,623
- − Depreciation
- −$101,818
- Taxable loss
- −$117,021
- Est. tax savings @ 24.0%
- +$28,085
- After-tax cash flow
- $-26,080/yr
For passive investors: Depreciation is non-cash, so a rental often shows a tax loss while cash-flowing — sheltering income. Rental losses are passive: they offset passive income freely, and up to $25,000/yr can offset ordinary (W-2) income if you actively participate and your MAGI is under $100k (phasing out to $0 by $150k); unused losses carry forward. On sale, claimed depreciation is recaptured at up to 25%, and gains may owe capital-gains tax (a 1031 exchange can defer both). Figures are a year-1 estimate at your 24.0% rate — not tax advice; consult a CPA.
Schools (NCES district)
- District
- Santa Monica-Malibu Unified
- NCES district ID
- 0635700
- Math proficiency
- 61% ▬ 0.00%
- Reading proficiency
- 74% ▬ 0.00%
- Median HH income
- $81,489
- Composite
- 61.58/100
- National rank
- #1535
- State rank
- #123 of 1400 in CA
Livability — Santa Monica
- Score
- 72/100
- State rank
- #178
- US rank
- #5878
Category grades
Schools grade is shown separately in the Schools card above.
Census & demographics
- Census place
- Santa Monica, CA
- County
- Los Angeles County · 9,444,647 people
- City population
- 93,581
- Metro
- Los Angeles-Long Beach-Anaheim, CA
- Population (ZIP)
- 27,298
- Household income
- $121,241
- Rent vs Own
- Severe rent burden
- 2402.0
Population outlook (Los Angeles County) Hauer SSP2
- Today (2025)
- 10,940,515 people
- By 2030
- 11,256,481 · +2.9%
- By 2040
- 11,729,929 · +7.2%
- By 2050
- 11,948,407 · +9.2%
- By 2075
- 11,818,114 · +8.0%
- By 2100
- 10,842,928 · -0.9%
Race, ethnicity, and origin ACS 2023
- Neighborhood character
- Predominantly White (66%)
- Race & ethnicity
- White 66% Hispanic / Latino 15% Two or more races 12% Asian 8% Black 4%
- Hispanic origin (detail)
- Mexican 9%
- Common ancestry
- Romanian 5% Italian 4% Scotch-Irish 4%
- Foreign-born
- 22% · Canada, China, Dominican Republic
- Languages at home
- 73% English-only · Spanish 10% Other Indo-European 5% Other Asian/Pacific 3%
Political lean MEDSL · Los Angeles
- 2024 margin
- Solid D (+32.9) · D 64.8% · R 31.9% · Other 3.3%
- 2008→2024 swing
- -7.4pp toward R · 2008: 40.4pp · 2024: 32.9pp
- All cycles
- 2024: D+32.9 2020: D+44.2 2016: D+48.0 2012: D+40.0 2008: D+40.4
Not yet ingested
- Civics
- —
Market trends
- HPI YoY
- ▲ 4.97%
- Current HPI
- 434.8689
- Rent YoY
- ▲ 1.05%
- Metro
- Los Angeles-Long Beach-Anaheim, CA
- State GDP YoY
- ▲ 3.21%
- F500 in state
- 116
Industry mix (Fortune 500 HQ in CA)
| Industry | F500 HQs | Revenue |
|---|---|---|
| Technology | 27 | $1,492B |
|
||
| Financial Services | 3 | $174B |
|
||
| Retail | 3 | $44B |
|
||
| Insurance | 3 | $26B |
|
||
| Media / Entertainment | 2 | $115B |
|
||
| Pharmaceuticals / Biotech | 2 | $62B |
|
||
Price history
+1582.7% since first listed47 events — show timeline
- 2026-06-04 Listed $3,500,000 CRMLS
- 2026-02-27 Rental Removed $2,500 CLAW
- 2026-02-27 Relisted — CRMLS
- 2026-02-13 Price Changed $2,500 CLAW
- 2026-01-21 Price Changed $2,600 CLAW
- 2025-12-26 Listed for Rent $2,700 CLAW
- 2025-10-30 Relisted — CRMLS
- 2025-10-30 Listing Removed — CRMLS
- 2025-10-06 Relisted — CRMLS
- 2025-02-27 Listed $3,795,000 CRMLS
- 2020-03-02 Sold (MLS) $3,645,000 TheMLS
- 2020-01-16 Contingent — TheMLS
- 2019-11-19 Price Changed $3,645,000 SDMLS
- 2019-11-07 Price Changed $3,645,000 TheMLS
- 2019-09-18 Listed $3,750,000 TheMLS
- 2019-02-28 Listing Removed — SDMLS
- 2019-02-28 Delisted — TheMLS
- 2018-10-02 Price Changed — TheMLS
- 2018-06-14 Listed $3,785,000 SDMLS
- 2018-06-14 Listed — TheMLS
- 2017-10-18 Sold (Public Records) $3,570,000 Public Records
- 2017-10-18 Sold (MLS) $3,570,000 SDMLS
- 2017-10-18 Sold (MLS) $3,570,000 TheMLS
- 2017-08-28 Pending — TheMLS
- 2017-08-16 Relisted — TheMLS
- 2017-08-15 Delisted — TheMLS
- 2017-08-03 Price Changed $3,750,000 TheMLS
- 2017-07-11 Relisted — TheMLS
- 2017-07-11 Price Changed $3,875,000 TheMLS
- 2017-07-05 Delisted — TheMLS
- 2017-06-07 Price Changed $3,975,000 TheMLS
- 2017-05-22 Price Changed $4,100,000 TheMLS
- 2017-04-19 Listed $4,190,000 TheMLS
- 2017-04-19 Listed $3,750,000 SDMLS
- 2016-05-12 Delisted — TheMLS
- 2016-05-11 Listing Removed — SDMLS
- 2016-04-27 Listed — TheMLS
- 2016-04-27 Listed $3,185,000 SDMLS
- 2015-06-23 Sold (MLS) $1,840,000 SDMLS
- 2015-06-23 Sold (MLS) $1,840,000 TheMLS
- 2015-06-22 Sold (Public Records) $1,840,000 Public Records
- 2015-06-03 Pending — TheMLS
- 2015-05-03 Listed $2,100,000 TheMLS
- 2015-04-10 Listed $2,100,000 SDMLS
- 1989-08-07 Sold (Public Records) $203,630 Public Records
- 1987-06-26 Sold (Public Records) $101,000 Public Records
- 1985-08-23 Sold (Public Records) $208,000 Public Records
Property tax history
+11.9%/yrLatest (2025): $49,687 · +6.6% YoY. Source: county tax records.
Cash-flow waterfall
monthlySold comps — $/sqft
last 12 mo · ≤1 miLoading sold comps…