391 Butternut Rd · Lake Wallenpaupack Estates, PA
Flood risk 1/10 · Minimal
- FEMA flood zone
- X (unshaded)
- Chance of flooding over 30 yrs
- 0.0%
- Est. flood insurance / yr
- $507 – $1,088
Fire risk 3/10 · Minor
- Est. fire insurance / yr
- $511 – $949
Heat risk 2/10 · Minimal
- Hot days now (above 89°F)
- 7 days/yr
- Hot days in 30 yrs
- 16 days/yr
Wind risk 3/10 · Minor
- Chance of severe wind over 30 yrs
- 4.0%
Air-quality risk 2/10 · Minimal
- Unhealthy air days now
- 1 days/yr
- Unhealthy air days in 30 yrs
- 2 days/yr
Risk factors via First Street. Map © Google.
Why this score? — see what drove the B+ grade
The composite is a weighted blend of 9 inputs, each scored 0–100. Each bar is that input's sub-score; the figure is the points it added to the 100-point composite (weight × sub-score).
- Cash flow +30.0/30.0
- 1% rule +10.0/10.0
- DSCR +10.0/10.0
- ARV discount +7.5/15.0
- Appreciation +6.5/10.0
- Schools +4.4/10.0
- Rent growth +2.5/5.0
- Livability +2.5/5.0
- Condition / age +2.5/5.0
$95,000
🖨 Deal sheet 📄 Offer letter ✓ Due diligence
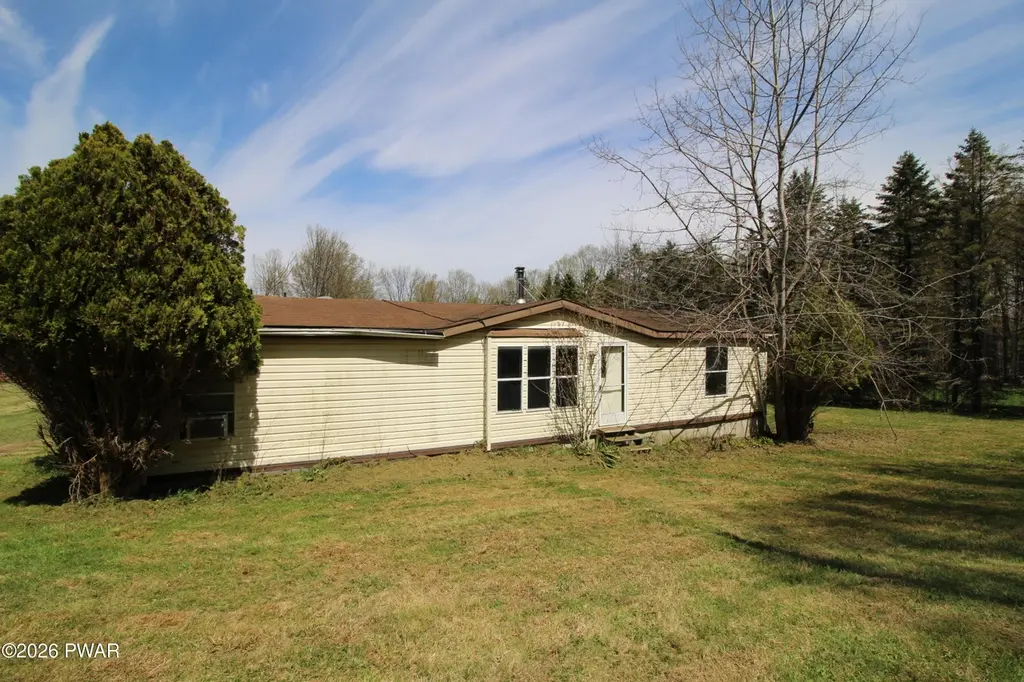
Listing remarks
No Community Dues!!! 2+ Acres in Sterling Township. Minutes from Local Shopping and Local Attractions. Mobile in NEED of Major TLC or to be REMOVED.
Key facts
- Local attractions
- 2 acres
- Local shopping
Tags
Property features AI
Exterior
- Parking: Off-street paved parking
- Utilities: Electricity connected; Water: Shared well (see remarks)
- Home design: Manufactured house; Single-level / one story; Residential, manufactured home (single family use); Property condition: Fixer
- Construction: Built as a manufactured house; Construction materials: Other; Roof: Other; No basement / foundation details not provided
- Exterior features: Other exterior features; Shed(s); Has view
Interior
- Kitchen: Range; Refrigerator
- Flooring: Carpet
- Bathrooms: 2 full bathrooms
- Heating & cooling: Has heating (type: Other); No cooling
- Interior features: Other interior features
- Laundry & utility: Laundry area in kitchen
Neighborhood map
What this means for you Summary
Snapshot
- This is a 2-bed/1.5-bath manufactured listed at $95k.
Deal economics
- At list price, monthly cash flow is $846 ($10k/yr) — positive.
- The deal already cash-flows at list — no discount required.
- Meets the 1% rule at list price ($2k rent vs $95k).
- Recommended offer: $94k (1.5% below list) — sets the bar for market timing.
Location & tenants
- Location reads: area grade B — affects rentability + tenant quality, not the cash-flow math above.
- Western Wayne SD (rural): math 39% / reading 63% proficiency, ranked #165 of 539 in PA (top 31%) — acceptable for families but not a draw, mixed tenant base, ~2y average lease.
- Market conditions: 83 active listings in the ZIP; 177 units permitted in Wayne County in 2024 (0 in 5+ unit buildings).
Forward outlook
- In year one you build about $3k of equity ($657 loan paydown + $3k appreciation (3.0% local appreciation)).
- Wayne County population projected at -17% by 2050 — secular population decline; favor cash flow + early exit over multi-decade hold.
- At projected returns (3.0% appreciation + 3.0% rent growth), your $27k cash investment doubles in ~2 years — after that, you're playing with house money.
- By year 10, paydown + projected appreciation supports a ~$34k cash-out refi (75% LTV) — recoverable capital for the next deal without selling this one.
Negotiation context
- It's been on market 17 days — a 2% lower offer ($94k) is reasonable based on typical stale-listing flexibility.
Questions for the listing agent
- Is there a deadline driving the sale (1031 exchange, divorce, estate, relocation)? That informs how much negotiation room exists.
- What's the average days-on-market for RENTAL listings here right now (not sales)? A rising rental-DOM trend means longer vacancies and softer asking-rent achievability than the comps imply.
- What's the recent tenant-quality profile in this submarket — average credit score on applications, eviction rate, late-payment / NSF rate, and stable-employment percentage? A property-management company in the area should have these aggregated.
- How much new for-sale + rental construction is in the pipeline within 1–3 miles? Heavy new supply typically softens prices + rents 12–24 months out; constrained supply supports both.
Investment metrics
- 1% rule
- 2.03% ✓
- Cap rate
- 16.98%
- Cash-on-cash
- 38.18%
- DSCR
- 2.70
- GRM
- 4.1
CMA / ARV
- ARV (median comp)
- $291,801
- List price
- $95,000
- Delta
- -67.44%
- Verdict
- UNDERPRICED
- Comps
- 7 within 2.0 mi
Projected returns pro-forma
2.99% appreciation · 3.0% rent growth · sell at horizon
- IRR
- 43.7%
- Equity multiple
- 3.46×
- Total profit
- $65,325
- Equity at exit
- $42,652
- IRR
- 43.6%
- Equity multiple
- 6.91×
- Total profit
- $157,154
- Equity at exit
- $65,682
Cash invested: $26,600 (down + closing). Projections, not guarantees.
Landlord ↔ Tenant lean methodology
- Overall (STATE)
- 62 Landlord-Friendly
- State Pennsylvania
- 62 Landlord-Friendly · EVEN
- County
- — inherits STATE
- City
- — inherits STATE
ZIP-level market 18445
- Home prices YoY
- 0.9%
- Active inventory
- 83
- Price-to-rent
- 4.1×
Monthly cashflow live
- Estimated rent
- $1,925 medium interval (Pro) →
- Mortgage (P&I)
- −$498
- Tax from tax record
- −$136 /mo · $1,636/yr
- Insurance
- −$40
- HOA
- −$0
- Vacancy / Maint / Mgmt
- −$404
- Net cashflow
- $846
Break-even live
Sensitivity live
| Price | -10% $900 | -5% $873 | +0% $846 | +5% $819 | +10% $793 |
|---|---|---|---|---|---|
| Rent | -10% $694 | -5% $770 | +0% $846 | +5% $922 | +10% $998 |
| Rate | -1.0pp $894 | -0.5pp $870 | base $846 | +0.5pp $822 | +1.0pp $797 |
UW: 25.0% down · 7.5% · 30yr · 1.5% tax · 5.0% vac · 8.0% maint · 8.0% mgmt
Financing live
Cash to close
- Down payment
- $23,750
- Closing costs
- $2,850
- Reserves months
- —
- Total cash needed
- —
Loan-product check · same deal, 3 products live
Conventional
25% down · 7.5% · 30yr
- Down + closing
- —
- Monthly P&I
- —
- Monthly cashflow
- —
- DSCR
- —
- Eligible?
- —
Personal DTI + credit; lowest rate.
DSCR
20% down · 8.5% · 30yr
- Down + closing
- —
- Monthly P&I
- —
- Monthly cashflow
- —
- DSCR
- —
- Eligible?
- —
No personal income docs; deal must DSCR.
Hard money
10% down · 12.0% · 12mo
- Down + closing
- —
- Monthly P&I
- —
- Monthly cashflow
- —
- DSCR
- —
- Eligible?
- —
Short-term bridge; refi at stabilization.
Listing history 4 events
-
2026-05-14status Pending 148-char remark
-
2026-04-27$95,000 Active 148-char remark
-
2004-01-06soldstatus $65,000
-
2000-05-18soldstatus $57,500
ⓘ Source: listings_history table (triggers on properties + properties_extension) + one-shot
backfill from property_details.listing_events for pre-trigger history.
Tax reassessment forecast PA · Partial reset (capped growth)
- Current annual tax
- $1,636 · $136/mo
- Projected year-2 tax
- $1,636 · $136/mo
- Expected delta
- $0/yr ($0/mo · 0.0%)
ⓘ Screening estimate from a state-policy table — verify with the county assessor before closing.
Climate risk First Street
- Flood 1/10 Low FEMA zone X (unshaded) · 0% chance over 30 yrs
- Wildfire 3/10 Moderate
- Heat 2/10 Low 7 d/yr ≥89°F today · 16 d/yr by 30 yrs out
- Wind 3/10 Moderate 4% chance of damaging wind over 30 yrs
- Air quality 2/10 Low 1 unhealthy d/yr today · 2 by 30 yrs out
Nearby sold comps map
Loading sold comps map…
Walkable amenities ~0.75 mi
Loading nearby amenities…
Taxation est. · year 1
- Rental income
- $23,095
- − Mortgage interest
- −$5,321
- − Property taxes
- −$1,636
- − Insurance
- −$475
- − Repairs & maintenance
- −$1,848
- − Management
- −$1,848
- − Depreciation
- −$2,764
- Taxable income
- $9,204
- Est. tax owed @ 24.0%
- −$2,209
- After-tax cash flow
- $7,947/yr
For passive investors: Depreciation is non-cash, so a rental often shows a tax loss while cash-flowing — sheltering income. Rental losses are passive: they offset passive income freely, and up to $25,000/yr can offset ordinary (W-2) income if you actively participate and your MAGI is under $100k (phasing out to $0 by $150k); unused losses carry forward. On sale, claimed depreciation is recaptured at up to 25%, and gains may owe capital-gains tax (a 1031 exchange can defer both). Figures are a year-1 estimate at your 24.0% rate — not tax advice; consult a CPA.
Schools (NCES district)
- District
- Western Wayne SD
- NCES district ID
- 4226070
- Math proficiency
- 39% ▼ -12.00%
- Reading proficiency
- 63% ▼ -6.00%
- Median HH income
- $51,358
- Composite
- 43.65/100
- National rank
- #2964
- State rank
- #165 of 539 in PA
Livability — Lake Wallenpaupack Estates
No livability data for this city. (Only ~50 U.S. cities are tracked.)
Census & demographics
- Population (ZIP)
- 2,488
Population outlook (Wayne County) Hauer SSP2
- Today (2025)
- 47,924 people
- By 2030
- 46,191 · -3.6%
- By 2040
- 42,815 · -10.7%
- By 2050
- 39,873 · -16.8%
- By 2075
- 34,556 · -27.9%
- By 2100
- 28,358 · -40.8%
Race, ethnicity, and origin ACS 2023
- Neighborhood character
- Predominantly White (77%)
- Race & ethnicity
- White 77% Hispanic / Latino 13% Two or more races 9% Asian 5%
- Hispanic origin (detail)
- Mexican 4% Puerto Rican 5% Cuban 1% Dominican 2%
- Common ancestry
- Romanian 8% Iranian 2% Estonian 1%
- Foreign-born
- 7% · Canada
- Languages at home
- 84% English-only · Spanish 8% Other Asian/Pacific 3% Other Indo-European 2%
Political lean MEDSL · Wayne
- 2024 margin
- Solid R (+37.1) · D 31.1% · R 68.2%
- 2008→2024 swing
- -24.8pp toward R · 2008: -12.3pp · 2024: -37.1pp
- All cycles
- 2024: R+37.1 2020: R+33.6 2016: R+39.7 2012: R+20.9 2008: R+12.3
Not yet ingested
- Civics
- —
Market trends
- HPI YoY
- ▲ 2.99%
- Current HPI
- 349.2006
- Rent YoY
- —
- Metro
- —
- State GDP YoY
- ▲ 1.68%
- F500 in state
- 34
Industry mix (Fortune 500 HQ in PA)
| Industry | F500 HQs | Revenue |
|---|---|---|
| Healthcare | 2 | $309B |
|
||
| Insurance | 2 | $27B |
|
||
| Telecommunications / Media | 1 | $124B |
|
||
| Industrial Distribution | 1 | $22B |
|
||
| Financial Services | 1 | $20B |
|
||
| Chemicals / Materials | 1 | $18B |
|
||
Price history
+67.0% since first listed5 events — show timeline
- 2026-06-15 Sold (MLS) $96,000 PWMLS
- 2026-05-14 Pending — PWMLS
- 2026-04-27 Listed $95,000 PWMLS
- 2004-01-06 Sold (Public Records) $65,000 Public Records
- 2000-05-18 Sold (Public Records) $57,500 Public Records
Property tax history
+0.7%/yrLatest (2026): $1,636 · +3.0% YoY. Source: county tax records.
Cash-flow waterfall
monthlySold comps — $/sqft
last 12 mo · ≤1 miLoading sold comps…