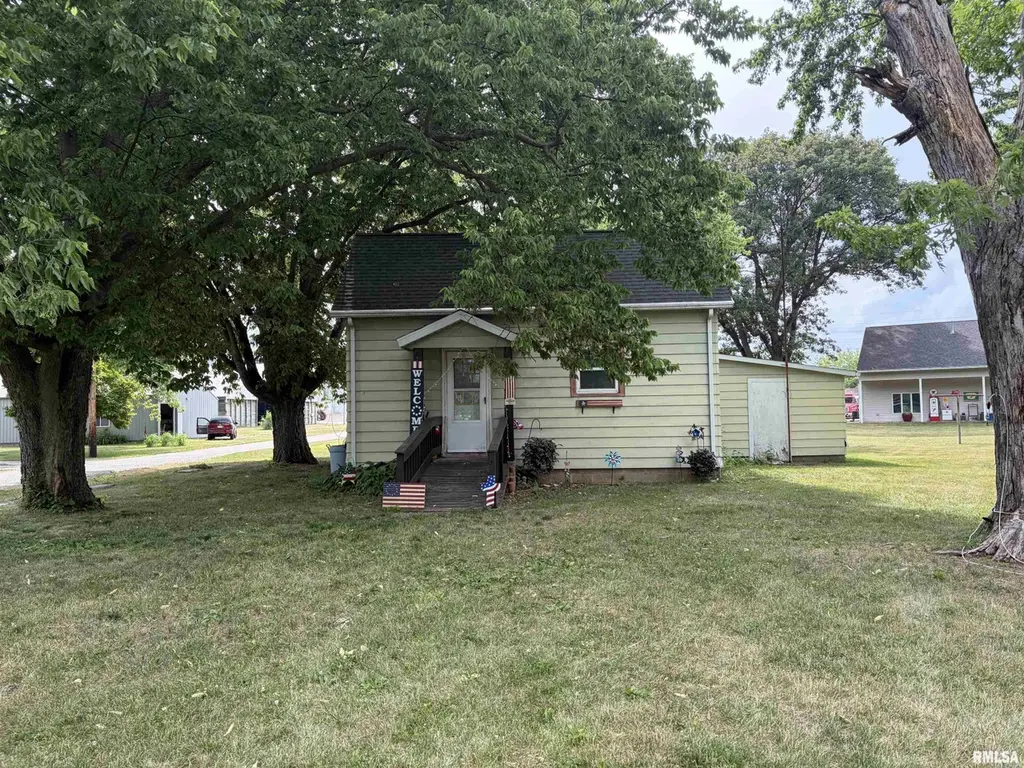
505 S Washington St · Manito, IL
Flood risk 1/10 · Minimal
- FEMA flood zone
- X (unshaded)
- Chance of flooding over 30 yrs
- 0.0%
- Est. flood insurance / yr
- $473 – $860
Fire risk 1/10 · Minimal
- Est. fire insurance / yr
- $804 – $1,492
Heat risk 3/10 · Minor
- Hot days now (above 105°F)
- 7 days/yr
- Hot days in 30 yrs
- 19 days/yr
Wind risk 2/10 · Minimal
- Chance of severe wind over 30 yrs
- 1.0%
Air-quality risk 2/10 · Minimal
- Unhealthy air days now
- 1 days/yr
- Unhealthy air days in 30 yrs
- 2 days/yr
Risk factors via First Street. Map © Google.
Why this score? — see what drove the B- grade
The composite is a weighted blend of 9 inputs, each scored 0–100. Each bar is that input's sub-score; the figure is the points it added to the 100-point composite (weight × sub-score).
- Cash flow +30.0/30.0
- 1% rule +10.0/10.0
- DSCR +10.0/10.0
- ARV discount +7.5/15.0
- Livability +3.2/5.0
- Rent growth +2.5/5.0
- Condition / age +2.2/5.0
- Schools +1.9/10.0
- Appreciation +0.0/10.0
$52,500
🖨 Deal sheet 📄 Offer letter ✓ Due diligence
Listing remarks
Coming Soon. .. Looking for an affordable investment property or a place to make your own? This 2-bedroom, 1-bath home in Manito offers plenty of potential! The property has been tenant-occupied by the same renter for the past 7 years, with the current tenant on a month-to-month lease and interested in staying, providing immediate rental income for investors. The home could also be a great opportunity for an owner-occupant ready to add some personal touches of their own. Situated on a generous lot and including an additional lot, there's plenty of outdoor space for gardening, recreation, or future possibilities. Additional features include an attached garage and an unfinished basement that
Key facts
- Garage
Property features AI
Exterior
- Parking: Attached 1-car garage
- Utilities: Public water; Public sewer
- Home design: Single-family residence; Not new construction
- Construction: Shingle roof; Year built not provided
- Exterior features: Level lot; Extra lot
Interior
- Kitchen: Kitchen with luxury vinyl plank flooring
- Bedrooms: 2 bedrooms (both on the main level)
- Flooring: Luxury vinyl plank in living room and kitchen; Carpet in bedrooms
- Bathrooms: 1 full bathroom
- Heating & cooling: Window unit heating/cooling
- Interior features: Unfinished basement; No built-in appliances listed; No fireplaces
- Laundry & utility: No laundry appliances listed
Neighborhood map
What this means for you Summary
Snapshot
- This is a 2-bed/1.0-bath single-family listed at $52k. Condition is rated fair.
Deal economics
- At list price, monthly cash flow is $276 ($3k/yr) — positive.
- The deal already cash-flows at list — no discount required.
- Meets the 1% rule at list price ($809 rent vs $52k).
Location & tenants
- Location reads 64/100 on livability (#711 in IL) — a middle-class / working-renter tenant base. Strengths: crime A+, cost of living A+, housing A; Watch: amenities F, commute F, health & safety F.
- Midwest Central CUSD 191 (rural): math 19% / reading 23% proficiency, ranked #398 of 620 in IL (top 64%) — low school quality limits family demand, transient renter base, plan for 1-2y turnover.
- Zoned schools: Midwest Central High School (math 8% / reading 12%, grade F, #567 of 693 statewide, top 83%, 252 students, 0% FRL) — zoned schools average 0% FRL vs 47% district-wide (47 pts lower); this property's tenant base skews higher-income than the district average.
- Market conditions: 9 active listings in the ZIP; 7 units permitted in Mason County in 2024 (0 in 5+ unit buildings).
Forward outlook
- Local home prices are declining (-3.0%/yr); year-one equity from $363 of loan paydown is wiped out by about $2k of value loss. Plan a longer hold.
- Mason County population projected at -30% by 2050 — secular population decline; favor cash flow + early exit over multi-decade hold.
- At projected returns (-3.0% appreciation + 3.0% rent growth), your $15k cash investment doubles in ~6 years — after that, you're playing with house money.
Negotiation context
- Only 1 days on market — expect competitive offers; lowballing is unlikely to land.
Questions for the listing agent
- Have any recent inspections been done? Can we get a copy of the seller's disclosures and any deferred-maintenance estimates?
- Is there a deadline driving the sale (1031 exchange, divorce, estate, relocation)? That informs how much negotiation room exists.
- Schools are F-rated, which usually means shorter tenancies and higher turnover. Who's the typical renter profile here, and what's been the actual vacancy rate?
- What's the average days-on-market for RENTAL listings here right now (not sales)? A rising rental-DOM trend means longer vacancies and softer asking-rent achievability than the comps imply.
- What's the recent tenant-quality profile in this submarket — average credit score on applications, eviction rate, late-payment / NSF rate, and stable-employment percentage? A property-management company in the area should have these aggregated.
- How much new for-sale + rental construction is in the pipeline within 1–3 miles? Heavy new supply typically softens prices + rents 12–24 months out; constrained supply supports both.
Investment metrics
- 1% rule
- 1.54% ✓
- Cap rate
- 12.60%
- Cash-on-cash
- 22.53%
- DSCR
- 2.00
- GRM
- 5.4
CMA / ARV
No comps found within radius.
Projected returns pro-forma
-3.0% appreciation · 3.0% rent growth · sell at horizon
- IRR
- 15.4%
- Equity multiple
- 1.62×
- Total profit
- $9,081
- Equity at exit
- $7,828
- IRR
- 24.1%
- Equity multiple
- 3.08×
- Total profit
- $30,589
- Equity at exit
- $4,539
Cash invested: $14,700 (down + closing). Projections, not guarantees.
Landlord ↔ Tenant lean methodology
- Overall (STATE)
- 43 Moderately Tenant-Leaning
- State Illinois
- 43 Moderately Tenant-Leaning · D+7
- County
- — inherits STATE
- City
- — inherits STATE
ZIP-level market 61546
- Home prices YoY
- -20.1%
- Active inventory
- 9
- Price-to-rent
- 5.4×
Monthly cashflow live
- Estimated rent
- $809 medium interval (Pro) →
- Mortgage (P&I)
- −$275
- Tax est. 1.5%
- −$66 /mo · $788/yr
- Insurance
- −$22
- HOA
- −$0
- Vacancy / Maint / Mgmt
- −$170
- Net cashflow
- $276
Break-even live
UW: 25.0% down · 7.5% · 30yr · 1.5% tax · 5.0% vac · 8.0% maint · 8.0% mgmt
Financing live
Cash to close
- Down payment
- $13,125
- Closing costs
- $1,575
- Reserves months
- —
- Total cash needed
- —
Loan-product check · same deal, 3 products live
Conventional
25% down · 7.5% · 30yr
- Down + closing
- —
- Monthly P&I
- —
- Monthly cashflow
- —
- DSCR
- —
- Eligible?
- —
Personal DTI + credit; lowest rate.
DSCR
20% down · 8.5% · 30yr
- Down + closing
- —
- Monthly P&I
- —
- Monthly cashflow
- —
- DSCR
- —
- Eligible?
- —
No personal income docs; deal must DSCR.
Hard money
10% down · 12.0% · 12mo
- Down + closing
- —
- Monthly P&I
- —
- Monthly cashflow
- —
- DSCR
- —
- Eligible?
- —
Short-term bridge; refi at stabilization.
Listing history 5 events
-
2026-06-13statusdays on market $52,500 Pending 1 DOM
-
2026-06-10days on market $52,500 Coming Soon 3 DOM
-
2026-06-09days on market $52,500 Coming Soon 2 DOM
-
2026-06-07remarks 699-char remark
-
2026-06-07$52,500 Coming Soon 1 DOM
ⓘ Source: listings_history table (triggers on properties + properties_extension) + one-shot
backfill from property_details.listing_events for pre-trigger history.
Climate risk First Street
- Flood 1/10 Low FEMA zone X (unshaded) · 0% chance over 30 yrs
- Wildfire 1/10 Low
- Heat 3/10 Moderate 7 d/yr ≥105°F today · 19 d/yr by 30 yrs out
- Wind 2/10 Low 100% chance of damaging wind over 30 yrs
- Air quality 2/10 Low 1 unhealthy d/yr today · 2 by 30 yrs out
Nearby sold comps map
Loading sold comps map…
Walkable amenities ~0.75 mi
Loading nearby amenities…
Taxation est. · year 1
- Rental income
- $9,703
- − Mortgage interest
- −$2,941
- − Property taxes
- −$788
- − Insurance
- −$262
- − Repairs & maintenance
- −$776
- − Management
- −$776
- − Depreciation
- −$1,527
- Taxable income
- $2,632
- Est. tax owed @ 24.0%
- −$632
- After-tax cash flow
- $2,680/yr
For passive investors: Depreciation is non-cash, so a rental often shows a tax loss while cash-flowing — sheltering income. Rental losses are passive: they offset passive income freely, and up to $25,000/yr can offset ordinary (W-2) income if you actively participate and your MAGI is under $100k (phasing out to $0 by $150k); unused losses carry forward. On sale, claimed depreciation is recaptured at up to 25%, and gains may owe capital-gains tax (a 1031 exchange can defer both). Figures are a year-1 estimate at your 24.0% rate — not tax advice; consult a CPA.
Condition & rehab AI · 3 photos
This single-family home in Manito, IL, requires significant repairs and maintenance, including a new roof, exterior painting, and landscaping. Immediate updates can significantly improve its curb appeal and increase its value for both resale and rental.
Repairs flagged
- Major roof — Signs of wear and discoloration suggest significant damage.
- Major exterior siding — Peeling paint and faded appearance indicate extensive damage.
- Major landscaping — Overgrown and untended appearance suggests neglect and requires significant work to improve curb appeal.
- Major interior walls/paint — No photos of interior walls or paint, but exterior condition suggests poor condition.
- Major systems — No photos of systems, but overall condition suggests they may be outdated or in need of repair.
Value-add opportunities
- Both painting the exterior — Fresh paint can significantly improve the home's curb appeal and resale value.
- Both landscaping and yard maintenance — A well-maintained yard can enhance the home's appeal and increase its rental value.
- Both roof repair — A new roof can protect the home from water damage and improve its overall condition, increasing both resale and rental value.
- Both interior painting and updates — Fresh paint and updates inside can make the home more attractive and increase its value.
- Both system upgrades — Upgrading outdated systems can improve the home's functionality and increase its value.
Renovation cost estimate screening
| Repair item | Severity | Est. cost |
|---|---|---|
| roof · Signs of wear and discoloration suggest significant damage. | Major | $15,000–50,000 |
| exterior siding · Peeling paint and faded appearance indicate extensive damage. | Major | $15,000–50,000 |
| landscaping · Overgrown and untended appearance suggests neglect and requires significant work to improve curb appeal. | Major | $15,000–50,000 |
| interior walls/paint · No photos of interior walls or paint, but exterior condition suggests poor condition. | Major | $15,000–50,000 |
| systems · No photos of systems, but overall condition suggests they may be outdated or in need of repair. | Major | $15,000–50,000 |
| Total estimated repair cost · 5 items | $75,000–250,000 |
Value-add ROI direction
- Both painting the exterior — Fresh paint can significantly improve the home's curb appeal and resale value. ↑
- Both landscaping and yard maintenance — A well-maintained yard can enhance the home's appeal and increase its rental value. ↑
- Both roof repair — A new roof can protect the home from water damage and improve its overall condition, increasing both resale and rental value. ↑
- Both interior painting and updates — Fresh paint and updates inside can make the home more attractive and increase its value. ↑
- Both system upgrades — Upgrading outdated systems can improve the home's functionality and increase its value. ↑
ⓘ Cost ranges are severity-bucket heuristics (US national rule-of-thumb). Get contractor quotes + a written scope before underwriting a rehab budget.
Schools (NCES district)
- District
- Midwest Central CUSD 191
- NCES district ID
- 1743962
- Math proficiency
- 19% ▼ -5.00%
- Reading proficiency
- 23% ▼ -6.00%
- Median HH income
- $52,499
- Composite
- 18.97/100
- National rank
- #8852
- State rank
- #398 of 620 in IL
Livability — Manito
- Score
- 64/100
- State rank
- #711
- US rank
- #14466
Category grades
Schools grade is shown separately in the Schools card above.
Census & demographics
- Census place
- Manito, IL
- Population (ZIP)
- 3,682
Population outlook (Mason County) Hauer SSP2
- Today (2025)
- 12,087 people
- By 2030
- 11,283 · -6.7%
- By 2040
- 9,766 · -19.2%
- By 2050
- 8,421 · -30.3%
- By 2075
- 5,785 · -52.1%
- By 2100
- 3,888 · -67.8%
Race, ethnicity, and origin ACS 2023
- Neighborhood character
- Predominantly White (95%)
- Race & ethnicity
- White 95% Two or more races 3% Hispanic / Latino 2%
- Common ancestry
- Iranian 2% Serbian 1% Portuguese 1%
- Foreign-born
- 1% · Canada
- Languages at home
- 98% English-only · Spanish 2%
Political lean MEDSL · Mason
- 2024 margin
- Solid R (+42.2) · D 27.8% · R 70.1% · Other 2.1%
- 2008→2024 swing
- -48.1pp toward R · 2008: 5.9pp · 2024: -42.2pp
- All cycles
- 2024: R+42.2 2020: R+39.5 2016: R+31.8 2012: R+6.3 2008: D+5.9
Not yet ingested
- Civics
- —
Market trends
- HPI YoY
- ▼ -48.61%
- Current HPI
- 193.6723
- Rent YoY
- —
- Metro
- —
- State GDP YoY
- ▲ 1.59%
- F500 in state
- 60
Industry mix (Fortune 500 HQ in IL)
| Industry | F500 HQs | Revenue |
|---|---|---|
| Insurance | 4 | $201B |
|
||
| Consumer Goods | 4 | $87B |
|
||
| Industrial Machinery | 3 | $64B |
|
||
| Healthcare | 2 | $55B |
|
||
| Retail / Pharmacy | 1 | $148B |
|
||
| Agriculture / Food | 1 | $86B |
|
||
Price history
1 event — show timeline
- 2026-06-07 Coming Soon $52,500 RMLSA as Distributed by MLS Grid
Cash-flow waterfall
monthlySold comps — $/sqft
last 12 mo · ≤1 miLoading sold comps…