 Duplex
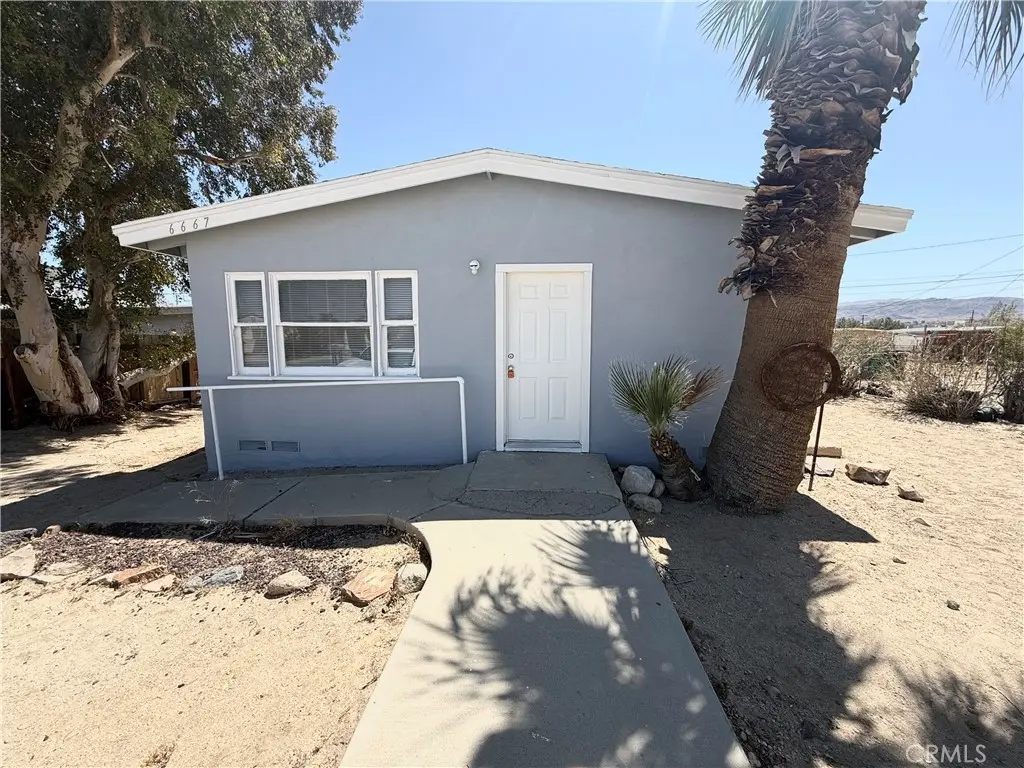
6667 Desert Queen · Twentynine Palms, CA
Flood risk 1/10 · Minimal
- FEMA flood zone
- X
- Chance of flooding over 30 yrs
- 0.0%
- Est. flood insurance / yr
- $507 – $1,088
Fire risk 1/10 · Minimal
- Est. fire insurance / yr
- $659 – $1,223
Heat risk 8/10 · Major
- Hot days now (above 103°F)
- 9 days/yr
- Hot days in 30 yrs
- 24 days/yr
Wind risk 1/10 · Minimal
- Chance of severe wind over 30 yrs
- —
Air-quality risk 6/10 · Moderate
- Unhealthy air days now
- 9 days/yr
- Unhealthy air days in 30 yrs
- 12 days/yr
Risk factors via First Street. Map © Google.
Why this score? — see what drove the C- grade
The composite is a weighted blend of 9 inputs, each scored 0–100. Each bar is that input's sub-score; the figure is the points it added to the 100-point composite (weight × sub-score).
- Cash flow +23.1/30.0
- DSCR +7.4/10.0
- ARV discount +6.8/15.0
- 1% rule +5.8/10.0
- Rent growth +3.6/5.0
- Livability +3.0/5.0
- Condition / age +2.5/5.0
- Schools +2.2/10.0
- Appreciation +0.0/10.0
$232,500
🖨 Deal sheet 📄 Offer letter ✓ Due diligence
Multi-family units
County records classify this as Multi-Family (2-4 Unit). Listing-text estimate: 2 units. confirmed
Listing remarks MLS
Great price on this income-producing duplex in the growing city of Twentynine Palms. The property features a 2-bedroom/1-bath unit A and a 1-bedroom/1-bath unit B, both offering strong rental appeal. The smaller unit is rented below market and ready for some updates, and the larger unit is recently refurbished, freshly painted, and ready to rent, with current photos. Plenty of on-site parking and excellent access to shopping, dining, and all local retail. Just minutes from Yucca Valley with its antique shops and great eateries. The property offers steady cash flow with room to increase income through strategic updates and management. Gorgeous High Desert views surround the home, and the large lot may offer potential for an additional unit. Buyers can verify options with the city, including possibilities like a Boxable-style structure. A rare opportunity at this price point in a high-demand rental market.
Key facts
- On site parking
- Large lot
- Recently refurbished
Tags
Property features AI
Finance
- Financial info: Total of 2 units (duplex); Special assessments may apply
- HOA & community: Property is on military land
Exterior
- Parking: Unpaved driveway; Has parking; Carport (contains laundry area)
- Utilities: Public/District water; Septic tank sewage
- Home design: Duplex; Attached property; Single-story; No ADU
- Construction: Year built per assessor; One common wall
- Exterior features: No pool; Zoning or lot density about 2–5 units per acre
Interior
- Bedrooms: Three main-level bedrooms
- Bathrooms: Two full bathrooms (main level)
- Heating & cooling: Wall heater; Wall/window cooling units
- Interior features: One-story layout; Entry on main level; All bedrooms on the ground floor; Property needs cosmetic repairs
- Laundry & utility: Laundry area located in the carport
Neighborhood map
What this means for you Summary
Snapshot
- This is a 2 × 3-bed/2.0-bath units multifamily listed at $232k.
Deal economics
- At list price, monthly cash flow is $415 ($5k/yr) — positive. Per door: $207/mo.
- The deal already cash-flows at list — no discount required.
- Meets the 1% rule at list price ($3k rent vs $232k).
- Recommended offer: $226k (3.0% below list) — sets the bar for market timing.
- Cap rate 8.4% vs local median 4.3% in Twentynine Palms — top-decile yield for the area; either an underpriced asset or a hidden risk that comps aren't pricing in. Stress-test before assuming the spread holds.
Location & tenants
- Location reads 59/100 on livability (#622 in CA) — a working-class tenant base; expect higher turnover. Strengths: commute A+, housing A+; Watch: schools D, amenities F, employment D-.
- Morongo Unified (town): math 15% / reading 38% proficiency, ranked #395 of 517 in CA (top 76%) — low school quality limits family demand, transient renter base, plan for 1-2y turnover.
- Market conditions: Rents rising fast (+4.5%/yr); 734 active listings in the ZIP; 5,458 units permitted in San Bernardino County in 2024 (1,500 in 5+ unit buildings).
- At $2,505/mo this rent would consume 49% of the median local household income ($61k/yr) (locally 1057% of renters already pay >50% of income on rent) — very limited rent-growth headroom before tenants either downsize or default.
Forward outlook
- Local home prices are declining (-3.0%/yr); year-one equity from $2k of loan paydown is wiped out by about $7k of value loss. Plan a longer hold.
- San Bernardino County population projected at +15% by 2050 — modest demand growth; plan on rents tracking national, not racing it.
Negotiation context
- It's been on market 56 days — a 3% lower offer ($226k) is reasonable based on typical stale-listing flexibility.
- 14 sale attempts since 26y ago with the ask held roughly flat each time — persistent listings suggest the price (not the market) is what's stuck; bring a comps-based counter.
- Current owner paid $175k; 33% above their basis — modest negotiation headroom, anchor on the comps not their cost.
Risks & watch-outs
- Watch-outs: built in 1954 — expect roof / HVAC / electrical / plumbing capex.
- Climate carrying-cost: extreme-heat days projected 9→24/yr by 2055 (HVAC capex compounding) — expect insurance premiums to compound above CPI over the hold.
Questions for the listing agent
- It's been on market 56 days. Have you received any prior offers? Is the seller open to a 3% concession, seller financing, or rate buy-down credit?
- Can we see the unit-by-unit rent roll, current vacancy, and any below-market leases? What's the average tenancy length?
- What capital expenditures (roof, boiler, parking lot, exteriors) have been made in the last 5 years, and what's planned in the next 2?
- Built in 1954 — when were the roof, HVAC, electrical panel, plumbing, and water heater last replaced?
- Is there a deadline driving the sale (1031 exchange, divorce, estate, relocation)? That informs how much negotiation room exists.
- Schools are D-rated, which usually means shorter tenancies and higher turnover. Who's the typical renter profile here, and what's been the actual vacancy rate?
- What's the average days-on-market for RENTAL listings here right now (not sales)? A rising rental-DOM trend means longer vacancies and softer asking-rent achievability than the comps imply.
- What's the recent tenant-quality profile in this submarket — average credit score on applications, eviction rate, late-payment / NSF rate, and stable-employment percentage? A property-management company in the area should have these aggregated.
- How much new apartment / multifamily construction is in the pipeline within 1–3 miles? Heavy new supply (>2% of stock underway) typically softens rents 12–24 months out; light construction supports rent growth.
Investment metrics
- 1% rule
- 1.08% ✓
- Cap rate
- 8.43%
- Cash-on-cash
- 7.65%
- DSCR
- 1.34
- GRM
- 7.7
CMA / ARV
- ARV (median comp)
- $229,168
- List price
- $232,500
- Delta
- 1.45%
- Verdict
- FAIR
- Comps
- 10 within 1.0 mi
Projected returns pro-forma
-3.0% appreciation · 4.45% rent growth · sell at horizon
- IRR
- -3.0%
- Equity multiple
- 0.88×
- Total profit
- $-7,531
- Equity at exit
- $34,667
- IRR
- 8.2%
- Equity multiple
- 1.66×
- Total profit
- $43,184
- Equity at exit
- $20,102
Cash invested: $65,100 (down + closing). Projections, not guarantees.
Landlord ↔ Tenant lean methodology
- Overall (STATE)
- 18 Strongly Tenant-Friendly
- State California
- 18 Strongly Tenant-Friendly · D+13
- County
- — inherits STATE
- City
- — inherits STATE
ZIP-level market 92277
- Home prices YoY
- -3.1%
- Rents YoY
- 4.5%
- Active inventory
- 734
- Price-to-rent
- 15.5×
Monthly cashflow live
- Estimated rent
- $2,505 high interval (Pro) →
- Mortgage (P&I)
- −$1,219
- Tax from tax record
- −$248 /mo · $2,975/yr
- Insurance
- −$97
- HOA
- −$0
- Vacancy / Maint / Mgmt
- −$526
- Net cashflow
- $415
Break-even live
2-unit breakdown (identical units grouped — click to expand)
| Units | Beds | Baths | Est. rent |
|---|---|---|---|
| 2× units | 3 | 2 | $2,506 |
| #1 | 3 | 2 | $1,253 |
| #2 | 3 | 2 | $1,253 |
| Total (2 units) | $2,505 | ||
UW: 25.0% down · 7.5% · 30yr · 1.5% tax · 5.0% vac · 8.0% maint · 8.0% mgmt
Financing live
Cash to close
- Down payment
- $58,125
- Closing costs
- $6,975
- Reserves months
- —
- Total cash needed
- —
Loan-product check · same deal, 3 products live
Conventional
25% down · 7.5% · 30yr
- Down + closing
- —
- Monthly P&I
- —
- Monthly cashflow
- —
- DSCR
- —
- Eligible?
- —
Personal DTI + credit; lowest rate.
DSCR
20% down · 8.5% · 30yr
- Down + closing
- —
- Monthly P&I
- —
- Monthly cashflow
- —
- DSCR
- —
- Eligible?
- —
No personal income docs; deal must DSCR.
Hard money
10% down · 12.0% · 12mo
- Down + closing
- —
- Monthly P&I
- —
- Monthly cashflow
- —
- DSCR
- —
- Eligible?
- —
Short-term bridge; refi at stabilization.
Listing history 50 events
-
2026-06-18days on market $232,500 Active 56 DOM
-
2026-06-17days on market $232,500 Active 55 DOM
-
2026-06-16days on market $232,500 Active 54 DOM
-
2026-06-15days on market $232,500 Active 53 DOM
-
2026-06-13days on market $232,500 Active 51 DOM
-
2026-06-13days on market $232,500 Active 50 DOM
-
2026-06-09days on market $232,500 Active 47 DOM
-
2026-06-08days on market $232,500 Active 46 DOM
-
2026-06-07days on market $232,500 Active 45 DOM
-
2026-06-04days on market $232,500 Active 42 DOM
-
2026-06-03days on market $232,500 Active 41 DOM
-
2026-06-02days on market $232,500 Active 40 DOM
-
2026-06-01days on market $232,500 Active 39 DOM
-
2026-05-31days on market $232,500 Active 38 DOM
-
2026-04-23$232,500 Active 917-char remark
-
2026-04-12$232,500 Active 917-char remark
Show marketing remark (917 chars)
Great price on this income-producing duplex in the growing city of Twentynine Palms. The property features a 2-bedroom/1-bath unit A and a 1-bedroom/1-bath unit B, both offering strong rental appeal. The smaller unit is rented below market and ready for some updates, and the larger unit is recently refurbished, freshly painted, and ready to rent, with current photos. Plenty of on-site parking and excellent access to shopping, dining, and all local retail. Just minutes from Yucca Valley with its antique shops and great eateries. The property offers steady cash flow with room to increase income through strategic updates and management. Gorgeous High Desert views surround the home, and the large lot may offer potential for an additional unit. Buyers can verify options with the city, including possibilities like a Boxable-style structure. A rare opportunity at this price point in a high-demand rental market.
-
2025-11-28Active
-
2025-11-07historical
-
2025-09-08price $256,250
-
2025-08-05$269,900 Active
-
2021-05-03soldstatus $175,000 Closed Sale
-
2021-05-03soldstatus $175,000
-
2021-02-24status Pending Sale
-
2021-02-12$165,600 Active
-
2014-05-09soldstatus $92,000
-
2014-04-30soldstatus $92,000 Closed
-
2014-04-12status Pending
-
2014-03-28price $98,000
-
2014-03-07$99,000 Active
-
2013-02-26soldstatus $32,250 Closed
-
2013-02-08status Pending
-
2013-01-17$24,150 Active
-
2006-07-05soldstatus $135,000
-
2006-07-03soldstatus $135,000
-
2006-07-01historical
-
2006-05-26soldstatus $135,000
-
2006-01-16$140,000
-
2005-12-28$140,000
-
2005-12-21$140,000
-
2005-12-17historical
-
2005-08-16$150,000
-
2005-04-28soldstatus $80,000
-
2005-04-01soldstatus $80,000
-
2004-04-08soldstatus $50,000
-
2004-04-08soldstatus $50,000
-
2003-06-09$59,900
-
2001-01-12soldstatus $50,000
-
2001-01-01historical
-
2000-11-30historical
-
2000-07-24$29,900
ⓘ Source: listings_history table (triggers on properties + properties_extension) + one-shot
backfill from property_details.listing_events for pre-trigger history.
Tax reassessment forecast CA · Resets to sale price
- Current annual tax
- $2,975 · $248/mo
- Projected year-2 tax
- $2,975 · $248/mo
- Expected delta
- $0/yr ($0/mo · 0.0%)
ⓘ Screening estimate from a state-policy table — verify with the county assessor before closing.
Climate risk First Street
- Flood 1/10 Low FEMA zone X · 0% chance over 30 yrs
- Wildfire 1/10 Low
- Heat 8/10 Severe 9 d/yr ≥103°F today · 24 d/yr by 30 yrs out
- Wind 1/10 Low
- Air quality 6/10 Major 9 unhealthy d/yr today · 12 by 30 yrs out
Nearby sold comps map
Loading sold comps map…
Walkable amenities ~0.75 mi
Loading nearby amenities…
Taxation est. · year 1
- Rental income
- $30,060
- − Mortgage interest
- −$13,024
- − Property taxes
- −$2,975
- − Insurance
- −$1,162
- − Repairs & maintenance
- −$2,405
- − Management
- −$2,405
- − Depreciation
- −$6,764
- Taxable income
- $1,326
- Est. tax owed @ 24.0%
- −$318
- After-tax cash flow
- $4,661/yr
For passive investors: Depreciation is non-cash, so a rental often shows a tax loss while cash-flowing — sheltering income. Rental losses are passive: they offset passive income freely, and up to $25,000/yr can offset ordinary (W-2) income if you actively participate and your MAGI is under $100k (phasing out to $0 by $150k); unused losses carry forward. On sale, claimed depreciation is recaptured at up to 25%, and gains may owe capital-gains tax (a 1031 exchange can defer both). Figures are a year-1 estimate at your 24.0% rate — not tax advice; consult a CPA.
Schools (NCES district)
- District
- Morongo Unified
- NCES district ID
- 0625860
- Math proficiency
- 15% ▼ -12.00%
- Reading proficiency
- 38% ▼ -3.00%
- Median HH income
- $39,399
- Composite
- 22.19/100
- National rank
- #8156
- State rank
- #395 of 517 in CA
Livability — Twentynine Palms
- Score
- 59/100
- State rank
- #622
- US rank
- #19731
Category grades
Schools grade is shown separately in the Schools card above.
Census & demographics
- Census place
- Twentynine Palms, CA
- County
- San Bernardino County · 2,030,291 people
- City population
- 26,277
- Metro
- Riverside-San Bernardino-Ontario, CA
- Population (ZIP)
- 26,277
- Household income
- $60,901
- Rent vs Own
- Severe rent burden
- 1057.0
Population outlook (San Bernardino County) Hauer SSP2
- Today (2025)
- 2,300,329 people
- By 2030
- 2,378,907 · +3.4%
- By 2040
- 2,523,137 · +9.7%
- By 2050
- 2,642,388 · +14.9%
- By 2075
- 2,880,769 · +25.2%
- By 2100
- 2,909,436 · +26.5%
Race, ethnicity, and origin ACS 2023
- Neighborhood character
- Diverse neighborhood (Simpson 0.70)
- Race & ethnicity
- White 49% Two or more races 24% Hispanic / Latino 24% Black 9% Asian 4% Pacific Islander 1% Native American 1%
- Hispanic origin (detail)
- Mexican 20%
- Common ancestry
- Italian 5% Lithuanian 3% Slovak 3%
- Foreign-born
- 9% · Canada, China, South Korea
- Languages at home
- 81% English-only · Spanish 12% Other Asian/Pacific 2% Tagalog/Filipino 1%
Political lean MEDSL · San Bernardino
- 2024 margin
- Toss-up / Even · D 47.5% · R 49.7% · Other 2.8%
- 2008→2024 swing
- -8.5pp toward R · 2008: 6.3pp · 2024: -2.1pp
- All cycles
- 2024: R+2.1 2020: D+10.7 2016: D+9.8 2012: D+5.4 2008: D+6.3
Not yet ingested
- Civics
- —
Market trends
- HPI YoY
- ▼ -12.15%
- Current HPI
- 380.5083
- Rent YoY
- ▲ 4.45%
- Metro
- Riverside-San Bernardino-Ontario, CA
- State GDP YoY
- ▲ 3.21%
- F500 in state
- 116
Industry mix (Fortune 500 HQ in CA)
| Industry | F500 HQs | Revenue |
|---|---|---|
| Technology | 27 | $1,492B |
|
||
| Financial Services | 3 | $174B |
|
||
| Retail | 3 | $44B |
|
||
| Insurance | 3 | $26B |
|
||
| Media / Entertainment | 2 | $115B |
|
||
| Pharmaceuticals / Biotech | 2 | $62B |
|
||
Price history
+677.6% since first listed37 events — show timeline
- 2026-04-23 Listed $232,500 CRMLS
- 2026-04-12 Listed $232,500 CRMLS
- 2025-11-28 Listed — TheMLS
- 2025-11-07 Listing Removed — CRMLS
- 2025-09-08 Price Changed $256,250 CRMLS
- 2025-08-05 Listed $269,900 CRMLS
- 2021-05-03 Sold (Public Records) $175,000 Public Records
- 2021-05-03 Sold (MLS) $175,000 CRMLS
- 2021-02-24 Pending — CRMLS
- 2021-02-12 Listed $165,600 CRMLS
- 2014-05-09 Sold (Public Records) $92,000 Public Records
- 2014-04-30 Sold (MLS) $92,000 CRMLS
- 2014-04-12 Pending — CRMLS
- 2014-03-28 Price Changed $98,000 CRMLS
- 2014-03-07 Listed $99,000 CRMLS
- 2013-02-26 Sold (MLS) $32,250 CRMLS
- 2013-02-08 Pending — CRMLS
- 2013-01-17 Listed $24,150 CRMLS
- 2006-07-05 Sold (Public Records) $135,000 Public Records
- 2006-07-03 Sold (MLS) $135,000 CRMLS
- 2006-07-01 Listing Removed — GPSMLS
- 2006-05-26 Sold (MLS) $135,000 CRMLS
- 2006-01-16 Listed $140,000 GPSMLS
- 2005-12-28 Listed $140,000 CRMLS
- 2005-12-21 Listed $140,000 CRMLS
- 2005-12-17 Listing Removed — CRMLS
- 2005-08-16 Listed $150,000 CRMLS
- 2005-04-28 Sold (Public Records) $80,000 Public Records
- 2005-04-01 Sold (Public Records) $80,000 Public Records
- 2004-04-08 Sold (Public Records) $50,000 Public Records
- 2004-04-08 Sold (MLS) $50,000 CRMLS
- 2003-06-09 Listed $59,900 CRMLS
- 2001-01-12 Sold (Public Records) $50,000 Public Records
- 2001-01-01 Listing Removed — GPSMLS
- 2000-11-30 Listing Removed — CRMLS
- 2000-07-24 Listed $39,900 CRMLS
- 2000-07-24 Listed $29,900 GPSMLS
Property tax history
+3.8%/yrLatest (2025): $2,975 · +6.3% YoY. Source: county tax records.
Cash-flow waterfall
monthlySold comps — $/sqft
last 12 mo · ≤1 miLoading sold comps…