11108 Mountain Ash Ln · Fort Worth, TX
Flood risk 1/10 · Minimal
- FEMA flood zone
- X (unshaded)
- Chance of flooding over 30 yrs
- 0.0%
- Est. flood insurance / yr
- $507 – $1,088
Fire risk 3/10 · Minor
- Est. fire insurance / yr
- $1,222 – $2,270
Heat risk 8/10 · Major
- Hot days now (above 109°F)
- 7 days/yr
- Hot days in 30 yrs
- 25 days/yr
Wind risk 6/10 · Moderate
- Chance of severe wind over 30 yrs
- 27.0%
Air-quality risk 3/10 · Minor
- Unhealthy air days now
- 2 days/yr
- Unhealthy air days in 30 yrs
- 3 days/yr
Risk factors via First Street. Map © Google.
Why this score? — see what drove the C- grade
The composite is a weighted blend of 9 inputs, each scored 0–100. Each bar is that input's sub-score; the figure is the points it added to the 100-point composite (weight × sub-score).
- Cash flow +17.9/30.0
- ARV discount +7.5/15.0
- DSCR +5.6/10.0
- 1% rule +4.8/10.0
- Schools +4.2/10.0
- Livability +4.0/5.0
- Condition / age +4.0/5.0
- Rent growth +2.9/5.0
- Appreciation +0.0/10.0
$190,000
🖨 Deal sheet (PDF) 📄 Offer letter ✓ Due diligence
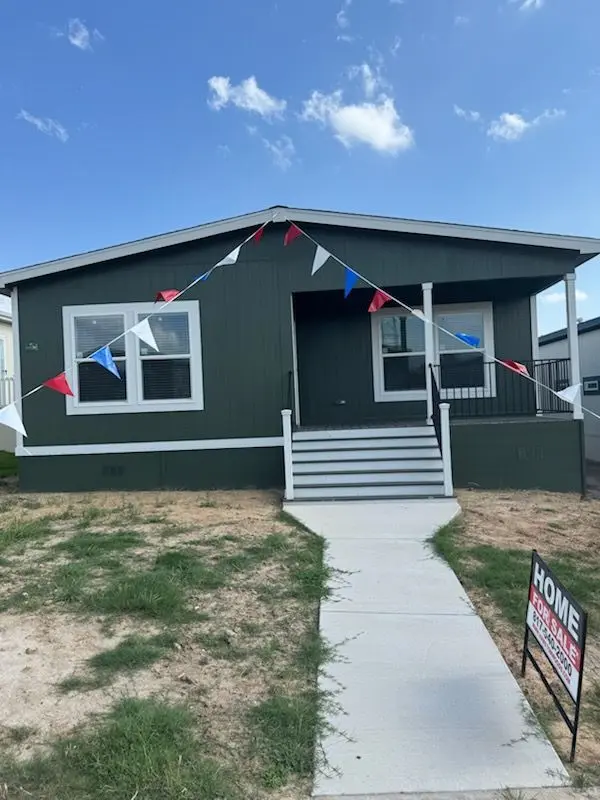
Listing remarks MLS
Sales price is subject to change without notice and not guaranteed. Pictures are for illustration purposes only. Color scheme such as paint, flooring, cabinets, backsplashes and countertops may vary. Beautiful home offers large living room with high ceilings, island kitchen, walk in pantry & stainless-steel appliances. Master bedroom has a large walk-in closet & private bath. Space rent per month is 715.00 covers amenities and majority of taxes.
Key facts
- Island kitchen
- Private bath
- Large living room
Tags
Neighborhood map
What this means for you Summary
Snapshot
- This is a 3-bed/2.0-bath single-family listed at $190k. Condition is rated good.
Deal economics
- At list price, monthly cash flow is $159 ($2k/yr) — positive.
- The deal already cash-flows at list — no discount required.
- To meet the 1% rule (rent ≥ 1% of price), the offer needs to be $186k (1.9% below list).
- Recommended offer: $167k (12.0% below list) — sets the bar for market timing.
- Cap rate 7.3% vs local median 3.9% in Fort Worth — top-decile yield for the area; either an underpriced asset or a hidden risk that comps aren't pricing in. Stress-test before assuming the spread holds.
Location & tenants
- Location reads 80/100 on livability (#49 in TX, #1,954 nationally) — a professional / high-income tenant draw. Strengths: amenities A+, cost of living A+, housing A+; Watch: schools D+, crime F.
- Hurst-Euless-Bedford ISD (suburban): math 47% / reading 50% proficiency, ranked #193 of 826 in TX (top 23%) — families likely to look elsewhere, expect single-tenant / working-renter base with shorter leases.
- Market conditions: Rents rising (+1.6%/yr); 87 active listings in the ZIP; 27 comparable units currently listed for rent nearby; rentals at typical pace (median 26d on market — plan ~3-4 weeks tenant-placement turnaround); 18,938 units permitted in Tarrant County in 2024 (8,336 in 5+ unit buildings).
- This rent runs 31% of the median local income ($73k/yr) — at the standard rent-burdened threshold; future hikes will face affordability resistance.
Forward outlook
- Local home prices are declining (-3.0%/yr); year-one equity from $1k of loan paydown is wiped out by about $6k of value loss. Plan a longer hold.
- Tarrant County population projected at +41% by 2050 — long-run rental-demand tailwind backs the buy-and-hold thesis.
Negotiation context
- It's been on market 349 days — a 12% lower offer ($167k) is reasonable based on typical stale-listing flexibility.
- 2 sale attempts with the ask held roughly flat each time — persistent listings suggest the price (not the market) is what's stuck; bring a comps-based counter.
Risks & watch-outs
- Climate carrying-cost: major wind risk, 27% chance of damaging wind over 30y; extreme-heat days projected 7→25/yr by 2055 (HVAC capex compounding) — expect insurance premiums to compound above CPI over the hold.
Questions for the listing agent
- It's been on market 349 days. Have you received any prior offers? Is the seller open to a 12% concession, seller financing, or rate buy-down credit?
- Why hasn't it sold? Are there any deal-killer items the seller is aware of (foundation, flood, title, zoning, code violations)?
- Is there a deadline driving the sale (1031 exchange, divorce, estate, relocation)? That informs how much negotiation room exists.
- Schools are D-rated, which usually means shorter tenancies and higher turnover. Who's the typical renter profile here, and what's been the actual vacancy rate?
- Crime grade is F in this area — have there been break-ins, vandalism, or insurance claims at this property in the last 3 years? What carrier currently insures it and at what premium?
- What's the average days-on-market for RENTAL listings here right now (not sales)? A rising rental-DOM trend means longer vacancies and softer asking-rent achievability than the comps imply.
- What's the recent tenant-quality profile in this submarket — average credit score on applications, eviction rate, late-payment / NSF rate, and stable-employment percentage? A property-management company in the area should have these aggregated.
- How much new for-sale + rental construction is in the pipeline within 1–3 miles? Heavy new supply typically softens prices + rents 12–24 months out; constrained supply supports both.
Investment metrics
- 1% rule
- 0.98% ✗
- Cap rate
- 7.30%
- Cash-on-cash
- 3.59%
- DSCR
- 1.16
- GRM
- 8.5
CMA / ARV
No comps found within radius.
Projected returns pro-forma
-3.0% appreciation · 1.62% rent growth · sell at horizon
- IRR
- -12.2%
- Equity multiple
- 0.56×
- Total profit
- $-23,183
- Equity at exit
- $28,330
- IRR
- -5.3%
- Equity multiple
- 0.68×
- Total profit
- $-17,217
- Equity at exit
- $16,428
Cash invested: $53,200 (down + closing). Projections, not guarantees.
Landlord ↔ Tenant lean methodology
- Overall (STATE)
- 87 Strongly Landlord-Friendly
- State Texas
- 87 Strongly Landlord-Friendly · R+5
- County
- — inherits STATE
- City
- — inherits STATE
ZIP-level market 76040
- Home prices YoY
- -23.6%
- Rents YoY
- 1.6%
- Active inventory
- 87
- Price-to-rent
- 8.5×
Monthly cashflow live
- Estimated rent
- $1,863 high interval (Pro) →
- Mortgage (P&I)
- −$996
- Tax est. 1.5%
- −$238 /mo · $2,850/yr
- Insurance
- −$79
- HOA
- −$0
- Vacancy / Maint / Mgmt
- −$391
- Net cashflow
- $159
Break-even live
Sensitivity live
| Price | -10% $290 | -5% $225 | +0% $159 | +5% $93 | +10% $28 |
|---|---|---|---|---|---|
| Rent | -10% $12 | -5% $85 | +0% $159 | +5% $233 | +10% $306 |
| Rate | -1.0pp $255 | -0.5pp $207 | base $159 | +0.5pp $110 | +1.0pp $60 |
UW: 25.0% down · 7.5% · 30yr · 1.5% tax · 5.0% vac · 8.0% maint · 8.0% mgmt
Financing live
Cash to close
- Down payment
- $47,500
- Closing costs
- $5,700
- Reserves months
- —
- Total cash needed
- —
Loan-product check · same deal, 3 products live
Conventional
25% down · 7.5% · 30yr
- Down + closing
- —
- Monthly P&I
- —
- Monthly cashflow
- —
- DSCR
- —
- Eligible?
- —
Personal DTI + credit; lowest rate.
DSCR
20% down · 8.5% · 30yr
- Down + closing
- —
- Monthly P&I
- —
- Monthly cashflow
- —
- DSCR
- —
- Eligible?
- —
No personal income docs; deal must DSCR.
Hard money
10% down · 12.0% · 12mo
- Down + closing
- —
- Monthly P&I
- —
- Monthly cashflow
- —
- DSCR
- —
- Eligible?
- —
Short-term bridge; refi at stabilization.
Rent comps 27 comps
| Address | Beds | Baths | Sqft | Rent | $/sqft | DOM | Units | Dist |
|---|---|---|---|---|---|---|---|---|
| 3520 Garrett Rd Euless, TX | 3.0 | 2.0 | 1151 | $1,945 | $1.69 | 0d | 1 | 0.52mi |
| 10684 Tube Dr Unit 502 Hurst, TX | 3.0 | 2.0 | 1778 | $1,895 | $1.07 | 5d | 1 | 0.58mi |
| 10604 Tube Dr Unit 10684-502 Hurst, TX | 3.0 | 2.0 | 1778 | $1,895 | $1.07 | 4d | 1 | 0.63mi |
| 10552 Tube Dr Unit 803 Hurst, TX | 3.0 | 2.0 | 1600 | $1,995 | $1.25 | 45d | 1 | 0.66mi |
| 10548 Tube Dr Unit 704 Hurst, TX | 3.0 | 2.0 | 1600 | $1,995 | $1.25 | 45d | 1 | 0.66mi |
| 10520 Tube Dr Unit 10552-803 Hurst, TX | 3.0 | 2.0 | 1600 | $1,995 | $1.25 | 45d | 1 | 0.68mi |
| 11450 Trinity Blvd Euless, TX | 1.0–2.0 | 1.0–2.0 | 1032 | $2,480 | $2.40 | 0d | 95 | 0.70mi |
| 3475 Valley Vista Dr Fort Worth, TX | 3.0 | 2.0 | 1500 | $1,995 | $1.33 | 25d | 1 | 0.72mi |
| 3475 Valley Vista Dr Fort Worth, TX | 3.0 | 2.0 | 1500 | $2,095 | $1.40 | 45d | 1 | 0.72mi |
| 3601 Valley Vista Dr Unit 3625-601 Hurst, TX | 2.0 | 2.5 | 1350 | $1,650 | $1.22 | 25d | 1 | 0.84mi |
| 3625 Valley Vista Dr Unit 601 Hurst, TX | 2.0 | 2.5 | 1350 | $1,650 | $1.22 | 25d | 1 | 0.85mi |
| 1601 Sotogrande Blvd Hurst, TX | 3.0 | 1.0–2.0 | 1061 | $2,175 | $2.05 | 3d | 227 | 0.87mi |
| 1304 Raider Dr Euless, TX | 1.0–3.0 | 1.0–2.0 | 835 | $1,789 | $2.14 | 0d | 17 | 0.97mi |
| 1700 Sotogrande Blvd Hurst, TX | 2.0 | 2.0 | 1080 | $1,339 | $1.24 | 25d | 1 | 0.98mi |
| 1700 Sotogrande Blvd Hurst, TX | 3.0 | 2.0 | 1321 | $2,229 | $1.69 | 8d | 1 | 0.98mi |
| 1700 Sotogrande Blvd Hurst, TX | 2.0 | 2.0 | 1080 | $1,580 | $1.46 | 6d | 1 | 0.98mi |
| 1209 Princeton Pl Euless, TX | 3.0 | 2.0 | 1671 | $2,300 | $1.38 | 18d | 1 | 1.01mi |
| 1736 Sotogrande Blvd Unit 511 Hurst, TX | 2.0 | 2.0 | 1050 | $1,075 | $1.02 | 45d | 1 | 1.04mi |
| 1736 Sotogrande Blvd Unit 1769 Hurst, TX | 3.0 | 2.0 | 1286 | $1,649 | $1.28 | 0d | 1 | 1.04mi |
| 1736 Sotogrande Blvd Unit 3121 Hurst, TX | 3.0 | 2.0 | 1286 | $1,700 | $1.32 | 0d | 1 | 1.04mi |
| 1401 Sotogrande Blvd Euless, TX | 3.0 | 2.0 | 1286 | $2,089 | $1.62 | 5d | 1 | 1.13mi |
| 1401 Sotogrande Blvd Euless, TX | 3.0 | 2.0 | 1248 | $2,246 | $1.80 | 25d | 1 | 1.13mi |
| 1401 Sotogrande Blvd Euless, TX | 2.0 | 2.0 | 1180 | $1,711 | $1.45 | 45d | 1 | 1.13mi |
| 808 McCurry Ave Bedford, TX | 3.0 | 2.0 | 1636 | $2,100 | $1.28 | 45d | 1 | 1.22mi |
| 805 Central Dr Bedford, TX | 1.0–2.0 | 1.0–2.0 | 795 | $1,420 | $1.79 | 45d | 6 | 1.27mi |
| 10150 E Hurst Blvd Hurst, TX | 3.0 | 1.0–2.0 | 917 | $2,199 | $2.40 | 45d | 9 | 1.28mi |
| 2305 Dalewood Ln Bedford, TX | 2.0 | 2.0 | 1070 | $1,975 | $1.85 | 8d | 1 | 1.47mi |
Listing history 18 events
-
2026-06-21days on market $190,000 Active 349 DOM
-
2026-06-18days on market $190,000 Active 346 DOM
-
2026-06-17days on market $190,000 Active 345 DOM
-
2026-06-16days on market $190,000 Active 344 DOM
-
2026-06-15days on market $190,000 Active 343 DOM
-
2026-06-13days on market $190,000 Active 341 DOM
-
2026-06-09days on market $190,000 Active 337 DOM
-
2026-06-08days on market $190,000 Active 336 DOM
-
2026-06-07days on market $190,000 Active 335 DOM
-
2026-06-04days on market $190,000 Active 332 DOM
-
2026-06-03days on market $190,000 Active 331 DOM
-
2026-06-02days on market $190,000 Active 330 DOM
-
2026-06-01days on market $190,000 Active 329 DOM
-
2026-05-31days on market $190,000 Active 328 DOM
-
2026-03-17status Active 461-char remark
Show marketing remark (461 chars)
Sales price is subject to change without notice and not guaranteed. Pictures are for illustration purposes only. Color scheme such as paint, flooring, cabinets, backsplashes and countertops may vary. Beautiful home offers large living room with high ceilings, island kitchen, walk in pantry & stainless-steel appliances. Master bedroom has a large walk-in closet & private bath. Space rent per month is 715.00 covers amenities and majority of taxes.
-
2026-02-13historical 461-char remark
Show marketing remark (461 chars)
Sales price is subject to change without notice and not guaranteed. Pictures are for illustration purposes only. Color scheme such as paint, flooring, cabinets, backsplashes and countertops may vary. Beautiful home offers large living room with high ceilings, island kitchen, walk in pantry & stainless-steel appliances. Master bedroom has a large walk-in closet & private bath. Space rent per month is 715.00 covers amenities and majority of taxes.
-
2025-10-02price $190,000 461-char remark
Show marketing remark (461 chars)
Sales price is subject to change without notice and not guaranteed. Pictures are for illustration purposes only. Color scheme such as paint, flooring, cabinets, backsplashes and countertops may vary. Beautiful home offers large living room with high ceilings, island kitchen, walk in pantry & stainless-steel appliances. Master bedroom has a large walk-in closet & private bath. Space rent per month is 715.00 covers amenities and majority of taxes.
-
2025-06-04$195,000 Active 461-char remark
Show marketing remark (461 chars)
Sales price is subject to change without notice and not guaranteed. Pictures are for illustration purposes only. Color scheme such as paint, flooring, cabinets, backsplashes and countertops may vary. Beautiful home offers large living room with high ceilings, island kitchen, walk in pantry & stainless-steel appliances. Master bedroom has a large walk-in closet & private bath. Space rent per month is 715.00 covers amenities and majority of taxes.
ⓘ Source: listings_history table (triggers on properties + properties_extension) + one-shot
backfill from property_details.listing_events for pre-trigger history.
Climate risk First Street
- Flood 1/10 Low FEMA zone X (unshaded) · 0% chance over 30 yrs
- Wildfire 3/10 Moderate
- Heat 8/10 Severe 7 d/yr ≥109°F today · 25 d/yr by 30 yrs out
- Wind 6/10 Major 27% chance of damaging wind over 30 yrs
- Air quality 3/10 Moderate 2 unhealthy d/yr today · 3 by 30 yrs out
Nearby sold comps map
Loading sold comps map…
Walkable amenities ~0.75 mi
Loading nearby amenities…
Taxation est. · year 1
- Rental income
- $22,361
- − Mortgage interest
- −$10,643
- − Property taxes
- −$2,850
- − Insurance
- −$950
- − Repairs & maintenance
- −$1,789
- − Management
- −$1,789
- − Depreciation
- −$5,527
- Taxable loss
- −$1,187
- Est. tax savings @ 24.0%
- +$285
- After-tax cash flow
- $2,193/yr
For passive investors: Depreciation is non-cash, so a rental often shows a tax loss while cash-flowing — sheltering income. Rental losses are passive: they offset passive income freely, and up to $25,000/yr can offset ordinary (W-2) income if you actively participate and your MAGI is under $100k (phasing out to $0 by $150k); unused losses carry forward. On sale, claimed depreciation is recaptured at up to 25%, and gains may owe capital-gains tax (a 1031 exchange can defer both). Figures are a year-1 estimate at your 24.0% rate — not tax advice; consult a CPA.
Condition & rehab AI · 12 photos
This single-family home is in good condition with modern updates, making it a solid investment for both resale and rental markets.
Value-add opportunities
- Both Paint exterior — Enhances curb appeal and resale value
- Both Replace ceiling fans — Improves energy efficiency and aesthetics
Renovation cost estimate screening
Value-add ROI direction
- Both Paint exterior — Enhances curb appeal and resale value ↑
- Both Replace ceiling fans — Improves energy efficiency and aesthetics ↑
ⓘ Cost ranges are severity-bucket heuristics (US national rule-of-thumb). Get contractor quotes + a written scope before underwriting a rehab budget.
Schools (NCES district)
- District
- Hurst-Euless-Bedford ISD
- NCES district ID
- 4824060
- Math proficiency
- 47% ▼ -15.00%
- Reading proficiency
- 50% ▼ -5.00%
- Median HH income
- $56,086
- Composite
- 42.12/100
- National rank
- #3316
- State rank
- #193 of 826 in TX
Livability — Fort Worth
- Score
- 80/100
- State rank
- #49
- US rank
- #1954
Category grades
Schools grade is shown separately in the Schools card above.
Census & demographics
- Census place
- Fort Worth, TX
- County
- Tarrant County · 2,033,669 people
- City population
- 911,619
- Metro
- Dallas-Fort Worth-Arlington, TX
- Population (ZIP)
- 31,677
- Household income
- $72,661
- Rent vs Own
- Severe rent burden
- 1361.0
Population outlook (Tarrant County) Hauer SSP2
- Today (2025)
- 2,380,417 people
- By 2030
- 2,578,900 · +8.3%
- By 2040
- 2,974,995 · +25.0%
- By 2050
- 3,350,489 · +40.8%
- By 2075
- 4,216,909 · +77.2%
- By 2100
- 4,741,527 · +99.2%
Race, ethnicity, and origin ACS 2023
- Neighborhood character
- Highly diverse neighborhood (Simpson 0.78)
- Race & ethnicity
- White 31% Black 24% Hispanic / Latino 22% Two or more races 16% Asian 14% Pacific Islander 2%
- Hispanic origin (detail)
- Mexican 16% Puerto Rican 2%
- Common ancestry
- Italian 1% Serbian 1% Lithuanian 1%
- Foreign-born
- 27% · Canada, Vietnam, China
- Languages at home
- 59% English-only · Spanish 16% Other Indo-European 8% Other Asian/Pacific 4%
Political lean MEDSL · Tarrant
- 2024 margin
- Lean R (+5.1) · D 46.7% · R 51.9% · Other 1.4%
- 2008→2024 swing
- +6.6pp toward D · 2008: -11.7pp · 2024: -5.1pp
- All cycles
- 2024: R+5.1 2020: D+0.2 2016: R+8.7 2012: R+15.7 2008: R+11.7
Not yet ingested
- Civics
- —
Market trends
- HPI YoY
- ▼ -83.82%
- Current HPI
- 271.7474
- Rent YoY
- ▲ 1.62%
- Metro
- Dallas-Fort Worth-Arlington, TX
- State GDP YoY
- ▲ 3.95%
- F500 in state
- 110
Industry mix (Fortune 500 HQ in TX)
| Industry | F500 HQs | Revenue |
|---|---|---|
| Energy | 16 | $1,198B |
|
||
| Technology | 5 | $198B |
|
||
| Engineering / Construction | 4 | $72B |
|
||
| Energy Services | 3 | $60B |
|
||
| Utilities | 3 | $41B |
|
||
| Healthcare | 2 | $330B |
|
||
Price history
-2.6% since first listed4 events — show timeline
- 2026-03-17 Relisted — Zillow
- 2026-02-13 Delisted — Zillow
- 2025-10-02 Price Changed $190,000 Zillow
- 2025-06-04 Listed $195,000 Zillow
Cash-flow waterfall
monthlySold comps — $/sqft
last 12 mo · ≤1 miLoading sold comps…