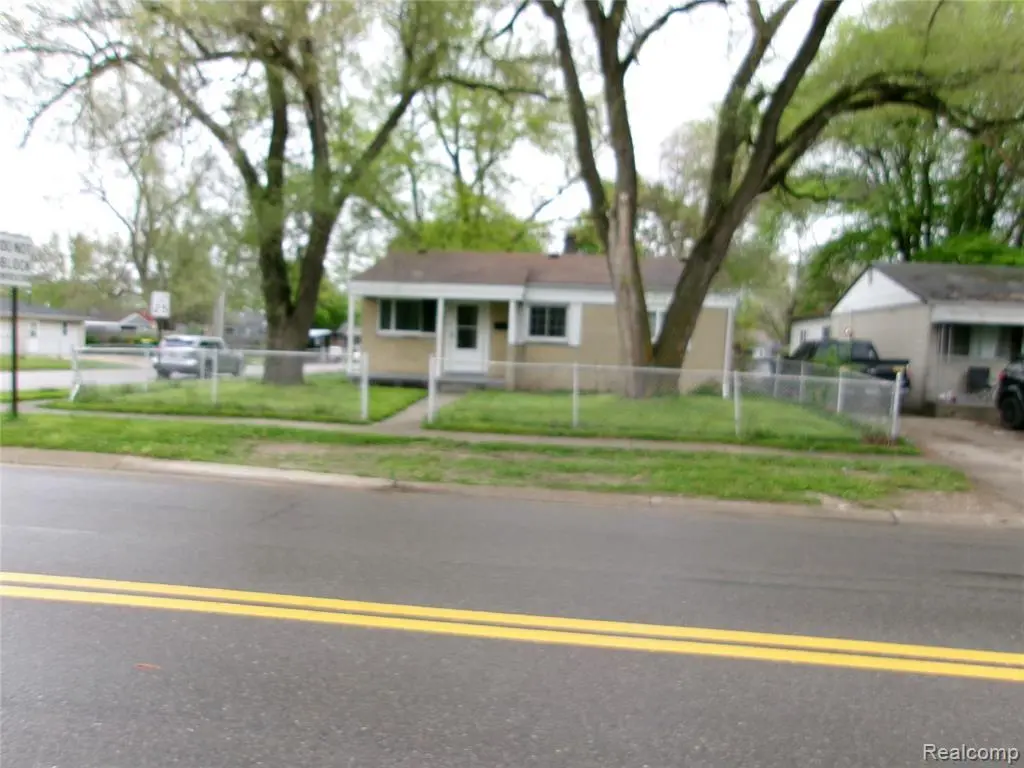
709 Dorset Ave · Ypsilanti, MI
Flood risk 1/10 · Minimal
- FEMA flood zone
- X (unshaded)
- Chance of flooding over 30 yrs
- 0.0%
- Est. flood insurance / yr
- $507 – $1,088
Fire risk 1/10 · Minimal
- Est. fire insurance / yr
- $784 – $1,456
Heat risk 3/10 · Minor
- Hot days now (above 98°F)
- 7 days/yr
- Hot days in 30 yrs
- 15 days/yr
Wind risk 2/10 · Minimal
- Chance of severe wind over 30 yrs
- —
Air-quality risk 2/10 · Minimal
- Unhealthy air days now
- 1 days/yr
- Unhealthy air days in 30 yrs
- 2 days/yr
Risk factors via First Street. Map © Google.
Why this score? — see what drove the D grade
The composite is a weighted blend of 9 inputs, each scored 0–100. Each bar is that input's sub-score; the figure is the points it added to the 100-point composite (weight × sub-score).
- Cash flow +18.9/30.0
- DSCR +6.0/10.0
- 1% rule +4.1/10.0
- Livability +4.0/5.0
- Rent growth +3.6/5.0
- ARV discount +3.5/15.0
- Condition / age +2.5/5.0
- Schools +1.3/10.0
- Appreciation +0.0/10.0
$168,000
🖨 Deal sheet (PDF) 📄 Offer letter ✓ Due diligence
Listing remarks MLS
Great Opportunity for investor! Tenant occupied! Updated 3-bedroom, 1-bath Brick home. Invest now and have tenant pay your mortgage! Tidy and clean and ready for you! Updates include flooring, paint and more! Nice corner lot close to the front of W. W. subdivision for easy access to expressway, service drive.
Key facts
- Updated paint
- Updated flooring
- Corner lot
Tags
Property features AI
Exterior
- Parking: No garage
- Utilities: Public sewer; Electric service with circuit breakers
- Home design: Single-family residence; One story; Ground-level entry with steps
- Construction: Brick construction; Slab foundation; Built area above grade approximately 850
- Exterior features: Paved road access; Lot approximately 0.14 acres (50 x 125)
Interior
- Bathrooms: 1 full bathroom
- Heating & cooling: Forced air heating (natural gas); No cooling
- Interior features: 5 total rooms
Neighborhood map
What this means for you Summary
Snapshot
- This is a 3-bed/1.0-bath single-family listed at $168k.
Deal economics
- At list price, monthly cash flow is $172 ($2k/yr) — positive.
- The deal already cash-flows at list — no discount required.
- To meet the 1% rule (rent ≥ 1% of price), the offer needs to be $153k (8.9% below list).
- Recommended offer: $153k (8.9% below list) — sets the bar for 1% rule.
- Cap rate 7.5% vs local median 3.8% in Ypsilanti — top-decile yield for the area; either an underpriced asset or a hidden risk that comps aren't pricing in. Stress-test before assuming the spread holds.
Location & tenants
- Location reads 81/100 on livability (#71 in MI, #1,539 nationally) — a professional / high-income tenant draw. Strengths: amenities A+, commute A+, cost of living A+; Watch: crime F, employment D-.
- Ypsilanti Community Schools (suburban): math 11% / reading 20% proficiency, ranked #501 of 540 in MI (top 93%) — low school quality limits family demand, transient renter base, plan for 1-2y turnover; 69% free/reduced lunch — lower-income household profile, screen leases tightly.
- Market conditions: Rents rising fast (+4.4%/yr); 166 active listings in the ZIP; 6 comparable units currently listed for rent nearby; rentals lingering (median 46d on market — plan ~5-8 weeks vacancy on turnover, expect pricing pressure); 67% of comp listings sitting > 30 days — soft ceiling on asking rent; 996 units permitted in Washtenaw County in 2024 (492 in 5+ unit buildings).
Forward outlook
- Local home prices are declining (-3.0%/yr); year-one equity from $1k of loan paydown is wiped out by about $5k of value loss. Plan a longer hold.
- Washtenaw County population projected at +25% by 2050 — long-run rental-demand tailwind backs the buy-and-hold thesis.
Negotiation context
- It's been on market 40 days — a 3% lower offer ($163k) is reasonable based on typical stale-listing flexibility.
- 22 sale attempts since 21y ago with the ask held roughly flat each time — persistent listings suggest the price (not the market) is what's stuck; bring a comps-based counter.
- Current owner paid $10k; list at $168k implies a 1563% gain — meaningful room to come down on a strong offer.
Questions for the listing agent
- It's been on market 40 days. Have you received any prior offers? Is the seller open to a 9% concession, seller financing, or rate buy-down credit?
- Built in 1964 — when were the roof, HVAC, electrical panel, plumbing, and water heater last replaced?
- Is there a deadline driving the sale (1031 exchange, divorce, estate, relocation)? That informs how much negotiation room exists.
- Crime grade is F in this area — have there been break-ins, vandalism, or insurance claims at this property in the last 3 years? What carrier currently insures it and at what premium?
- The area grade is low — what's the realistic commute time and amenity access for the typical tenant pool here? Any planned neighborhood developments (good or bad) we should know about?
- What's the average days-on-market for RENTAL listings here right now (not sales)? A rising rental-DOM trend means longer vacancies and softer asking-rent achievability than the comps imply.
- What's the recent tenant-quality profile in this submarket — average credit score on applications, eviction rate, late-payment / NSF rate, and stable-employment percentage? A property-management company in the area should have these aggregated.
- How much new for-sale + rental construction is in the pipeline within 1–3 miles? Heavy new supply typically softens prices + rents 12–24 months out; constrained supply supports both.
Investment metrics
- 1% rule
- 0.91% ✗
- Cap rate
- 7.52%
- Cash-on-cash
- 4.39%
- DSCR
- 1.20
- GRM
- 9.2
CMA / ARV
- ARV (median comp)
- $154,435
- List price
- $168,000
- Delta
- 8.78%
- Verdict
- FAIR
- Comps
- 20 within 1.0 mi
Show comp detail 12 sales within ~0.75 mi
| Address | Dist | Beds/Ba | Sqft | Sold | Price | $/sf | Match |
|---|---|---|---|---|---|---|---|
| 720 Calder Ave | 0.09mi | 3/1.0 | 850 (0%) | 1mo | $189,900 | $223 | 95 |
| 764 Dorset Ave | 0.07mi | 3/1.0 | 850 (0%) | 4mo | $190,000 | $224 | 93 |
| 803 Dorset Ave | 0.11mi | 3/1.0 | 912 (+7%) | 4mo | $150,000 | $164 | 79 |
| 289 Oregon Ave | 0.37mi | 2/1.0 (-1) | 861 (+1%) | 6mo | $145,000 | $168 | 70 |
| 1658 Foley Ave | 0.48mi | 3/1.0 | 862 (+1%) | 7mo | $220,000 | $255 | 70 |
| 366 S Harris Rd | 0.51mi | 3/1.0 | 900 (+6%) | 1mo | $208,000 | $231 | 65 |
| 1094 Nash Ave | 0.49mi | 3/1.0 | 888 (+4%) | 6mo | $150,000 | $169 | 64 |
| 207 Oregon St | 0.48mi | 3/1.0 | 895 (+5%) | 7mo | $215,000 | $240 | 63 |
| 170 Kansas Ave | 0.59mi | 2/1.0 (-1) | 875 (+3%) | 8mo | $130,000 | $149 | 56 |
| 2329 Brooktree Ct | 0.67mi | 3/1.5 | 888 (+4%) | 6mo | $165,000 | $186 | 54 |
| 1021 Desoto Ave | 0.42mi | 3/1.0 | 968 (+14%) | 5mo | $199,900 | $207 | 53 |
| 1350 Hawthorne Ave | 0.57mi | 3/1.0 | 950 (+12%) | 1mo | $159,000 | $167 | 53 |
Match score weights: distance 35% · size 25% · config 20% · recency 20%. Top-matched comps best support the ARV.
Projected returns pro-forma
-3.0% appreciation · 4.38% rent growth · sell at horizon
- IRR
- -8.1%
- Equity multiple
- 0.70×
- Total profit
- $-14,156
- Equity at exit
- $25,049
- IRR
- 3.0%
- Equity multiple
- 1.23×
- Total profit
- $10,667
- Equity at exit
- $14,526
Cash invested: $47,040 (down + closing). Projections, not guarantees.
Landlord ↔ Tenant lean methodology
- Overall (STATE)
- 62 Landlord-Friendly
- State Michigan
- 62 Landlord-Friendly · EVEN
- County
- — inherits STATE
- City
- — inherits STATE
ZIP-level market 48198
- Rents YoY
- 4.4%
- Active inventory
- 166
- Price-to-rent
- 9.2×
Monthly cashflow live
- Estimated rent
- $1,530 high interval (Pro) →
- Mortgage (P&I)
- −$881
- Tax from tax record
- −$85 /mo · $1,023/yr
- Insurance
- −$70
- HOA
- −$0
- Vacancy / Maint / Mgmt
- −$321
- Net cashflow
- $172
Break-even live
Sensitivity live
| Price | -10% $267 | -5% $220 | +0% $172 | +5% $125 | +10% $77 |
|---|---|---|---|---|---|
| Rent | -10% $51 | -5% $112 | +0% $172 | +5% $233 | +10% $293 |
| Rate | -1.0pp $257 | -0.5pp $215 | base $172 | +0.5pp $129 | +1.0pp $84 |
UW: 25.0% down · 7.5% · 30yr · 1.5% tax · 5.0% vac · 8.0% maint · 8.0% mgmt
Financing live
Cash to close
- Down payment
- $42,000
- Closing costs
- $5,040
- Reserves months
- —
- Total cash needed
- —
Loan-product check · same deal, 3 products live
Conventional
25% down · 7.5% · 30yr
- Down + closing
- —
- Monthly P&I
- —
- Monthly cashflow
- —
- DSCR
- —
- Eligible?
- —
Personal DTI + credit; lowest rate.
DSCR
20% down · 8.5% · 30yr
- Down + closing
- —
- Monthly P&I
- —
- Monthly cashflow
- —
- DSCR
- —
- Eligible?
- —
No personal income docs; deal must DSCR.
Hard money
10% down · 12.0% · 12mo
- Down + closing
- —
- Monthly P&I
- —
- Monthly cashflow
- —
- DSCR
- —
- Eligible?
- —
Short-term bridge; refi at stabilization.
Rent comps 6 comps
| Address | Beds | Baths | Sqft | Rent | $/sqft | DOM | Units | Dist |
|---|---|---|---|---|---|---|---|---|
| 1428 Village Ln Ypsilanti, MI | 1.0–2.0 | 1.0 | 860 | $1,550 | $1.80 | 45d | 1 | 0.53mi |
| 1176 Hawthorne Ave Ypsilanti, MI | 2.0 | 1.0 | 720 | $1,400 | $1.94 | 26d | 1 | 0.79mi |
| 938 Grove Rd Ypsilanti, MI | 2.0 | 1.0 | 550 | $1,430 | $2.60 | 45d | 1 | 1.25mi |
| 72 Harvey Pl Superior Township, MI | 2.0 | 1.0 | 692 | $1,100 | $1.59 | 45d | 1 | 1.26mi |
| 82 Harvey Pl Superior Township, MI | 2.0 | 1.0 | 692 | $1,100 | $1.59 | 26d | 1 | 1.27mi |
| 62 Harvey Pl Superior Township, MI | 2.0 | 1.0 | 692 | $945 | $1.37 | 45d | 1 | 1.27mi |
Listing history 50 events
-
2026-06-21days on market $168,000 Active 40 DOM
-
2026-06-18days on market $168,000 Active 37 DOM
-
2026-06-17days on market $168,000 Active 36 DOM
-
2026-06-16days on market $168,000 Active 35 DOM
-
2026-06-15days on market $168,000 Active 34 DOM
-
2026-06-13days on market $168,000 Active 32 DOM
-
2026-06-09days on market $168,000 Active 28 DOM
-
2026-06-08days on market $168,000 Active 27 DOM
-
2026-06-07days on market $168,000 Active 26 DOM
-
2026-06-04days on market $168,000 Active 23 DOM
-
2026-06-03days on market $168,000 Active 22 DOM
-
2026-06-02days on market $168,000 Active 21 DOM
-
2026-06-01days on market $168,000 Active 20 DOM
-
2026-05-31days on market $168,000 Active 19 DOM
-
2026-05-12$168,000 Active 310-char remark
Show marketing remark (310 chars)
Great Opportunity for investor! Tenant occupied! Updated 3-bedroom, 1-bath Brick home. Invest now and have tenant pay your mortgage! Tidy and clean and ready for you! Updates include flooring, paint and more! Nice corner lot close to the front of W. W. subdivision for easy access to expressway, service drive.
-
2016-08-17historical
-
2016-08-17historical
-
2016-08-17historical Temporarily Off Market
-
2016-07-15$49,500 Active
-
2016-07-15$49,500 Active
-
2016-07-15Active
-
2016-07-14historical
-
2016-07-14historical
-
2016-07-14historical Withdrawn
-
2016-03-05$49,500 Active
-
2016-03-03$49,500 Active
-
2016-03-03Active
-
2015-03-12historical
-
2015-03-12status Pending
-
2015-03-11historical Expired
-
2015-03-11historical
-
2015-03-11historical
-
2015-01-06price $42,900
-
2015-01-06price
-
2014-12-11Active
-
2014-10-27$46,000 Active
-
2014-10-27$42,900
-
2011-10-01historical
-
2011-09-30historical
-
2011-06-05
-
2011-06-05$19,900
-
2010-02-19historical
-
2010-02-19historical
-
2010-01-24
-
2010-01-24$725
-
2009-11-18historical
-
2009-11-18historical
-
2009-08-21
-
2009-08-21$30,000
ⓘ Source: listings_history table (triggers on properties + properties_extension) + one-shot
backfill from property_details.listing_events for pre-trigger history.
Tax reassessment forecast MI · Partial reset (capped growth)
- Current annual tax
- $1,023 · $85/mo
- Projected year-2 tax
- $1,805 · $150/mo
- Expected delta
- +$782/yr (+$65/mo · 76.5%)
ⓘ Screening estimate from a state-policy table — verify with the county assessor before closing.
Climate risk First Street
- Flood 1/10 Low FEMA zone X (unshaded) · 0% chance over 30 yrs
- Wildfire 1/10 Low
- Heat 3/10 Moderate 7 d/yr ≥98°F today · 15 d/yr by 30 yrs out
- Wind 2/10 Low
- Air quality 2/10 Low 1 unhealthy d/yr today · 2 by 30 yrs out
Nearby sold comps map
Loading sold comps map…
Walkable amenities ~0.75 mi
Loading nearby amenities…
Taxation est. · year 1
- Rental income
- $18,357
- − Mortgage interest
- −$9,411
- − Property taxes
- −$1,023
- − Insurance
- −$840
- − Repairs & maintenance
- −$1,469
- − Management
- −$1,469
- − Depreciation
- −$4,887
- Taxable loss
- −$741
- Est. tax savings @ 24.0%
- +$178
- After-tax cash flow
- $2,244/yr
For passive investors: Depreciation is non-cash, so a rental often shows a tax loss while cash-flowing — sheltering income. Rental losses are passive: they offset passive income freely, and up to $25,000/yr can offset ordinary (W-2) income if you actively participate and your MAGI is under $100k (phasing out to $0 by $150k); unused losses carry forward. On sale, claimed depreciation is recaptured at up to 25%, and gains may owe capital-gains tax (a 1031 exchange can defer both). Figures are a year-1 estimate at your 24.0% rate — not tax advice; consult a CPA.
Schools (NCES district)
- District
- Ypsilanti Community Schools
- NCES district ID
- 2636630
- Math proficiency
- 11% ▼ -8.00%
- Reading proficiency
- 20% ▼ -3.00%
- Median HH income
- $37,759
- Composite
- 12.98/100
- National rank
- #9572
- State rank
- #501 of 540 in MI
Livability — Ypsilanti
- Score
- 81/100
- State rank
- #71
- US rank
- #1539
Category grades
Schools grade is shown separately in the Schools card above.
Census & demographics
- County
- Washtenaw County · 306,860 people
- City population
- 105,769
- Metro
- Ann Arbor, MI
- Population (ZIP)
- 39,244
- Household income
- $63,326
- Rent vs Own
- Severe rent burden
- 1998.0
Population outlook (Washtenaw County) Hauer SSP2
- Today (2025)
- 402,878 people
- By 2030
- 424,104 · +5.3%
- By 2040
- 464,633 · +15.3%
- By 2050
- 504,728 · +25.3%
- By 2075
- 614,463 · +52.5%
- By 2100
- 676,181 · +67.8%
Race, ethnicity, and origin ACS 2023
- Neighborhood character
- Diverse neighborhood (Simpson 0.66)
- Race & ethnicity
- White 48% Black 32% Two or more races 11% Hispanic / Latino 8% Asian 2%
- Hispanic origin (detail)
- Mexican 4%
- Common ancestry
- Romanian 3% Italian 2% Slovak 2%
- Foreign-born
- 9% · Canada, China, South Korea
- Languages at home
- 88% English-only · Spanish 7% Other Indo-European 1% Arabic 1%
Political lean MEDSL · Washtenaw
- 2024 margin
- Solid D (+44.4) · D 71.0% · R 26.6% · Other 2.4%
- 2008→2024 swing
- +3.5pp toward D · 2008: 41.0pp · 2024: 44.4pp
- All cycles
- 2024: D+44.4 2020: D+46.6 2016: D+41.5 2012: D+36.0 2008: D+41.0
Not yet ingested
- Civics
- —
Market trends
- HPI YoY
- ▼ -224.96%
- Current HPI
- 204.1228
- Rent YoY
- ▲ 4.38%
- Metro
- Ann Arbor, MI
- State GDP YoY
- ▲ 1.37%
- F500 in state
- 28
Industry mix (Fortune 500 HQ in MI)
| Industry | F500 HQs | Revenue |
|---|---|---|
| Automotive Parts | 3 | $48B |
|
||
| Automotive | 2 | $372B |
|
||
| Chemicals | 1 | $45B |
|
||
| Automotive Retail | 1 | $29B |
|
||
| Healthcare / Medical Devices | 1 | $23B |
|
||
| Automotive Technology | 1 | $20B |
|
||
Price history
+500.0% since first listed53 events — show timeline
- 2026-05-12 Listed $168,000 MiRealSource-MiMLS
- 2026-05-12 Listed $168,000 REALCOMP
- 2016-08-17 Listing Removed — REALCOMP
- 2016-08-17 Delisted — AAMLS
- 2016-08-17 Listing Removed — MiRealSource-MiMLS
- 2016-07-15 Listed $49,500 MiRealSource-MiMLS
- 2016-07-15 Listed $49,500 REALCOMP
- 2016-07-15 Listed — AAMLS
- 2016-07-14 Listing Removed — REALCOMP
- 2016-07-14 Delisted — AAMLS
- 2016-07-14 Listing Removed — MiRealSource-MiMLS
- 2016-03-05 Listed $49,500 MiRealSource-MiMLS
- 2016-03-03 Listed $49,500 REALCOMP
- 2016-03-03 Listed — AAMLS
- 2015-03-12 Listing Removed — REALCOMP
- 2015-03-12 Pending — AAMLS
- 2015-03-11 Listing Removed — MiRealSource-MiMLS
- 2015-03-11 Listing Removed — MiRealSource-MiMLS
- 2015-03-11 Delisted — AAMLS
- 2015-01-06 Price Changed $42,900 REALCOMP
- 2015-01-06 Price Changed — AAMLS
- 2014-12-11 Listed — AAMLS
- 2014-10-27 Listed $42,900 MiRealSource-MiMLS
- 2014-10-27 Listed $46,000 REALCOMP
- 2011-10-01 Delisted — AAMLS
- 2011-09-30 Listing Removed — MiRealSource-MiMLS
- 2011-06-05 Listed $19,900 MiRealSource-MiMLS
- 2011-06-05 Listed — AAMLS
- 2010-02-19 Listing Removed — MiRealSource-MiMLS
- 2010-02-19 Delisted — AAMLS
- 2010-01-24 Listed $725 MiRealSource-MiMLS
- 2010-01-24 Listed — AAMLS
- 2009-11-18 Listing Removed — MiRealSource-MiMLS
- 2009-11-18 Delisted — AAMLS
- 2009-08-21 Listed $30,000 MiRealSource-MiMLS
- 2009-08-21 Listed — AAMLS
- 2009-02-25 Sold (MLS) $10,100 MiRealSource-MiMLS
- 2009-02-25 Sold (MLS) $10,100 SW Michigan MLS
- 2009-02-25 Sold (MLS) $10,100 AAMLS
- 2009-02-12 Listing Removed — MiRealSource-MiMLS
- 2009-02-12 Delisted — AAMLS
- 2008-12-12 Listed $14,900 MiRealSource-MiMLS
- 2008-12-12 Listed $14,900 SW Michigan MLS
- 2008-12-12 Listed $14,900 AAMLS
- 2006-04-07 Sold (Public Records) $125,000 Public Records
- 2006-02-28 Sold (MLS) $125,000 MiRealSource-MiMLS
- 2006-02-28 Sold (MLS) $125,000 MiRealSource-MiMLS
- 2006-01-30 Listing Removed — MiRealSource-MiMLS
- 2005-11-02 Listed $114,900 MiRealSource-MiMLS
- 2005-11-02 Listed $114,900 MiRealSource-MiMLS
- 2003-07-17 Sold (Public Records) $55,000 Public Records
- 1996-11-04 Sold (Public Records) $38,000 Public Records
- 1996-11-04 Sold (Public Records) $28,000 Public Records
Property tax history
-0.6%/yrLatest (2016): $1,023 · +0.9% YoY. Source: county tax records.
Cash-flow waterfall
monthlySold comps — $/sqft
last 12 mo · ≤1 miLoading sold comps…