2230 Walden Pond Blvd · Forney, TX
Flood risk No data
- FEMA flood zone
- —
- Chance of flooding over 30 yrs
- —
- Est. flood insurance / yr
- —
Fire risk No data
- Est. fire insurance / yr
- —
Heat risk No data
- Hot days now (above threshold)
- —
- Hot days in 30 yrs
- —
Wind risk No data
- Chance of severe wind over 30 yrs
- —
Air-quality risk No data
- Unhealthy air days now
- —
- Unhealthy air days in 30 yrs
- —
Risk factors via First Street. Map © Google.
Why this score? — see what drove the D+ grade
The composite is a weighted blend of 9 inputs, each scored 0–100. Each bar is that input's sub-score; the figure is the points it added to the 100-point composite (weight × sub-score).
- Cash flow +17.8/30.0
- ARV discount +7.5/15.0
- DSCR +5.6/10.0
- Schools +4.0/10.0
- Condition / age +4.0/5.0
- 1% rule +3.9/10.0
- Livability +3.8/5.0
- Rent growth +2.9/5.0
- Appreciation +0.0/10.0
$298,999
🖨 Deal sheet (PDF) 📄 Offer letter ✓ Due diligence
Listing remarks
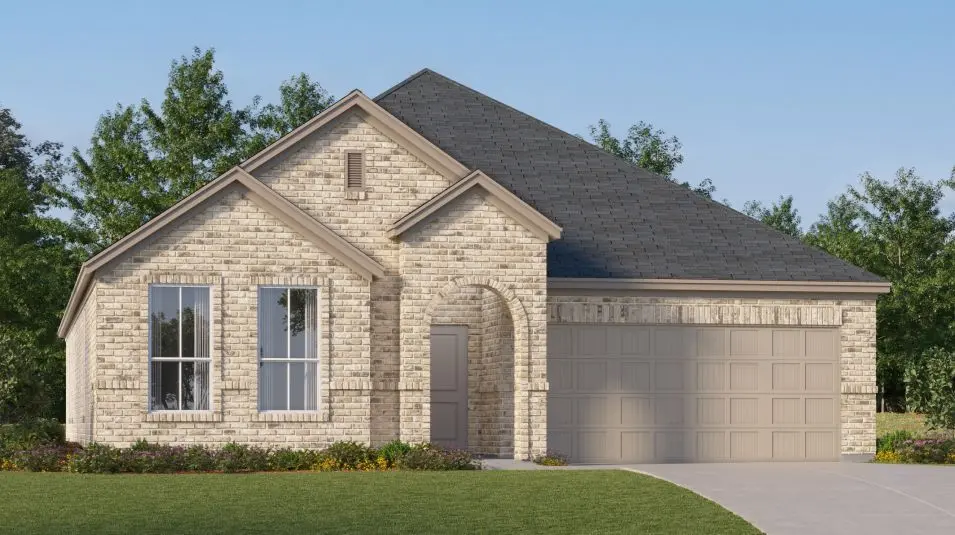
LENNAR Walden Pond- Springsteen Floorplan
Key facts
- 6,098 sq ft lot
- 2 garage spots
- Built 2025
Property features AI
Finance
- Other: Deed restrictions
- Financial info: Accepts Cash, Conventional, FHA, USDA, and VA financing; Second mortgage: no
- HOA & community: Mandatory HOA managed by Essex Management; Annual association fee ($600) covering full use of facilities, grounds maintenance, and management fees
Exterior
- Parking: Attached 2-car garage with two covered spaces; Garage faces front; 2-car single door garage
- Security: Smoke detectors; Carbon monoxide detector(s); Fire alarm
- Utilities: City water; City sewer; Concrete streets, curbs and sidewalks; Municipal Utility District; Enhanced air filtration and mechanical fresh air; Insulation and 12-inch+ attic insulation; Thermostat and rain/freeze sensors; Low flow commode and efficient windows and doors; Appliances included
- Home design: Single-family residence; One story; Residential property; New construction - incomplete (2025)
- Construction: Brick and siding exterior; Composition roof; Slab foundation; Built in 2025
- Exterior features: Covered porch(es); Landscaped yard; Sprinkler system; Wood fencing
Interior
- Kitchen: Granite countertops; Eat-in kitchen; Dishwasher; Gas oven; Gas range; Microwave; Disposal; Plumbed for gas in kitchen; Water line to refrigerator
- Bedrooms: 4 bedrooms (all on main level); Primary bedroom with walk-in closet; Additional bedrooms with walk-in closet(s)
- Flooring: Carpet; Luxury vinyl plank
- Bathrooms: 2 full bathrooms
- Heating & cooling: Central heating; Electric heating; Natural gas heating; Central air conditioning; ENERGY STAR qualified equipment
- Interior features: Open floorplan with kitchen island; Pantry; Built-in features; Decorative lighting; Cable TV available; High-speed internet available; Other; Walk-in closets
- Laundry & utility: Tankless water heater
Neighborhood map
What this means for you Summary
Snapshot
- This is a 4-bed/2.0-bath land listed at $299k. Condition is rated good.
Deal economics
- At list price, monthly cash flow is $245 ($3k/yr) — positive.
- The deal already cash-flows at list — no discount required.
- To meet the 1% rule (rent ≥ 1% of price), the offer needs to be $266k (11.1% below list).
- Recommended offer: $266k (11.1% below list) — sets the bar for 1% rule.
- Cap rate 7.3% vs local median 4.1% in Forney — top-decile yield for the area; either an underpriced asset or a hidden risk that comps aren't pricing in. Stress-test before assuming the spread holds.
Location & tenants
- Location reads 76/100 on livability (#98 in TX, #3,339 nationally) — a middle-class / working-renter tenant base. Strengths: crime A+, employment A+, cost of living A+; Watch: amenities C-, commute F.
- Forney ISD (rural): math 41% / reading 44% proficiency, ranked #234 of 826 in TX (top 28%) — families likely to look elsewhere, expect single-tenant / working-renter base with shorter leases.
- Zoned schools: Crosby El (math 37% / reading 36%, grade F, #1,883 of 4,322 statewide, top 44%, 682 students, 59% FRL); Brown Middle (math 29% / reading 39%, grade F, #892 of 1,662 statewide, top 55%, 673 students, 56% FRL); North Forney H S (math 32% / reading 45%, grade F, #866 of 1,632 statewide, top 54%, 2,502 students, 49% FRL) — zoned schools average 55% FRL vs 26% district-wide (28 pts higher); higher-poverty schools than district average — tighter screening recommended.
- Market conditions: Rents rising (+1.4%/yr); 2200 active listings in the ZIP; 40 comparable units currently listed for rent nearby; rentals at typical pace (median 23d on market — plan ~3-4 weeks tenant-placement turnaround); solid renter incomes; 1,747 units permitted in Kaufman County in 2024 (180 in 5+ unit buildings).
- This rent runs 31% of the median local income ($104k/yr) — at the standard rent-burdened threshold; future hikes will face affordability resistance.
Forward outlook
- Local home prices are declining (-3.0%/yr); year-one equity from $2k of loan paydown is wiped out by about $9k of value loss. Plan a longer hold.
- Kaufman County population projected at +43% by 2050 — long-run rental-demand tailwind backs the buy-and-hold thesis.
Negotiation context
- It's been on market 23 days — a 2% lower offer ($295k) is reasonable based on typical stale-listing flexibility.
Questions for the listing agent
- What does the HOA fee cover, when was the last increase, and are there any pending special assessments or reserve-fund shortfalls?
- Is there a deadline driving the sale (1031 exchange, divorce, estate, relocation)? That informs how much negotiation room exists.
- Schools are B-rated — typically a magnet for longer-tenancy family renters. What's the average tenant stay here, and is there a school-zone premium baked into asking?
- The area grade is low — what's the realistic commute time and amenity access for the typical tenant pool here? Any planned neighborhood developments (good or bad) we should know about?
- What's the average days-on-market for RENTAL listings here right now (not sales)? A rising rental-DOM trend means longer vacancies and softer asking-rent achievability than the comps imply.
- What's the recent tenant-quality profile in this submarket — average credit score on applications, eviction rate, late-payment / NSF rate, and stable-employment percentage? A property-management company in the area should have these aggregated.
- How much new for-sale + rental construction is in the pipeline within 1–3 miles? Heavy new supply typically softens prices + rents 12–24 months out; constrained supply supports both.
Investment metrics
- 1% rule
- 0.89% ✗
- Cap rate
- 7.28%
- Cash-on-cash
- 3.52%
- DSCR
- 1.16
- GRM
- 9.4
CMA / ARV
No comps found within radius.
Projected returns pro-forma
-3.0% appreciation · 1.42% rent growth · sell at horizon
- IRR
- -12.4%
- Equity multiple
- 0.56×
- Total profit
- $-37,081
- Equity at exit
- $44,582
- IRR
- -5.7%
- Equity multiple
- 0.65×
- Total profit
- $-29,081
- Equity at exit
- $25,852
Cash invested: $83,720 (down + closing). Projections, not guarantees.
Landlord ↔ Tenant lean methodology
- Overall (STATE)
- 87 Strongly Landlord-Friendly
- State Texas
- 87 Strongly Landlord-Friendly · R+5
- County
- — inherits STATE
- City
- — inherits STATE
ZIP-level market 75126
- Rents YoY
- 1.4%
- Active inventory
- 2200
- Price-to-rent
- 9.4×
Monthly cashflow live
- Estimated rent
- $2,659 high interval (Pro) →
- Mortgage (P&I)
- −$1,568
- Tax from tax record
- −$113 /mo · $1,352/yr
- Insurance
- −$125
- HOA
- −$50
- Vacancy / Maint / Mgmt
- −$558
- Net cashflow
- $245
Break-even live
Sensitivity live
| Price | -10% $415 | -5% $330 | +0% $245 | +5% $161 | +10% $76 |
|---|---|---|---|---|---|
| Rent | -10% $35 | -5% $140 | +0% $245 | +5% $350 | +10% $455 |
| Rate | -1.0pp $396 | -0.5pp $321 | base $245 | +0.5pp $168 | +1.0pp $89 |
UW: 25.0% down · 7.5% · 30yr · 1.5% tax · 5.0% vac · 8.0% maint · 8.0% mgmt
Financing live
Cash to close
- Down payment
- $74,750
- Closing costs
- $8,970
- Reserves months
- —
- Total cash needed
- —
Loan-product check · same deal, 3 products live
Conventional
25% down · 7.5% · 30yr
- Down + closing
- —
- Monthly P&I
- —
- Monthly cashflow
- —
- DSCR
- —
- Eligible?
- —
Personal DTI + credit; lowest rate.
DSCR
20% down · 8.5% · 30yr
- Down + closing
- —
- Monthly P&I
- —
- Monthly cashflow
- —
- DSCR
- —
- Eligible?
- —
No personal income docs; deal must DSCR.
Hard money
10% down · 12.0% · 12mo
- Down + closing
- —
- Monthly P&I
- —
- Monthly cashflow
- —
- DSCR
- —
- Eligible?
- —
Short-term bridge; refi at stabilization.
Rent comps 40 comps
| Address | Beds | Baths | Sqft | Rent | $/sqft | DOM | Units | Dist |
|---|---|---|---|---|---|---|---|---|
| 1412 Grove Pond Rd Forney, TX | 4.0 | 2.0 | 1708 | $2,500 | $1.46 | 21d | 1 | 0.26mi |
| 1408 Grove Pond Rd Forney, TX | 4.0 | 3.5 | 2543 | $3,095 | $1.22 | 45d | 1 | 0.27mi |
| 1108 Redcoat Dr , TX | 3.0 | 2.0 | 1800 | $2,250 | $1.25 | 6d | 1 | 0.34mi |
| 534 Tuscany Dr Forney, TX | 4.0 | 2.0 | 2069 | $2,500 | $1.21 | 45d | 1 | 0.36mi |
| 2207 Heaton Forney, TX | 3.0 | 2.0 | 1423 | $2,100 | $1.48 | 45d | 1 | 0.38mi |
| 1421 Kirkhill Ln Forney, TX | 4.0 | 3.0 | 2545 | $3,600 | $1.41 | 26d | 1 | 0.39mi |
| 1421 Kirkhill Ln Unit 1421 Heath, TX | 4.0 | 3.0 | 2545 | $3,500 | $1.38 | 23d | 1 | 0.39mi |
| 2213 Heaton Forney, TX | 3.0 | 2.0 | 2146 | $2,395 | $1.12 | 19d | 1 | 0.41mi |
| 2213 Heaton Forney, TX | 3.0 | 2.0 | 2146 | $2,395 | $1.12 | 9d | 1 | 0.41mi |
| 1012 Barkers Pond Ave Forney, TX | 4.0 | 2.0 | 1710 | $2,295 | $1.34 | 5d | 1 | 0.42mi |
| 525 Ardsley Ln Forney, TX | 4.0 | 2.0 | 1775 | $2,395 | $1.35 | 1d | 1 | 0.45mi |
| 2217 Perrymead Dr Forney, TX | 3.0 | 2.0 | 1423 | $2,360 | $1.66 | 6d | 1 | 0.45mi |
| 2016 Croftbank St Forney, TX | 3.0 | 2.5 | 1920 | $2,600 | $1.35 | 1d | 1 | 0.47mi |
| 2225 Heaton Forney, TX | 3.0 | 2.0 | 1909 | $2,150 | $1.13 | 45d | 1 | 0.47mi |
| 2239 Heaton Forney, TX | 5.0 | 2.5 | 2780 | $3,299 | $1.19 | 19d | 1 | 0.54mi |
| 1750 Gleasondale Pl Forney, TX | 3.0 | 2.0 | 1633 | $2,200 | $1.35 | 45d | 1 | 0.63mi |
| 2023 Avondown Rd Forney, TX | 3.0 | 2.0 | 1640 | $2,191 | $1.34 | 1d | 1 | 0.63mi |
| 1759 Gleasondale Pl Forney, TX | 3.0 | 2.0 | 1726 | $2,050 | $1.19 | 26d | 1 | 0.63mi |
| 1105 N Gateway Blvd Forney, TX | 1.0–3.0 | 1.0–2.0 | 987 | $1,842 | $1.87 | 1d | 30 | 0.63mi |
| 1430 Everett Gardens Way Forney, TX | 3.0 | 2.0 | 1465 | $1,950 | $1.33 | 15d | 1 | 0.64mi |
| 1025 Dunhill Ln Forney, TX | 4.0 | 2.0 | 2273 | $2,450 | $1.08 | 4d | 1 | 0.65mi |
| 2127 Pecan Ridge Dr Forney, TX | 3.0 | 2.0 | 2113 | $2,100 | $0.99 | 45d | 1 | 0.66mi |
| 209 Chesapeake Dr Forney, TX | 4.0 | 3.5 | 2950 | $3,400 | $1.15 | 45d | 1 | 0.67mi |
| 1462 Everett Gardens Way Forney, TX | 4.0 | 2.0 | 1858 | $2,195 | $1.18 | 4d | 1 | 0.71mi |
| 1462 Everett Gardens Way Forney, TX | 4.0 | 2.0 | 1858 | $2,195 | $1.18 | 26d | 1 | 0.71mi |
| 2902 Hanscom St Forney, TX | 4.0 | 3.5 | 2657 | $3,200 | $1.20 | 45d | 1 | 0.73mi |
| 635 Brockwell Bnd Forney, TX | 4.0 | 3.0 | 2506 | $3,300 | $1.32 | 22d | 1 | 0.81mi |
| 2421 Eldor Way Forney, TX | 4.0 | 2.0 | 1680 | $2,195 | $1.31 | 26d | 1 | 0.84mi |
| 2121 Juniper Dr Forney, TX | 4.0 | 2.0 | 1935 | $2,249 | $1.16 | 5d | 1 | 0.89mi |
| 2105 Cardinal Dr Forney, TX | 4.0 | 2.0 | 1763 | $2,200 | $1.25 | 24d | 1 | 0.89mi |
| 1448 Kingswell Ln Forney, TX | 4.0 | 3.0 | 2208 | $2,950 | $1.34 | 26d | 1 | 0.90mi |
| 2201 Woodberry Dr Forney, TX | 3.0 | 2.0 | 1839 | $2,050 | $1.11 | 45d | 1 | 0.90mi |
| 1017 Somerset Cir Forney, TX | 3.0 | 2.0 | 2185 | $2,375 | $1.09 | 9d | 1 | 0.90mi |
| 1036 Edgefield Ln Forney, TX | 3.0 | 2.5 | 2800 | $6,700 | $2.39 | 45d | 1 | 0.91mi |
| 2106 Bluebell Forney, TX | 3.0 | 2.0 | 1541 | $1,950 | $1.27 | 7d | 1 | 0.93mi |
| 1410 Crossford Trl Forney, TX | 3.0 | 2.5 | 2707 | $2,650 | $0.98 | 4d | 1 | 0.95mi |
| 236 Pennridge Dr Forney, TX | 3.0 | 2.0 | 1871 | $2,295 | $1.23 | 26d | 1 | 0.95mi |
| 2029 Cone Flower Dr Forney, TX | 3.0 | 2.0 | 1604 | $1,816 | $1.13 | 9d | 1 | 0.98mi |
| 108 Antler Trl Forney, TX | 4.0 | 2.0 | 2250 | $2,449 | $1.09 | 26d | 1 | 0.99mi |
| 120 Garner Ct Forney, TX | 3.0 | 2.0 | 2214 | $2,500 | $1.13 | 45d | 1 | 0.99mi |
HOA detail
- Monthly dues
- $50 · $600/yr
Listing history 15 events
-
2026-06-21statusdays on market $298,999 Pending 23 DOM
-
2026-06-18days on market $298,999 Active 22 DOM
-
2026-06-17days on market $298,999 Active 21 DOM
-
2026-06-16days on market $298,999 Active 20 DOM
-
2026-06-15days on market $298,999 Active 19 DOM
-
2026-06-13days on market $298,999 Active 17 DOM
-
2026-06-13days on market $298,999 Active 16 DOM
-
2026-06-09days on market $298,999 Active 13 DOM
-
2026-06-08days on market $298,999 Active 12 DOM
-
2026-06-07days on market $298,999 Active 11 DOM
-
2026-06-04days on market $298,999 Active 8 DOM
-
2026-06-03days on market $298,999 Active 7 DOM
-
2026-06-02days on market $298,999 Active 6 DOM
-
2026-06-01days on market $298,999 Active 5 DOM
-
2026-05-31days on market $298,999 Active 4 DOM
ⓘ Source: listings_history table (triggers on properties + properties_extension) + one-shot
backfill from property_details.listing_events for pre-trigger history.
Tax reassessment forecast TX · Resets to sale price
- Current annual tax
- $1,352 · $113/mo
- Projected year-2 tax
- $5,472 · $456/mo
- Expected delta
- +$4,120/yr (+$343/mo · 304.8%)
ⓘ Screening estimate from a state-policy table — verify with the county assessor before closing.
Nearby sold comps map
Loading sold comps map…
Walkable amenities ~0.75 mi
Loading nearby amenities…
Taxation est. · year 1
- Rental income
- $31,906
- − Mortgage interest
- −$16,749
- − Property taxes
- −$1,352
- − Insurance
- −$1,495
- − Repairs & maintenance
- −$2,552
- − Management
- −$2,552
- − HOA
- −$600
- − Depreciation
- −$8,698
- Taxable loss
- −$2,092
- Est. tax savings @ 24.0%
- +$502
- After-tax cash flow
- $3,445/yr
For passive investors: Depreciation is non-cash, so a rental often shows a tax loss while cash-flowing — sheltering income. Rental losses are passive: they offset passive income freely, and up to $25,000/yr can offset ordinary (W-2) income if you actively participate and your MAGI is under $100k (phasing out to $0 by $150k); unused losses carry forward. On sale, claimed depreciation is recaptured at up to 25%, and gains may owe capital-gains tax (a 1031 exchange can defer both). Figures are a year-1 estimate at your 24.0% rate — not tax advice; consult a CPA.
Condition & rehab AI · 12 photos
This home is in excellent condition with modern finishes and a move-in-ready appearance. Minor exterior touch-ups and cleaning would further enhance its curb appeal and rental value.
Value-add opportunities
- Resale Paint exterior trim — Enhances curb appeal
- Rental Clean gutters — Keeps property in good condition
Renovation cost estimate screening
Value-add ROI direction
- Resale Paint exterior trim — Enhances curb appeal ↑
- Rental Clean gutters — Keeps property in good condition ↑
ⓘ Cost ranges are severity-bucket heuristics (US national rule-of-thumb). Get contractor quotes + a written scope before underwriting a rehab budget.
Schools (NCES district)
- District
- Forney ISD
- NCES district ID
- 4819560
- Math proficiency
- 41% ▼ -20.00%
- Reading proficiency
- 44% ▼ -12.00%
- Median HH income
- $86,679
- Composite
- 40.07/100
- National rank
- #3812
- State rank
- #234 of 826 in TX
Livability — Forney
- Score
- 76/100
- State rank
- #98
- US rank
- #3339
Category grades
Schools grade is shown separately in the Schools card above.
Census & demographics
- County
- Kaufman County · 122,338 people
- City population
- 84,799
- Metro
- Dallas-Fort Worth-Arlington, TX
- Population (ZIP)
- 84,799
- Household income
- $103,673
- Rent vs Own
- Severe rent burden
- 1306.0
Population outlook (Kaufman County) Hauer SSP2
- Today (2025)
- 138,716 people
- By 2030
- 150,815 · +8.7%
- By 2040
- 174,877 · +26.1%
- By 2050
- 198,020 · +42.8%
- By 2075
- 251,908 · +81.6%
- By 2100
- 285,325 · +105.7%
Race, ethnicity, and origin ACS 2023
- Neighborhood character
- Diverse neighborhood (Simpson 0.68)
- Race & ethnicity
- White 45% Black 25% Hispanic / Latino 23% Two or more races 14% Asian 3%
- Hispanic origin (detail)
- Mexican 18% Puerto Rican 1%
- Common ancestry
- Italian 2% Slovak 1% Portuguese 1%
- Foreign-born
- 12% · Canada, Vietnam
- Languages at home
- 79% English-only · Spanish 14% Arabic 1% Vietnamese 1%
Political lean MEDSL · Kaufman
- 2024 margin
- Strong R (+27.9) · D 35.6% · R 63.5%
- 2008→2024 swing
- +7.9pp toward D · 2008: -35.8pp · 2024: -27.9pp
- All cycles
- 2024: R+27.9 2020: R+33.9 2016: R+47.0 2012: R+44.4 2008: R+35.8
Not yet ingested
- Civics
- —
Market trends
- HPI YoY
- ▼ -102.93%
- Current HPI
- 148.5749
- Rent YoY
- ▲ 1.42%
- Metro
- Dallas-Fort Worth-Arlington, TX
- State GDP YoY
- ▲ 3.95%
- F500 in state
- 110
Industry mix (Fortune 500 HQ in TX)
| Industry | F500 HQs | Revenue |
|---|---|---|
| Energy | 16 | $1,198B |
|
||
| Technology | 5 | $198B |
|
||
| Engineering / Construction | 4 | $72B |
|
||
| Energy Services | 3 | $60B |
|
||
| Utilities | 3 | $41B |
|
||
| Healthcare | 2 | $330B |
|
||
Price history
2 events — show timeline
- 2026-06-19 Pending — NTREIS
- 2026-05-27 Listed $298,999 NTREIS
Property tax history
+104.8%/yrLatest (2025): $1,352 · +104.8% YoY. Source: county tax records.
Cash-flow waterfall
monthlySold comps — $/sqft
last 12 mo · ≤1 miLoading sold comps…