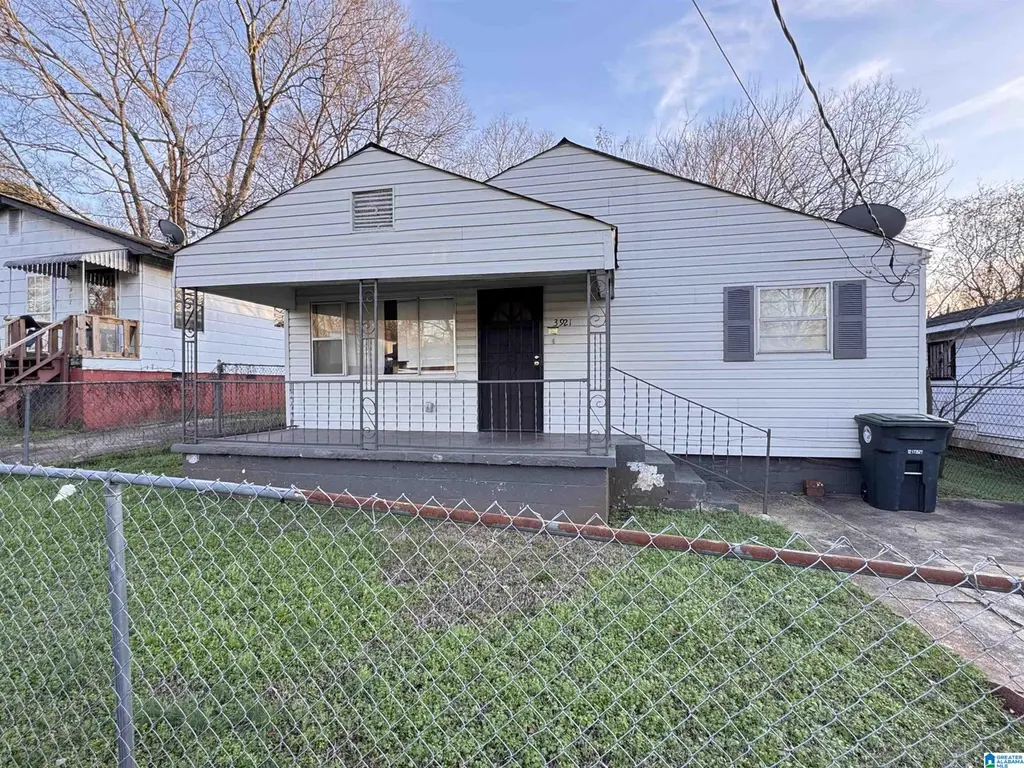
3921 Viola Ave SW · Birmingham, AL
Flood risk 1/10 · Minimal
- FEMA flood zone
- X (unshaded)
- Chance of flooding over 30 yrs
- 0.0%
- Est. flood insurance / yr
- $507 – $1,088
Fire risk 3/10 · Minor
- Est. fire insurance / yr
- $916 – $1,700
Heat risk 6/10 · Moderate
- Hot days now (above 108°F)
- 7 days/yr
- Hot days in 30 yrs
- 19 days/yr
Wind risk 6/10 · Moderate
- Chance of severe wind over 30 yrs
- 27.0%
Air-quality risk 3/10 · Minor
- Unhealthy air days now
- 2 days/yr
- Unhealthy air days in 30 yrs
- 5 days/yr
Risk factors via First Street. Map © Google.
Why this score? — see what drove the B- grade
The composite is a weighted blend of 9 inputs, each scored 0–100. Each bar is that input's sub-score; the figure is the points it added to the 100-point composite (weight × sub-score).
- Cash flow +30.0/30.0
- DSCR +10.0/10.0
- 1% rule +9.7/10.0
- ARV discount +5.5/15.0
- Appreciation +4.3/10.0
- Livability +3.4/5.0
- Rent growth +2.5/5.0
- Condition / age +2.5/5.0
- Schools +0.9/10.0
$75,000
🖨 Deal sheet 📄 Offer letter ✓ Due diligence
Listing remarks MLS
This updated 3-bedroom, 1-bath home in Birmingham was remodeled just three years ago and is truly move-in ready. Featuring modern finishes, an open and spacious layout, and abundant natural light, this home offers comfortable and stylish living. The updated kitchen includes contemporary cabinetry, updated granite countertops, and newer appliances, making it ideal for everyday living and entertaining. Beautiful flooring flows throughout the home, enhancing the fresh and inviting atmosphere. With a newer roof, updated systems, and low-maintenance living, this property is perfect for first-time buyers, downsizers, or investors looking for a turnkey rental opportunity. Conveniently located near shopping, dining, schools, and major highways, this Birmingham home combines value, location, and modern updates in one attractive package.
Key facts
- Beautiful flooring
- Newer roof
- Newer appliances
Tags
Neighborhood map
What this means for you Summary
Snapshot
- This is a 3-bed/1.0-bath single-family listed at $75k.
Deal economics
- At list price, monthly cash flow is $321 ($4k/yr) — positive.
- The deal already cash-flows at list — no discount required.
- Meets the 1% rule at list price ($1k rent vs $75k).
- Recommended offer: $66k (12.0% below list) — sets the bar for market timing.
- Cap rate 11.4% vs local median 6.2% in Birmingham — top-decile yield for the area; either an underpriced asset or a hidden risk that comps aren't pricing in. Stress-test before assuming the spread holds.
Location & tenants
- Location reads 67/100 on livability (#78 in AL) — a middle-class / working-renter tenant base. Strengths: commute A+, cost of living A+, housing A+; Watch: amenities C-, schools F, crime F.
- Birmingham City (urban): math 4% / reading 20% proficiency, ranked #116 of 129 in AL (top 90%) — low school quality limits family demand, transient renter base, plan for 1-2y turnover; 82% free/reduced lunch — lower-income household profile, screen leases tightly.
- Market conditions: 26 active listings in the ZIP; 38 comparable units currently listed for rent nearby; rentals at typical pace (median 24d on market — plan ~3-4 weeks tenant-placement turnaround); 47% of comp listings sitting > 30 days — soft ceiling on asking rent; 2,114 units permitted in Jefferson County in 2024 (556 in 5+ unit buildings).
Forward outlook
- Local home prices are declining (-1.3%/yr); year-one equity from $519 of loan paydown is wiped out by about $988 of value loss. Plan a longer hold.
- Jefferson County population projected to shrink 4% by 2050 — rents likely to lag national; underwrite the cash flow, not the appreciation.
- At projected returns (-1.3% appreciation + 3.0% rent growth), your $21k cash investment doubles in ~6 years — after that, you're playing with house money.
Negotiation context
- It's been on market 140 days — a 12% lower offer ($66k) is reasonable based on typical stale-listing flexibility.
- 4 sale attempts since 13y ago; this cycle's ask has dropped $15k (17%) from the opening price — seller is motivated, your offer sets the floor, not the list.
- Current owner paid $42k; list at $75k implies a 79% gain — meaningful room to come down on a strong offer.
Risks & watch-outs
- Watch-outs: built in 1936 — expect roof / HVAC / electrical / plumbing capex.
- Climate carrying-cost: major wind risk, 27% chance of damaging wind over 30y; extreme-heat days projected 7→19/yr by 2055 (HVAC capex compounding) — expect insurance premiums to compound above CPI over the hold.
Questions for the listing agent
- It's been on market 140 days. Have you received any prior offers? Is the seller open to a 12% concession, seller financing, or rate buy-down credit?
- Built in 1936 — when were the roof, HVAC, electrical panel, plumbing, and water heater last replaced?
- Why hasn't it sold? Are there any deal-killer items the seller is aware of (foundation, flood, title, zoning, code violations)?
- Is there a deadline driving the sale (1031 exchange, divorce, estate, relocation)? That informs how much negotiation room exists.
- Schools are F-rated, which usually means shorter tenancies and higher turnover. Who's the typical renter profile here, and what's been the actual vacancy rate?
- Crime grade is F in this area — have there been break-ins, vandalism, or insurance claims at this property in the last 3 years? What carrier currently insures it and at what premium?
- What's the average days-on-market for RENTAL listings here right now (not sales)? A rising rental-DOM trend means longer vacancies and softer asking-rent achievability than the comps imply.
- What's the recent tenant-quality profile in this submarket — average credit score on applications, eviction rate, late-payment / NSF rate, and stable-employment percentage? A property-management company in the area should have these aggregated.
- How much new for-sale + rental construction is in the pipeline within 1–3 miles? Heavy new supply typically softens prices + rents 12–24 months out; constrained supply supports both.
Investment metrics
- 1% rule
- 1.47% ✓
- Cap rate
- 11.42%
- Cash-on-cash
- 18.32%
- DSCR
- 1.82
- GRM
- 5.7
CMA / ARV
- ARV (median comp)
- $71,806
- List price
- $75,000
- Delta
- 4.45%
- Verdict
- FAIR
- Comps
- 20 within 1.0 mi
Show comp detail 12 sales within ~0.75 mi
| Address | Dist | Beds/Ba | Sqft | Sold | Price | $/sf | Match |
|---|---|---|---|---|---|---|---|
| 3720 Howard Ave SW | 0.16mi | 3/1.0 | 1,092 (-2%) | 6mo | $64,000 | $59 | 84 |
| 4008 Grasselli Ave | 0.22mi | 3/1.0 | 1,153 (+3%) | 8mo | $85,000 | $74 | 78 |
| 4100 Park Ave | 0.30mi | 3/1.0 | 1,125 (+1%) | 10mo | $82,500 | $73 | 76 |
| 3729 Pine Ave SW | 0.25mi | 3/1.0 | 1,067 (-5%) | 5mo | $70,000 | $66 | 76 |
| 3304 Spaulding St SW | 0.29mi | 3/2.0 | 1,140 (+2%) | 8mo | $40,000 | $35 | 73 |
| 3008 Elmyra Dr | 0.32mi | 3/2.0 | 1,104 (-1%) | 13mo | $88,000 | $80 | 68 |
| 3317 46th St SW | 0.48mi | 4/2.0 (+1) | 1,103 (-1%) | 2mo | $6,000 | $5 | 65 |
| 4628 SW Hillman Dr | 0.50mi | 4/2.0 (+1) | 1,166 (+4%) | 1mo | $69,900 | $60 | 59 |
| 3321 Cedar Ave SW | 0.71mi | 3/1.0 | 1,100 (-2%) | 10mo | $65,000 | $59 | 55 |
| 3509 Willard Ave SW | 0.48mi | 3/1.0 | 1,040 (-7%) | 12mo | $95,000 | $91 | 55 |
| 2812 32nd Way SW | 0.69mi | 3/1.0 | 1,205 (+8%) | 4mo | $35,000 | $29 | 52 |
| 3112 Wenonah Dr SW | 0.62mi | 3/2.0 | 1,154 (+3%) | 14mo | $69,900 | $61 | 50 |
Match score weights: distance 35% · size 25% · config 20% · recency 20%. Top-matched comps best support the ARV.
Projected returns pro-forma
-1.32% appreciation · 3.0% rent growth · sell at horizon
- IRR
- 14.7%
- Equity multiple
- 1.65×
- Total profit
- $13,738
- Equity at exit
- $16,967
- IRR
- 21.0%
- Equity multiple
- 3.07×
- Total profit
- $43,420
- Equity at exit
- $16,865
Cash invested: $21,000 (down + closing). Projections, not guarantees.
Landlord ↔ Tenant lean methodology
- Overall (STATE)
- 90 Strongly Landlord-Friendly
- State Alabama
- 90 Strongly Landlord-Friendly · R+15
- County
- — inherits STATE
- City
- — inherits STATE
ZIP-level market 35221
- Home prices YoY
- -1.1%
- Active inventory
- 26
- Price-to-rent
- 5.7×
Monthly cashflow live
- Estimated rent
- $1,100 high interval (Pro) →
- Mortgage (P&I)
- −$393
- Tax from tax record
- −$123 /mo · $1,482/yr
- Insurance
- −$31
- HOA
- −$0
- Vacancy / Maint / Mgmt
- −$231
- Net cashflow
- $321
Break-even live
UW: 25.0% down · 7.5% · 30yr · 1.5% tax · 5.0% vac · 8.0% maint · 8.0% mgmt
Financing live
Cash to close
- Down payment
- $18,750
- Closing costs
- $2,250
- Reserves months
- —
- Total cash needed
- —
Loan-product check · same deal, 3 products live
Conventional
25% down · 7.5% · 30yr
- Down + closing
- —
- Monthly P&I
- —
- Monthly cashflow
- —
- DSCR
- —
- Eligible?
- —
Personal DTI + credit; lowest rate.
DSCR
20% down · 8.5% · 30yr
- Down + closing
- —
- Monthly P&I
- —
- Monthly cashflow
- —
- DSCR
- —
- Eligible?
- —
No personal income docs; deal must DSCR.
Hard money
10% down · 12.0% · 12mo
- Down + closing
- —
- Monthly P&I
- —
- Monthly cashflow
- —
- DSCR
- —
- Eligible?
- —
Short-term bridge; refi at stabilization.
Rent comps 38 comps
| Address | Beds | Baths | Sqft | Rent | $/sqft | DOM | Units | Dist |
|---|---|---|---|---|---|---|---|---|
| 4029 Walnut Ave SW Birmingham, AL | 2.0 | 1.0 | 1300 | $1,369 | $1.05 | 3d | 1 | 0.15mi |
| 4120 George Ave SW Birmingham, AL | 2.0 | 1.0 | 944 | $850 | $0.90 | 23d | 1 | 0.16mi |
| 3720 Howard Ave SW Birmingham, AL | 3.0 | 1.0 | 1092 | $1,200 | $1.10 | 23d | 1 | 0.19mi |
| 3729 Pine Ave SW Birmingham, AL | 3.0 | 1.0 | 1067 | $1,100 | $1.03 | 21d | 1 | 0.23mi |
| 4009 Grasselli Ave SW Birmingham, AL | 3.0 | 1.0 | 875 | $900 | $1.03 | 23d | 1 | 0.25mi |
| 3736 Oak Ave SW Birmingham, AL | 3.0 | 2.0 | 984 | $1,050 | $1.07 | 23d | 1 | 0.32mi |
| 3729 Maple Ave SW Birmingham, AL | 3.0 | 2.0 | 1008 | $1,200 | $1.19 | 43d | 1 | 0.35mi |
| 3616 Maple Ave SW Birmingham, AL | 2.0 | 1.0 | 1488 | $950 | $0.64 | 43d | 1 | 0.40mi |
| 3640 Wenonah Rd SW Birmingham, AL | 3.0 | 2.0 | 1100 | $1,195 | $1.09 | 23d | 1 | 0.59mi |
| 3640 Wenonah Rd SW Birmingham, AL | 3.0 | 2.0 | 1100 | $1,195 | $1.09 | 11d | 1 | 0.59mi |
| 2804 32nd Way SW Birmingham, AL | 3.0 | 1.0 | 840 | $900 | $1.07 | 43d | 1 | 0.70mi |
| 2805 32nd Way SW Birmingham, AL | 3.0 | 1.0 | 792 | $900 | $1.14 | 43d | 1 | 0.71mi |
| 3400 Walnut Ave SW Birmingham, AL | 3.0 | 1.0 | 1133 | $1,200 | $1.06 | 43d | 1 | 0.71mi |
| 3332 Walnut Ave SW Birmingham, AL | 3.0 | 1.0 | 1339 | $750 | $0.56 | 19d | 1 | 0.79mi |
| 3417 Park Ave SW Birmingham, AL | 4.0 | 1.0 | 1402 | $900 | $0.64 | 43d | 1 | 0.85mi |
| 830 Burwell St Birmingham, AL | 3.0 | 1.5 | 1011 | $1,200 | $1.19 | 43d | 1 | 0.88mi |
| 1441 Creel St Birmingham, AL | 3.0 | 2.0 | 1319 | $1,275 | $0.97 | 3d | 1 | 0.99mi |
| 2300 31st St SW Unit ENSLEY2316 A Birmingham, AL | 2.0 | 1.0 | 750 | $1,000 | $1.33 | 2d | 1 | 1.08mi |
| 1721 Collier Dr Birmingham, AL | 2.0 | 1.0 | 925 | $800 | $0.86 | 43d | 1 | 1.10mi |
| 1433 Rayfield Dr Birmingham, AL | 3.0 | 1.0 | 1064 | $950 | $0.89 | 43d | 1 | 1.11mi |
| 408 Midway St Birmingham, AL | 3.0 | 1.0 | 1301 | $1,075 | $0.83 | 19d | 1 | 1.14mi |
| 1112 S Gale Dr Birmingham, AL | 3.0 | 1.5 | 1053 | $1,175 | $1.12 | 43d | 1 | 1.14mi |
| 537 Grant St Birmingham, AL | 3.0 | 1.0 | 1444 | $1,200 | $0.83 | 23d | 1 | 1.14mi |
| 1376 Creel Ct Birmingham, AL | 3.0 | 1.0 | 1008 | $1,000 | $0.99 | 43d | 1 | 1.17mi |
| 1412 Woodward Rd Birmingham, AL | 3.0 | 1.0 | 1220 | $1,203 | $0.99 | 15d | 1 | 1.20mi |
| 517 Grant St Birmingham, AL | 3.0 | 1.0 | 912 | $850 | $0.93 | 23d | 1 | 1.20mi |
| 913 Daniel Cir Birmingham, AL | 4.0 | 2.0 | 1317 | $1,300 | $0.99 | 43d | 1 | 1.23mi |
| 1417 Brighton Rd Birmingham, AL | 3.0 | 2.0 | 1048 | $1,200 | $1.15 | 43d | 1 | 1.30mi |
| 120 Parkwood St Birmingham, AL | 3.0 | 1.5 | 1224 | $1,150 | $0.94 | 15d | 1 | 1.31mi |
| 336 McPherson Ave Birmingham, AL | 3.0 | 1.0 | 1094 | $1,100 | $1.01 | 23d | 1 | 1.35mi |
| 340 McPherson Ave Birmingham, AL | 2.0 | 1.0 | 924 | $910 | $0.98 | 43d | 1 | 1.35mi |
| 1838 31st St SW Birmingham, AL | 3.0 | 2.0 | 1400 | $1,223 | $0.87 | 15d | 1 | 1.38mi |
| 2800 Milan Ct Birmingham, AL | 1.0–2.0 | 1.0–2.0 | 976 | $2,551 | $2.61 | 21d | 10 | 1.38mi |
| 5624 Cairo Ave Birmingham, AL | 4.0 | 2.0 | 1386 | $1,200 | $0.87 | 43d | 1 | 1.40mi |
| 3000 Dawson Ave SW Birmingham, AL | 3.0 | 1.0 | 1092 | $925 | $0.85 | 43d | 1 | 1.41mi |
| 373 Belcher Dr Birmingham, AL | 4.0 | 1.0 | 1255 | $1,100 | $0.88 | 43d | 1 | 1.41mi |
| 2113 Rambow Ave SW Birmingham, AL | 2.0 | 1.0 | 838 | $1,250 | $1.49 | 43d | 1 | 1.45mi |
| 2850 Venice Rd Birmingham, AL | 1.0–3.0 | 1.0–2.0 | 1190 | $1,957 | $1.64 | 1d | 18 | 1.49mi |
Listing history 31 events
-
2026-06-18days on market $75,000 Active 140 DOM
-
2026-06-17days on market $75,000 Active 139 DOM
-
2026-06-16days on market $75,000 Active 138 DOM
-
2026-06-15days on market $75,000 Active 137 DOM
-
2026-06-13days on market $75,000 Active 135 DOM
-
2026-06-10days on market $75,000 Active 132 DOM
-
2026-06-09days on market $75,000 Active 131 DOM
-
2026-06-08days on market $75,000 Active 130 DOM
-
2026-06-07days on market $75,000 Active 129 DOM
-
2026-06-03pricedays on market $75,000 Active 125 DOM
-
2026-06-02days on market $85,000 Active 124 DOM
-
2026-06-01days on market $85,000 Active 123 DOM
-
2026-05-31days on market $85,000 Active 122 DOM
-
2026-03-29price $85,000 839-char remark
Show marketing remark (839 chars)
This updated 3-bedroom, 1-bath home in Birmingham was remodeled just three years ago and is truly move-in ready. Featuring modern finishes, an open and spacious layout, and abundant natural light, this home offers comfortable and stylish living. The updated kitchen includes contemporary cabinetry, updated granite countertops, and newer appliances, making it ideal for everyday living and entertaining. Beautiful flooring flows throughout the home, enhancing the fresh and inviting atmosphere. With a newer roof, updated systems, and low-maintenance living, this property is perfect for first-time buyers, downsizers, or investors looking for a turnkey rental opportunity. Conveniently located near shopping, dining, schools, and major highways, this Birmingham home combines value, location, and modern updates in one attractive package.
-
2026-01-29$90,000 Active 839-char remark
Show marketing remark (839 chars)
This updated 3-bedroom, 1-bath home in Birmingham was remodeled just three years ago and is truly move-in ready. Featuring modern finishes, an open and spacious layout, and abundant natural light, this home offers comfortable and stylish living. The updated kitchen includes contemporary cabinetry, updated granite countertops, and newer appliances, making it ideal for everyday living and entertaining. Beautiful flooring flows throughout the home, enhancing the fresh and inviting atmosphere. With a newer roof, updated systems, and low-maintenance living, this property is perfect for first-time buyers, downsizers, or investors looking for a turnkey rental opportunity. Conveniently located near shopping, dining, schools, and major highways, this Birmingham home combines value, location, and modern updates in one attractive package.
-
2025-05-23price $93,800
-
2025-04-06price $94,000
-
2024-08-21price $110,000
-
2023-12-05price $114,900
-
2023-10-20historical $950
-
2023-10-05$950
-
2022-07-01price $950
-
2022-02-25soldstatus $42,000
-
2019-03-05soldstatus $200,000
-
2019-03-05soldstatus $225,000
-
2014-03-25soldstatus $42,000
-
2014-03-19soldstatus $42,000
-
2014-01-13$45,000
-
2013-10-07soldstatus $8,500
-
2013-07-25$9,270
-
2007-06-13soldstatus $45,000
ⓘ Source: listings_history table (triggers on properties + properties_extension) + one-shot
backfill from property_details.listing_events for pre-trigger history.
Tax reassessment forecast AL · Resets to sale price
- Current annual tax
- $1,482 · $123/mo
- Projected year-2 tax
- $1,482 · $123/mo
- Expected delta
- $0/yr ($0/mo · 0.0%)
ⓘ Screening estimate from a state-policy table — verify with the county assessor before closing.
Climate risk First Street
- Flood 1/10 Low FEMA zone X (unshaded) · 0% chance over 30 yrs
- Wildfire 3/10 Moderate
- Heat 6/10 Major 7 d/yr ≥108°F today · 19 d/yr by 30 yrs out
- Wind 6/10 Major 27% chance of damaging wind over 30 yrs
- Air quality 3/10 Moderate 2 unhealthy d/yr today · 5 by 30 yrs out
Nearby sold comps map
Loading sold comps map…
Walkable amenities ~0.75 mi
Loading nearby amenities…
Taxation est. · year 1
- Rental income
- $13,195
- − Mortgage interest
- −$4,201
- − Property taxes
- −$1,482
- − Insurance
- −$375
- − Repairs & maintenance
- −$1,056
- − Management
- −$1,056
- − Depreciation
- −$2,182
- Taxable income
- $2,844
- Est. tax owed @ 24.0%
- −$682
- After-tax cash flow
- $3,165/yr
For passive investors: Depreciation is non-cash, so a rental often shows a tax loss while cash-flowing — sheltering income. Rental losses are passive: they offset passive income freely, and up to $25,000/yr can offset ordinary (W-2) income if you actively participate and your MAGI is under $100k (phasing out to $0 by $150k); unused losses carry forward. On sale, claimed depreciation is recaptured at up to 25%, and gains may owe capital-gains tax (a 1031 exchange can defer both). Figures are a year-1 estimate at your 24.0% rate — not tax advice; consult a CPA.
Schools (NCES district)
- District
- Birmingham City
- NCES district ID
- 0100390
- Math proficiency
- 4% ▼ -17.00%
- Reading proficiency
- 20% ▼ -4.00%
- Median HH income
- $31,988
- Composite
- 9.49/100
- National rank
- #9850
- State rank
- #116 of 129 in AL
Livability — Birmingham
- Score
- 67/100
- State rank
- #78
- US rank
- #10412
Category grades
Schools grade is shown separately in the Schools card above.
Census & demographics
- Census place
- Birmingham, AL
- City population
- 210,422
- Population (ZIP)
- 3,127
Population outlook (Jefferson County) Hauer SSP2
- Today (2025)
- 669,185 people
- By 2030
- 669,694 · +0.1%
- By 2040
- 661,388 · -1.2%
- By 2050
- 643,086 · -3.9%
- By 2075
- 577,267 · -13.7%
- By 2100
- 474,758 · -29.1%
Race, ethnicity, and origin ACS 2023
- Neighborhood character
- Predominantly Black (89%)
- Race & ethnicity
- Black 89% Two or more races 7% Hispanic / Latino 6% White 4%
- Hispanic origin (detail)
- Mexican 6%
- Foreign-born
- 3% · Canada
- Languages at home
- 93% English-only · Spanish 6%
Political lean MEDSL · Jefferson
- 2024 margin
- D (+10.4) · D 54.6% · R 44.2% · Other 1.2%
- 2008→2024 swing
- +5.4pp toward D · 2008: 5.1pp · 2024: 10.4pp
- All cycles
- 2024: D+10.4 2020: D+13.2 2016: D+7.2 2012: D+6.0 2008: D+5.1
Not yet ingested
- Civics
- —
Market trends
- HPI YoY
- ▼ -1.32%
- Current HPI
- 121.0566
- Rent YoY
- —
- Metro
- —
- State GDP YoY
- ▲ 2.94%
- F500 in state
- 4
Industry mix (Fortune 500 HQ in AL)
| Industry | F500 HQs | Revenue |
|---|---|---|
| Financial Services | 1 | $8B |
|
||
| Healthcare | 1 | $5B |
|
||
Price history
+88.9% since first listed18 events — show timeline
- 2026-03-29 Price Changed $85,000 Greater Alabama MLS
- 2026-01-29 Listed $90,000 Greater Alabama MLS
- 2025-05-23 Price Changed $93,800 Greater Alabama MLS
- 2025-04-06 Price Changed $94,000 Greater Alabama MLS
- 2024-08-21 Price Changed $110,000 Greater Alabama MLS
- 2023-12-05 Price Changed $114,900 Greater Alabama MLS
- 2023-10-20 Rental Removed $950 APPFOLIO
- 2023-10-05 Listed for Rent $950 APPFOLIO
- 2022-07-01 Price Changed $950 APPFOLIO
- 2022-02-25 Sold (Public Records) $42,000 Public Records
- 2019-03-05 Sold (Public Records) $225,000 Public Records
- 2019-03-05 Sold (Public Records) $200,000 Public Records
- 2014-03-25 Sold (Public Records) $42,000 Public Records
- 2014-03-19 Sold (MLS) $42,000 Greater Alabama MLS
- 2014-01-13 Listed $45,000 Greater Alabama MLS
- 2013-10-07 Sold (MLS) $8,500 Greater Alabama MLS
- 2013-07-25 Listed $9,270 Greater Alabama MLS
- 2007-06-13 Sold (Public Records) $45,000 Public Records
Property tax history
+17.0%/yrLatest (2025): $1,482 · +6.9% YoY. Source: county tax records.
Cash-flow waterfall
monthlySold comps — $/sqft
last 12 mo · ≤1 miLoading sold comps…