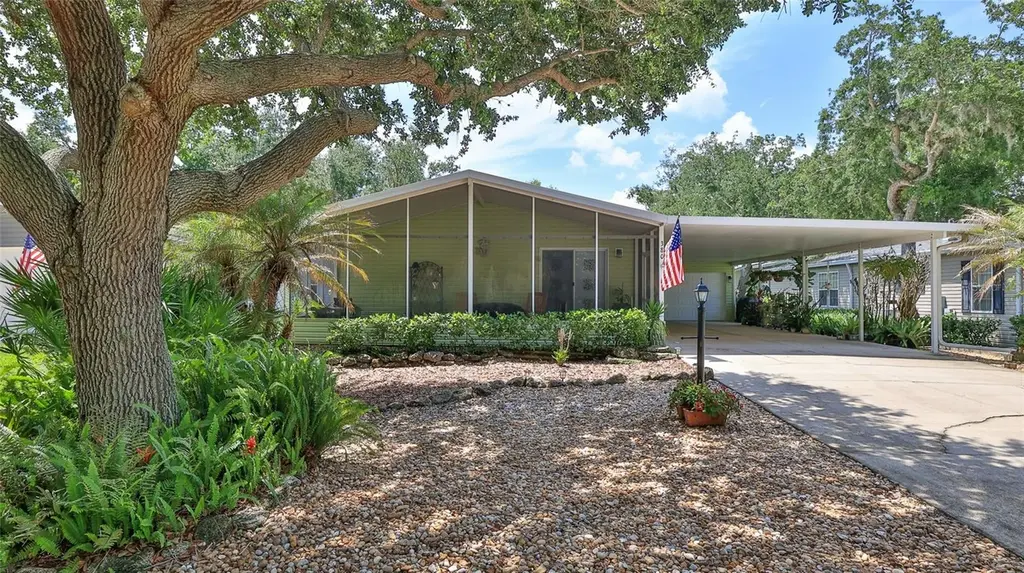
380 Marsh Landing Loop · Oak Hill, FL
Flood risk 9/10 · Severe
- FEMA flood zone
- X (shaded)
- Chance of flooding over 30 yrs
- 0.99%
- Est. flood insurance / yr
- $507 – $1,088
Fire risk 5/10 · Moderate
- Est. fire insurance / yr
- $947 – $1,759
Heat risk 10/10 · Severe
- Hot days now (above 106°F)
- 7 days/yr
- Hot days in 30 yrs
- 20 days/yr
Wind risk 10/10 · Severe
- Chance of severe wind over 30 yrs
- 99.0%
Air-quality risk 1/10 · Minimal
- Unhealthy air days now
- 0 days/yr
- Unhealthy air days in 30 yrs
- 0 days/yr
Risk factors via First Street. Map © Google.
Why this score? — see what drove the D grade
The composite is a weighted blend of 9 inputs, each scored 0–100. Each bar is that input's sub-score; the figure is the points it added to the 100-point composite (weight × sub-score).
- Cash flow +13.3/30.0
- ARV discount +7.5/15.0
- 1% rule +4.1/10.0
- DSCR +4.0/10.0
- Schools +3.9/10.0
- Livability +3.6/5.0
- Rent growth +2.5/5.0
- Condition / age +2.5/5.0
- Appreciation +0.0/10.0
$274,900
🖨 Deal sheet 📄 Offer letter ✓ Due diligence
Listing remarks MLS
Gorgeous 2 bedroom, 2 bath home is nestled on a beautiful lot and is situated directly across from one of the greenbelt areas. Features include vaulted ceilings, laminate and tile flooring throughout, extra closet shelving, spacious screened patio, updated window treatments, newer hot water heater and Florida friendly landscaping. The kitchen has been updated with hickory cabinets, quartz countertops and newer appliances. Parking is not a problem with the double carport and garage. Lighthouse Cove is a beautiful riverside gated community located on the Indian River Intracoastal Waterway where you own your property! Lighthouse Cove features a clubhouse, heated swimming pool, tennis/pickleball courts, shuffleboard, river access, boat launch for shallow water boats, recreational picnic area on the river and a fishing pier. Lighthouse Cove has weekly events and golf carts are a second means of transportation. It is a boating/fishing paradise being located a short distance from the Mosquito Lagoon. Get lost in the local backwaters of Canaveral Seashore and Merritt Island Wildlife Refuge in your kayak and boat. Do not miss out. Come see what it is like to live in Paradise! ; Water: City
Key facts
- Screened patio
- Quartz countertops
- Landscaped lot
Tags
Property features AI
Finance
- Other: Access to the Indian River Intracoastal Waterway; Boat ramp (private) and fishing pier available to residents
- Financial info: Total monthly fees $121.55; Total annual fees $1,458.60; Lease restrictions apply
- HOA & community: HOA required (monthly fee $121.55); Association name: Sentry Management/Jynell Martz; Association approval required; HOA includes pool and recreational facilities; Community amenities: clubhouse, pool, tennis courts, pickleball courts, shuffleboard court, deed restrictions; Senior community; Pets allowed (cats and dogs — number limit applies); Development: Lighthouse Cove; Community provides a fishing pier and small boat launch
Exterior
- Parking: Attached garage with garage door opener; 1-car garage (18x24); 2-space carport
- Security: Smoke detectors
- Utilities: Public water; Public sewer; Electricity connected; Cable available; Phone available; Sewer connected; Water connected; Sprinkler meter; Irrigation equipment
- Home design: Manufactured double-wide home; One story; Faces north; Completed condition; Jacobsen make
- Construction: Vinyl siding; Metal and shingle roof; Crawlspace foundation with pillar/post/pier
- Exterior features: Rain gutters; Landscaped lot; Private maintained asphalt road
Interior
- Kitchen: Dishwasher; Disposal; Microwave; Range; Refrigerator; Electric water heater
- Bedrooms: 2 bedrooms
- Flooring: Ceramic tile; Laminate
- Bathrooms: 2 full bathrooms
- Heating & cooling: Electric heating; Heat pump; Central air conditioning
- Interior features: Ceiling fans; Open floor plan; Vaulted ceilings; Window treatments
- Laundry & utility: Laundry inside
Neighborhood map
What this means for you Summary
Snapshot
- This is a 2-bed/2.0-bath manufactured listed at $275k.
Deal economics
- At list price, monthly cash flow is $-68 ($-817/yr) — negative.
- To cash-flow at today's rent, offer at most $263k (4.4% below list).
- To meet the 1% rule (rent ≥ 1% of price), the offer needs to be $249k (9.3% below list).
- Recommended offer: $249k (9.3% below list) — sets the bar for 1% rule.
Location & tenants
- Location reads 71/100 on livability (#379 in FL) — a middle-class / working-renter tenant base. Strengths: crime A+, cost of living A+, housing A+; Watch: amenities F, commute F.
- Volusia (suburban): math 44% / reading 49% proficiency, ranked #47 of 73 in FL (top 64%) — families likely to look elsewhere, expect single-tenant / working-renter base with shorter leases.
- Market conditions: 87 active listings in the ZIP; 2 comparable units currently listed for rent nearby; 3,402 units permitted in Volusia County in 2024 (681 in 5+ unit buildings).
Forward outlook
- Local home prices are declining (-3.0%/yr); year-one equity from $2k of loan paydown is wiped out by about $8k of value loss. Plan a longer hold.
- Volusia County population projected at +19% by 2050 — long-run rental-demand tailwind backs the buy-and-hold thesis.
Negotiation context
- Only 10 days on market — expect competitive offers; lowballing is unlikely to land.
- 12 sale attempts since 8y ago with the ask held roughly flat each time — persistent listings suggest the price (not the market) is what's stuck; bring a comps-based counter.
- Current owner paid $205k; 34% above their basis — modest negotiation headroom, anchor on the comps not their cost.
Risks & watch-outs
- Watch-outs: flood insurance adds $66/mo.
- Climate carrying-cost: severe flood risk; severe wind risk, 99% chance of damaging wind over 30y; moderate wildfire risk; extreme-heat days projected 7→20/yr by 2055 (HVAC capex compounding) — expect insurance premiums to compound above CPI over the hold.
Questions for the listing agent
- What do current leases actually rent for vs. the listed asking? Can we see a recent rent roll and the last 12 months of T-12 income?
- What's the actual annual flood-insurance premium (NFIP or private), and is the property in a SFHA with mandatory coverage?
- What does the HOA fee cover, when was the last increase, and are there any pending special assessments or reserve-fund shortfalls?
- Is there a deadline driving the sale (1031 exchange, divorce, estate, relocation)? That informs how much negotiation room exists.
- Schools are B-rated — typically a magnet for longer-tenancy family renters. What's the average tenant stay here, and is there a school-zone premium baked into asking?
- The area grade is low — what's the realistic commute time and amenity access for the typical tenant pool here? Any planned neighborhood developments (good or bad) we should know about?
- What's the average days-on-market for RENTAL listings here right now (not sales)? A rising rental-DOM trend means longer vacancies and softer asking-rent achievability than the comps imply.
- What's the recent tenant-quality profile in this submarket — average credit score on applications, eviction rate, late-payment / NSF rate, and stable-employment percentage? A property-management company in the area should have these aggregated.
- How much new for-sale + rental construction is in the pipeline within 1–3 miles? Heavy new supply typically softens prices + rents 12–24 months out; constrained supply supports both.
Investment metrics
- 1% rule
- 0.91% ✗
- Cap rate
- 6.29%
- Cash-on-cash
- -0.03%
- DSCR
- 1.00
- GRM
- 9.2
CMA / ARV
No comps found within radius.
Projected returns pro-forma
-3.0% appreciation · 3.0% rent growth · sell at horizon
- IRR
- -18.0%
- Equity multiple
- 0.37×
- Total profit
- $-48,759
- Equity at exit
- $40,988
- IRR
- -10.1%
- Equity multiple
- 0.38×
- Total profit
- $-47,546
- Equity at exit
- $23,768
Cash invested: $76,972 (down + closing). Projections, not guarantees.
Landlord ↔ Tenant lean methodology
- Overall (STATE)
- 87 Strongly Landlord-Friendly
- State Florida
- 87 Strongly Landlord-Friendly · R+3
- County
- — inherits STATE
- City
- — inherits STATE
ZIP-level market 32759
- Home prices YoY
- -2.5%
- Active inventory
- 87
- Price-to-rent
- 9.2×
Monthly cashflow live
- Estimated rent
- $2,493 medium interval (Pro) →
- Mortgage (P&I)
- −$1,442
- Tax from tax record
- −$294 /mo · $3,524/yr
- Insurance
- −$115
- Flood insurance flood zone
- −$66 /mo · $798/yr
- HOA
- −$121
- Vacancy / Maint / Mgmt
- −$523
- Net cashflow
- $-68
Break-even live
UW: 25.0% down · 7.5% · 30yr · 1.5% tax · 5.0% vac · 8.0% maint · 8.0% mgmt
Financing live
Cash to close
- Down payment
- $68,725
- Closing costs
- $8,247
- Reserves months
- —
- Total cash needed
- —
Loan-product check · same deal, 3 products live
Conventional
25% down · 7.5% · 30yr
- Down + closing
- —
- Monthly P&I
- —
- Monthly cashflow
- —
- DSCR
- —
- Eligible?
- —
Personal DTI + credit; lowest rate.
DSCR
20% down · 8.5% · 30yr
- Down + closing
- —
- Monthly P&I
- —
- Monthly cashflow
- —
- DSCR
- —
- Eligible?
- —
No personal income docs; deal must DSCR.
Hard money
10% down · 12.0% · 12mo
- Down + closing
- —
- Monthly P&I
- —
- Monthly cashflow
- —
- DSCR
- —
- Eligible?
- —
Short-term bridge; refi at stabilization.
Rent comps 2 comps
| Address | Beds | Baths | Sqft | Rent | $/sqft | DOM | Units | Dist |
|---|---|---|---|---|---|---|---|---|
| 414 Sioux Blvd Oak Hill, FL | 3.0 | 2.0 | 1842 | $2,800 | $1.52 | 23d | 1 | 0.13mi |
| 429 Ward Dr Unit B Oak Hill, FL | 2.0 | 2.0 | 1235 | $1,350 | $1.09 | 23d | 1 | 0.67mi |
HOA detail
- Monthly dues
- $121 · $1,452/yr
- Likely covers
- waterlandscapingpoolsecurity
Listing history 8 events
-
2026-06-18days on market $274,900 Active 10 DOM
-
2026-06-17days on market $274,900 Active 9 DOM
-
2026-06-16days on market $274,900 Active 8 DOM
-
2026-06-15days on market $274,900 Active 7 DOM
-
2026-06-14days on market $274,900 Active 5 DOM
-
2026-06-10days on market $274,900 Active 2 DOM
-
2026-06-09remarks 693-char remark
-
2026-06-09$274,900 Active 1 DOM
ⓘ Source: listings_history table (triggers on properties + properties_extension) + one-shot
backfill from property_details.listing_events for pre-trigger history.
Tax reassessment forecast FL · Resets to sale price
- Current annual tax
- $3,524 · $294/mo
- Projected year-2 tax
- $3,524 · $294/mo
- Expected delta
- $0/yr ($0/mo · 0.0%)
ⓘ Screening estimate from a state-policy table — verify with the county assessor before closing.
Climate risk First Street
- Flood 9/10 Extreme FEMA zone X (shaded) · 99% chance over 30 yrs
- Wildfire 5/10 Major
- Heat 10/10 Extreme 7 d/yr ≥106°F today · 20 d/yr by 30 yrs out
- Wind 10/10 Extreme 99% chance of damaging wind over 30 yrs
- Air quality 1/10 Low 0 unhealthy d/yr today · 0 by 30 yrs out
Nearby sold comps map
Loading sold comps map…
Walkable amenities ~0.75 mi
Loading nearby amenities…
Taxation est. · year 1
- Rental income
- $29,912
- − Mortgage interest
- −$15,399
- − Property taxes
- −$3,524
- − Insurance
- −$2,172
- − Repairs & maintenance
- −$2,393
- − Management
- −$2,393
- − HOA
- −$1,452
- − Depreciation
- −$7,997
- Taxable loss
- −$5,418
- Est. tax savings @ 24.0%
- +$1,300
- After-tax cash flow
- $483/yr
For passive investors: Depreciation is non-cash, so a rental often shows a tax loss while cash-flowing — sheltering income. Rental losses are passive: they offset passive income freely, and up to $25,000/yr can offset ordinary (W-2) income if you actively participate and your MAGI is under $100k (phasing out to $0 by $150k); unused losses carry forward. On sale, claimed depreciation is recaptured at up to 25%, and gains may owe capital-gains tax (a 1031 exchange can defer both). Figures are a year-1 estimate at your 24.0% rate — not tax advice; consult a CPA.
Schools (NCES district)
- District
- Volusia
- NCES district ID
- 1201920
- Math proficiency
- 44% ▼ -9.00%
- Reading proficiency
- 49% ▼ -3.00%
- Median HH income
- $42,946
- Composite
- 39.2/100
- National rank
- #4019
- State rank
- #47 of 73 in FL
Livability — Oak Hill
- Score
- 71/100
- State rank
- #379
- US rank
- #6740
Category grades
Schools grade is shown separately in the Schools card above.
Census & demographics
- Census place
- Oak Hill, FL
- Population (ZIP)
- 2,941
Population outlook (Volusia County) Hauer SSP2
- Today (2025)
- 572,749 people
- By 2030
- 598,695 · +4.5%
- By 2040
- 644,880 · +12.6%
- By 2050
- 681,451 · +19.0%
- By 2075
- 759,957 · +32.7%
- By 2100
- 778,902 · +36.0%
Race, ethnicity, and origin ACS 2023
- Neighborhood character
- Predominantly White (81%)
- Race & ethnicity
- White 81% Black 12% Hispanic / Latino 4% Two or more races 2% Native American 1%
- Common ancestry
- Slovak 3% Serbian 3% Iranian 2%
- Foreign-born
- 2% · Canada
- Languages at home
- 96% English-only · Spanish 4%
Political lean MEDSL · Volusia
- 2024 margin
- Strong R (+21.8) · D 38.7% · R 60.5%
- 2008→2024 swing
- -27.4pp toward R · 2008: 5.7pp · 2024: -21.8pp
- All cycles
- 2024: R+21.8 2020: R+14.1 2016: R+13.1 2012: R+1.2 2008: D+5.7
Not yet ingested
- Civics
- —
Market trends
- HPI YoY
- ▼ -10.18%
- Current HPI
- 397.7064
- Rent YoY
- —
- Metro
- —
- State GDP YoY
- ▲ 3.28%
- F500 in state
- 36
Industry mix (Fortune 500 HQ in FL)
| Industry | F500 HQs | Revenue |
|---|---|---|
| Industrial Technology | 2 | $29B |
|
||
| Insurance | 2 | $17B |
|
||
| Retail | 1 | $60B |
|
||
| Technology Distribution | 1 | $58B |
|
||
| Homebuilding | 1 | $35B |
|
||
| Technology Manufacturing | 1 | $35B |
|
||
Price history
+62.8% since first listed30 events — show timeline
- 2026-06-08 Listed $274,900 Stellar MLS as Distributed by MLS Grid
- 2021-05-20 Sold (Public Records) $205,000 Public Records
- 2021-04-26 Sold (MLS) $205,000 NSBMLS
- 2021-04-26 Sold (MLS) $205,000 Stellar MLS as Distributed by MLS Grid
- 2021-03-19 Contingent — NSBMLS
- 2021-01-27 Listed $219,900 NSBMLS
- 2021-01-27 Listed $219,900 Stellar MLS as Distributed by MLS Grid
- 2021-01-04 Listing Removed — Stellar MLS as Distributed by MLS Grid
- 2020-12-28 Listed — NSBMLS
- 2020-12-28 Listed $219,900 Stellar MLS as Distributed by MLS Grid
- 2019-12-27 Sold (Public Records) $178,000 Public Records
- 2019-12-20 Sold (MLS) $178,000 NSBMLS
- 2019-12-20 Sold (MLS) $178,000 Stellar MLS as Distributed by MLS Grid
- 2019-12-11 Contingent — NSBMLS
- 2019-07-24 Listed $185,000 NSBMLS
- 2019-07-24 Listed $185,000 Stellar MLS as Distributed by MLS Grid
- 2019-06-04 Sold (Public Records) $182,000 Public Records
- 2019-06-03 Sold (MLS) $182,000 Stellar MLS as Distributed by MLS Grid
- 2019-06-03 Sold (MLS) $182,000 NSBMLS
- 2019-04-20 Contingent — NSBMLS
- 2019-04-05 Listed $184,900 Stellar MLS as Distributed by MLS Grid
- 2019-04-05 Listed $184,900 NSBMLS
- 2018-09-28 Sold (Public Records) $162,000 Public Records
- 2018-09-21 Sold (MLS) $162,000 Stellar MLS as Distributed by MLS Grid
- 2018-09-21 Sold (MLS) $162,000 NSBMLS
- 2018-08-25 Contingent — NSBMLS
- 2018-07-16 Relisted — NSBMLS
- 2018-07-14 Contingent — NSBMLS
- 2018-07-11 Listed $168,900 Stellar MLS as Distributed by MLS Grid
- 2018-07-11 Listed $168,900 NSBMLS
Property tax history
+8.1%/yrLatest (2025): $3,524 · -1.5% YoY. Source: county tax records.
Cash-flow waterfall
monthlySold comps — $/sqft
last 12 mo · ≤1 miLoading sold comps…