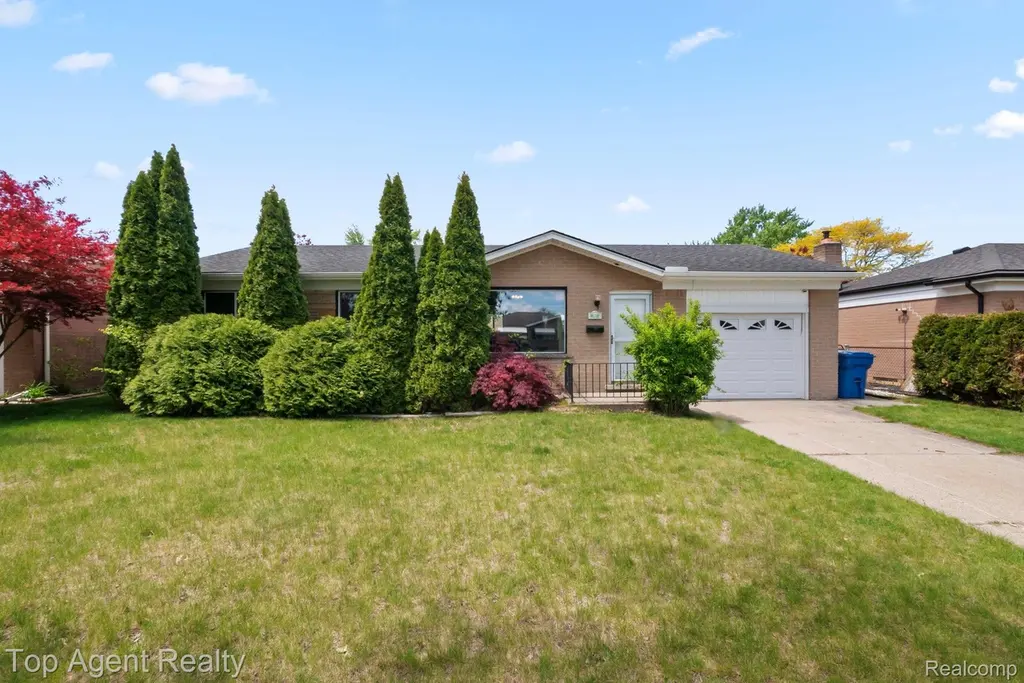
29639 Malvina Dr · Warren, MI
Flood risk 1/10 · Minimal
- FEMA flood zone
- X (unshaded)
- Chance of flooding over 30 yrs
- 0.0%
- Est. flood insurance / yr
- $473 – $860
Fire risk 1/10 · Minimal
- Est. fire insurance / yr
- $784 – $1,456
Heat risk 3/10 · Minor
- Hot days now (above 96°F)
- 7 days/yr
- Hot days in 30 yrs
- 15 days/yr
Wind risk 1/10 · Minimal
- Chance of severe wind over 30 yrs
- —
Air-quality risk 3/10 · Minor
- Unhealthy air days now
- 3 days/yr
- Unhealthy air days in 30 yrs
- 4 days/yr
Risk factors via First Street. Map © Google.
Why this score? — see what drove the D- grade
The composite is a weighted blend of 9 inputs, each scored 0–100. Each bar is that input's sub-score; the figure is the points it added to the 100-point composite (weight × sub-score).
- ARV discount +13.8/15.0
- Cash flow +9.2/30.0
- Livability +3.7/5.0
- Schools +2.7/10.0
- 1% rule +2.6/10.0
- DSCR +2.6/10.0
- Rent growth +2.5/5.0
- Condition / age +2.5/5.0
- Appreciation +0.0/10.0
$200,000
🖨 Deal sheet 📄 Offer letter ✓ Due diligence
Listing remarks MLS
Welcome home to this charming brick ranch featuring an updated kitchen, comfortable floor plan, and finished basement perfect for extra living or entertaining space. Enjoy the convenience of an attached garage, fenced backyard, and a location close to shopping, dining, parks, and major freeways. Full of potential and ready for its next owner to make it their own!
Key facts
- Attached garage
- Finished basement
- Updated kitchen
Tags
Property features AI
Exterior
- Parking: Attached garage (1 car)
- Utilities: Public water; Public sewer
- Home design: Single-family residence; One story; Ground-level entry with steps; Brick exterior
- Construction: Brick construction
- Exterior features: Paved road access; Lot approximately 0.17 acres (61 x 118)
Interior
- Kitchen: Dishwasher; Free-standing electric range; Free-standing refrigerator; Microwave
- Bathrooms: 2 full bathrooms
- Heating & cooling: Central air conditioning; Forced air heating; Natural gas heating
- Interior features: Finished basement; 5 total rooms; Home warranty included
Neighborhood map
What this means for you Summary
Snapshot
- This is a 3-bed/1.0-bath single-family listed at $200k.
Deal economics
- At list price, monthly cash flow is $-148 ($-2k/yr) — negative.
- To cash-flow at today's rent, offer at most $174k (13.1% below list).
- To meet the 1% rule (rent ≥ 1% of price), the offer needs to be $153k (23.6% below list).
- Recommended offer: $153k (23.6% below list) — sets the bar for 1% rule.
Location & tenants
- Location reads 74/100 on livability (#171 in MI, #4,491 nationally) — a middle-class / working-renter tenant base. Strengths: commute A+, cost of living A+, housing A+; Watch: schools D, amenities D, employment D.
- Warren Woods Public Schools (urban): math 23% / reading 40% proficiency, ranked #336 of 540 in MI (top 62%) — families likely to look elsewhere, expect single-tenant / working-renter base with shorter leases.
- Market conditions: 109 active listings in the ZIP; 10 comparable units currently listed for rent nearby; rentals at typical pace (median 17d on market — plan ~3-4 weeks tenant-placement turnaround); 40% of comp listings sitting > 30 days — soft ceiling on asking rent; 1,321 units permitted in Macomb County in 2024 (86 in 5+ unit buildings).
Forward outlook
- Local home prices are declining (-3.0%/yr); year-one equity from $1k of loan paydown is wiped out by about $6k of value loss. Plan a longer hold.
- Macomb County population projected at +9% by 2050 — modest demand growth; plan on rents tracking national, not racing it.
Negotiation context
- Only 6 days on market — expect competitive offers; lowballing is unlikely to land.
- 15 sale attempts since 25y ago with the ask held roughly flat each time — persistent listings suggest the price (not the market) is what's stuck; bring a comps-based counter.
- Current owner paid $93k; list at $200k implies a 115% gain — meaningful room to come down on a strong offer.
Questions for the listing agent
- What do current leases actually rent for vs. the listed asking? Can we see a recent rent roll and the last 12 months of T-12 income?
- Built in 1960 — when were the roof, HVAC, electrical panel, plumbing, and water heater last replaced?
- Is there a deadline driving the sale (1031 exchange, divorce, estate, relocation)? That informs how much negotiation room exists.
- Schools are D-rated, which usually means shorter tenancies and higher turnover. Who's the typical renter profile here, and what's been the actual vacancy rate?
- Crime grade is D in this area — have there been break-ins, vandalism, or insurance claims at this property in the last 3 years? What carrier currently insures it and at what premium?
- The area grade is low — what's the realistic commute time and amenity access for the typical tenant pool here? Any planned neighborhood developments (good or bad) we should know about?
- What's the average days-on-market for RENTAL listings here right now (not sales)? A rising rental-DOM trend means longer vacancies and softer asking-rent achievability than the comps imply.
- What's the recent tenant-quality profile in this submarket — average credit score on applications, eviction rate, late-payment / NSF rate, and stable-employment percentage? A property-management company in the area should have these aggregated.
- How much new for-sale + rental construction is in the pipeline within 1–3 miles? Heavy new supply typically softens prices + rents 12–24 months out; constrained supply supports both.
Investment metrics
- 1% rule
- 0.76% ✗
- Cap rate
- 5.40%
- Cash-on-cash
- -3.18%
- DSCR
- 0.86
- GRM
- 10.9
CMA / ARV
- ARV (on-the-fly)
- $232,320
- Comps found
- 11
Show comp detail 11 sales within ~0.75 mi
| Address | Dist | Beds/Ba | Sqft | Sold | Price | $/sf | Match |
|---|---|---|---|---|---|---|---|
| 29649 Dover Ave | 0.35mi | 3/1.5 | 1,095 (+4%) | 4mo | $241,000 | $220 | 72 |
| 28640 Bradner Dr | 0.50mi | 3/1.5 | 1,095 (+4%) | 1mo | $190,000 | $174 | 68 |
| 14107 Bade Dr | 0.29mi | 3/1.5 | 1,095 (+4%) | 12mo | $260,000 | $237 | 68 |
| 13765 Iowa Dr Dr | 0.27mi | 3/1.5 | 1,129 (+7%) | 10mo | $232,000 | $205 | 66 |
| 14108 La Chene Ave | 0.59mi | 3/1.5 | 1,003 (-5%) | 6mo | $263,000 | $262 | 57 |
| 13003 Walter Ave Ave | 0.42mi | 3/1.0 | 956 (-10%) | 10mo | $227,100 | $238 | 56 |
| 30428 Iroquois Dr | 0.61mi | 3/1.0 | 956 (-10%) | 0mo | $240,000 | $251 | 55 |
| 29508 Roan Dr | 0.72mi | 3/1.5 | 1,089 (+3%) | 10mo | $205,000 | $188 | 51 |
| 30709 Iroquois St | 0.68mi | 3/1.5 | 1,040 (-2%) | 16mo | $235,000 | $226 | 50 |
| 12354 Geoffry Dr | 0.73mi | 3/1.5 | 1,100 (+4%) | 8mo | $237,000 | $215 | 50 |
| 30546 Sutherland Ave | 0.51mi | 3/1.0 | 1,188 (+12%) | 22mo | $220,000 | $185 | 38 |
Match score weights: distance 35% · size 25% · config 20% · recency 20%. Top-matched comps best support the ARV.
Projected returns pro-forma
-3.0% appreciation · 3.0% rent growth · sell at horizon
- IRR
- -21.6%
- Equity multiple
- 0.25×
- Total profit
- $-41,860
- Equity at exit
- $29,821
- IRR
- -15.3%
- Equity multiple
- 0.13×
- Total profit
- $-48,604
- Equity at exit
- $17,292
Cash invested: $56,000 (down + closing). Projections, not guarantees.
Landlord ↔ Tenant lean methodology
- Overall (STATE)
- 62 Landlord-Friendly
- State Michigan
- 62 Landlord-Friendly · EVEN
- County
- — inherits STATE
- City
- — inherits STATE
ZIP-level market 48088
- Active inventory
- 109
- Price-to-rent
- 10.9×
Monthly cashflow live
- Estimated rent
- $1,527 high interval (Pro) →
- Mortgage (P&I)
- −$1,049
- Tax from tax record
- −$223 /mo · $2,673/yr
- Insurance
- −$83
- HOA
- −$0
- Vacancy / Maint / Mgmt
- −$321
- Net cashflow
- $-148
Break-even live
UW: 25.0% down · 7.5% · 30yr · 1.5% tax · 5.0% vac · 8.0% maint · 8.0% mgmt
Financing live
Cash to close
- Down payment
- $50,000
- Closing costs
- $6,000
- Reserves months
- —
- Total cash needed
- —
Loan-product check · same deal, 3 products live
Conventional
25% down · 7.5% · 30yr
- Down + closing
- —
- Monthly P&I
- —
- Monthly cashflow
- —
- DSCR
- —
- Eligible?
- —
Personal DTI + credit; lowest rate.
DSCR
20% down · 8.5% · 30yr
- Down + closing
- —
- Monthly P&I
- —
- Monthly cashflow
- —
- DSCR
- —
- Eligible?
- —
No personal income docs; deal must DSCR.
Hard money
10% down · 12.0% · 12mo
- Down + closing
- —
- Monthly P&I
- —
- Monthly cashflow
- —
- DSCR
- —
- Eligible?
- —
Short-term bridge; refi at stabilization.
Rent comps 10 comps
| Address | Beds | Baths | Sqft | Rent | $/sqft | DOM | Units | Dist |
|---|---|---|---|---|---|---|---|---|
| 30428 Iroquois Dr Warren, MI | 3.0 | 1.0 | 1000 | $1,800 | $1.80 | 1d | 1 | 0.63mi |
| 15175 Raphael Ter Warren, MI | 3.0 | 1.5 | 1250 | $1,600 | $1.28 | 12d | 1 | 0.79mi |
| 31250 Schoenherr Rd Warren, MI | 1.0–2.0 | 1.0–2.0 | 934 | $1,250 | $1.34 | 43d | 2 | 0.80mi |
| 28801 Imperial Dr Warren, MI | 1.0–2.0 | 1.0 | 887 | $1,205 | $1.36 | 16d | 6 | 0.89mi |
| 13250 De Mott Dr Warren, MI | 3.0 | 1.5 | 1386 | $1,900 | $1.37 | 43d | 1 | 1.02mi |
| 28250 Hoover Rd Warren, MI | 1.0–2.0 | 1.0–2.0 | 912 | $1,705 | $1.87 | 2d | 17 | 1.17mi |
| 30541 Bluehill St Roseville, MI | 3.0 | 1.5 | 989 | $1,850 | $1.87 | 43d | 1 | 1.33mi |
| 13006 E 11 Mile Rd Unit 6 Warren, MI | 2.0 | 1.0 | 850 | $1,050 | $1.24 | 43d | 1 | 1.45mi |
| 13006 E 11 Mile Rd Unit 6 Warren, MI | 2.0 | 1.0 | 850 | $1,075 | $1.26 | 14d | 1 | 1.45mi |
| 13741 McKinley Ave Unit 1032320P Warren, MI | 2.0 | 1.0 | 839 | $5,023 | $5.99 | 1d | 1 | 1.48mi |
Listing history 32 events
-
2026-05-18$200,000 Active
Show marketing remark (365 chars)
Welcome home to this charming brick ranch featuring an updated kitchen, comfortable floor plan, and finished basement perfect for extra living or entertaining space. Enjoy the convenience of an attached garage, fenced backyard, and a location close to shopping, dining, parks, and major freeways. Full of potential and ready for its next owner to make it their own!
-
2026-05-18$200,000 Active 365-char remark
Show marketing remark (365 chars)
Welcome home to this charming brick ranch featuring an updated kitchen, comfortable floor plan, and finished basement perfect for extra living or entertaining space. Enjoy the convenience of an attached garage, fenced backyard, and a location close to shopping, dining, parks, and major freeways. Full of potential and ready for its next owner to make it their own!
-
2008-03-05soldstatus $93,000 101-char remark
Show marketing remark (101 chars)
PROOF OF FUNDS FOR ALL CASH OFFERS. BUYER & BUYER’S AGENT TO TURN ON UTILITIES IF NEEDED.
-
2008-03-05soldstatus $93,000
Show marketing remark (101 chars)
PROOF OF FUNDS FOR ALL CASH OFFERS. BUYER & BUYER’S AGENT TO TURN ON UTILITIES IF NEEDED.
-
2008-01-03historical
-
2007-12-06$99,900 101-char remark
Show marketing remark (101 chars)
PROOF OF FUNDS FOR ALL CASH OFFERS. BUYER & BUYER’S AGENT TO TURN ON UTILITIES IF NEEDED.
-
2007-12-06$99,900
Show marketing remark (101 chars)
PROOF OF FUNDS FOR ALL CASH OFFERS. BUYER & BUYER’S AGENT TO TURN ON UTILITIES IF NEEDED.
-
2007-12-06historical
Show marketing remark (101 chars)
PROOF OF FUNDS FOR ALL CASH OFFERS. BUYER & BUYER’S AGENT TO TURN ON UTILITIES IF NEEDED.
-
2007-12-06historical
Show marketing remark (101 chars)
PROOF OF FUNDS FOR ALL CASH OFFERS. BUYER & BUYER’S AGENT TO TURN ON UTILITIES IF NEEDED.
-
2007-09-17$104,900
-
2007-09-17$104,900
-
2007-08-01historical
-
2007-08-01historical
-
2007-07-31$104,900
-
2007-07-31$104,900
-
2007-07-31historical
-
2007-07-31historical
-
2007-06-21$119,900
-
2007-06-21$119,900
-
2007-06-21historical
-
2007-06-21historical
-
2007-05-30$130,900
-
2007-05-30$130,900
-
2007-05-30historical
-
2007-05-30historical
-
2007-05-10$134,900
-
2007-05-10$134,900
-
2001-10-01soldstatus $138,000
-
2001-05-15soldstatus $138,000
-
2001-04-11historical
-
2001-01-29$142,900
-
1990-06-13soldstatus $72,500
ⓘ Source: listings_history table (triggers on properties + properties_extension) + one-shot
backfill from property_details.listing_events for pre-trigger history.
Tax reassessment forecast MI · Partial reset (capped growth)
- Current annual tax
- $2,673 · $223/mo
- Projected year-2 tax
- $2,876 · $240/mo
- Expected delta
- +$204/yr (+$17/mo · 7.6%)
ⓘ Screening estimate from a state-policy table — verify with the county assessor before closing.
Climate risk First Street
- Flood 1/10 Low FEMA zone X (unshaded) · 0% chance over 30 yrs
- Wildfire 1/10 Low
- Heat 3/10 Moderate 7 d/yr ≥96°F today · 15 d/yr by 30 yrs out
- Wind 1/10 Low
- Air quality 3/10 Moderate 3 unhealthy d/yr today · 4 by 30 yrs out
Nearby sold comps map
Loading sold comps map…
Walkable amenities ~0.75 mi
Loading nearby amenities…
Taxation est. · year 1
- Rental income
- $18,325
- − Mortgage interest
- −$11,203
- − Property taxes
- −$2,673
- − Insurance
- −$1,000
- − Repairs & maintenance
- −$1,466
- − Management
- −$1,466
- − Depreciation
- −$5,818
- Taxable loss
- −$5,301
- Est. tax savings @ 24.0%
- +$1,272
- After-tax cash flow
- $-510/yr
For passive investors: Depreciation is non-cash, so a rental often shows a tax loss while cash-flowing — sheltering income. Rental losses are passive: they offset passive income freely, and up to $25,000/yr can offset ordinary (W-2) income if you actively participate and your MAGI is under $100k (phasing out to $0 by $150k); unused losses carry forward. On sale, claimed depreciation is recaptured at up to 25%, and gains may owe capital-gains tax (a 1031 exchange can defer both). Figures are a year-1 estimate at your 24.0% rate — not tax advice; consult a CPA.
Schools (NCES district)
- District
- Warren Woods Public Schools
- NCES district ID
- 2635220
- Math proficiency
- 23% ▼ -9.00%
- Reading proficiency
- 40% ▼ -5.00%
- Median HH income
- $49,013
- Composite
- 27.29/100
- National rank
- #7003
- State rank
- #336 of 540 in MI
Livability — Warren
- Score
- 74/100
- State rank
- #171
- US rank
- #4491
Category grades
Schools grade is shown separately in the Schools card above.
Census & demographics
- Census place
- Warren, MI
- City population
- 114,937
- Population (ZIP)
- 23,443
Population outlook (Macomb County) Hauer SSP2
- Today (2025)
- 925,296 people
- By 2030
- 948,226 · +2.5%
- By 2040
- 983,961 · +6.3%
- By 2050
- 1,010,200 · +9.2%
- By 2075
- 1,076,222 · +16.3%
- By 2100
- 1,077,065 · +16.4%
Race, ethnicity, and origin ACS 2023
- Neighborhood character
- Predominantly White (74%)
- Race & ethnicity
- White 74% Black 13% Asian 6% Hispanic / Latino 5% Two or more races 5%
- Common ancestry
- Romanian 14% Lithuanian 4% Slovak 2%
- Foreign-born
- 11% · Canada
- Languages at home
- 84% English-only · Arabic 4% Other Indo-European 3% Spanish 3%
Political lean MEDSL · Macomb
- 2024 margin
- R (+13.7) · D 42.2% · R 55.9% · Other 1.9%
- 2008→2024 swing
- -22.3pp toward R · 2008: 8.6pp · 2024: -13.7pp
- All cycles
- 2024: R+13.7 2020: R+8.1 2016: R+11.6 2012: D+4.0 2008: D+8.6
Not yet ingested
- Civics
- —
Market trends
- HPI YoY
- ▼ -213.65%
- Current HPI
- 206.4018
- Rent YoY
- —
- Metro
- —
- State GDP YoY
- ▲ 1.37%
- F500 in state
- 28
Industry mix (Fortune 500 HQ in MI)
| Industry | F500 HQs | Revenue |
|---|---|---|
| Automotive Parts | 3 | $48B |
|
||
| Automotive | 2 | $372B |
|
||
| Chemicals | 1 | $45B |
|
||
| Automotive Retail | 1 | $29B |
|
||
| Healthcare / Medical Devices | 1 | $23B |
|
||
| Automotive Technology | 1 | $20B |
|
||
Price history
+175.9% since first listed32 events — show timeline
- 2026-05-18 Listed $200,000 REALCOMP
- 2026-05-18 Listed $200,000 MiRealSource-MiMLS
- 2008-03-05 Sold (MLS) $93,000 MiRealSource-MiMLS
- 2008-03-05 Sold (MLS) $93,000 REALCOMP
- 2008-01-03 Listing Removed — MiRealSource-MiMLS
- 2007-12-06 Listing Removed — REALCOMP
- 2007-12-06 Listing Removed — MiRealSource-MiMLS
- 2007-12-06 Listed $99,900 MiRealSource-MiMLS
- 2007-12-06 Listed $99,900 REALCOMP
- 2007-09-17 Listed $104,900 REALCOMP
- 2007-09-17 Listed $104,900 MiRealSource-MiMLS
- 2007-08-01 Listing Removed — MiRealSource-MiMLS
- 2007-08-01 Listing Removed — REALCOMP
- 2007-07-31 Listing Removed — REALCOMP
- 2007-07-31 Listing Removed — MiRealSource-MiMLS
- 2007-07-31 Listed $104,900 MiRealSource-MiMLS
- 2007-07-31 Listed $104,900 REALCOMP
- 2007-06-21 Listing Removed — MiRealSource-MiMLS
- 2007-06-21 Listing Removed — REALCOMP
- 2007-06-21 Listed $119,900 REALCOMP
- 2007-06-21 Listed $119,900 MiRealSource-MiMLS
- 2007-05-30 Listing Removed — MiRealSource-MiMLS
- 2007-05-30 Listing Removed — REALCOMP
- 2007-05-30 Listed $130,900 MiRealSource-MiMLS
- 2007-05-30 Listed $130,900 REALCOMP
- 2007-05-10 Listed $134,900 MiRealSource-MiMLS
- 2007-05-10 Listed $134,900 REALCOMP
- 2001-10-01 Sold (Public Records) $138,000 Public Records
- 2001-05-15 Sold (MLS) $138,000 MiRealSource-MiMLS
- 2001-04-11 Listing Removed — MiRealSource-MiMLS
- 2001-01-29 Listed $142,900 MiRealSource-MiMLS
- 1990-06-13 Sold (Public Records) $72,500 Public Records
Property tax history
+2.7%/yrLatest (2025): $2,673 · +2.5% YoY. Source: county tax records.
Cash-flow waterfall
monthlySold comps — $/sqft
last 12 mo · ≤1 miLoading sold comps…