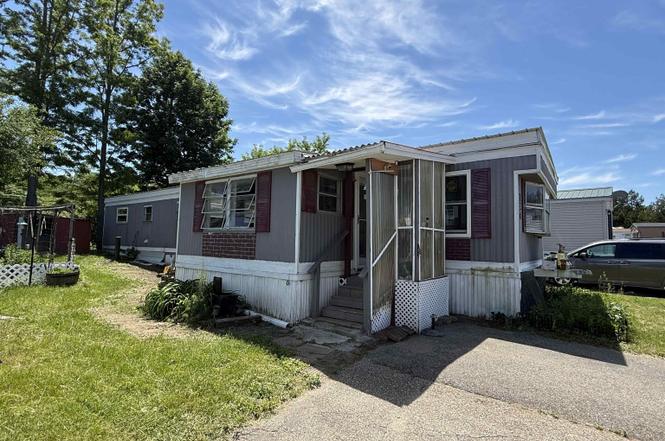
136 Seventh St · Winooski, VT
Flood risk No data
- FEMA flood zone
- —
- Chance of flooding over 30 yrs
- —
- Est. flood insurance / yr
- —
Fire risk No data
- Est. fire insurance / yr
- —
Heat risk 2/10 · Minimal
- Hot days now (above threshold)
- 7 days/yr
- Hot days in 30 yrs
- 15 days/yr
Wind risk No data
- Chance of severe wind over 30 yrs
- —
Air-quality risk 3/10 · Minor
- Unhealthy air days now
- 3 days/yr
- Unhealthy air days in 30 yrs
- 3 days/yr
Risk factors via First Street. Map © Google.
Why this score? — see what drove the C grade
The composite is a weighted blend of 9 inputs, each scored 0–100. Each bar is that input's sub-score; the figure is the points it added to the 100-point composite (weight × sub-score).
- ARV discount +15.0/15.0
- Cash flow +11.3/30.0
- 1% rule +10.0/10.0
- Appreciation +5.0/10.0
- Schools +5.0/10.0
- Livability +4.2/5.0
- DSCR +3.3/10.0
- Rent growth +2.5/5.0
- Condition / age +2.5/5.0
$70,000
🖨 Deal sheet 📄 Offer letter ✓ Due diligence
Listing remarks
Breezy Acres Cooperative is a resident owned and operated neighborhood, affording easy access to all points in Chittenden County. Minutes to shopping at I-89 Exit 16 with groceries, pharmacy, COSTCO, and employment. Malletts Bay is nearby, as is access to Milton, and downtown Burlington for UVM Medical Center and Hospital campuses, and Burlington International Airport. This home is located on a dead end leg of Seventh Street, and offers a nice sunny lot with extensive gardens, which even include grapes. A metal storage shed conveys. The kerosene tank was installed in approximately 2017 over a concrete slab. A new metal roof was installed in 2023 over the existing roof. Enjoy summer evenings
Key facts
- New metal roof
- Extensive gardens
- Three season porch
Tags
Property features AI
Finance
- Other: Located in Breezy Acres Cooperative, Inc.; mobile co-op approved; Mobile make: Artcraft; model: Frt Din 2 Bed; serial number 0261; Mobile park approval: yes
- HOA & community: Monthly cooperative/park fee; Park rent and utilities included in fee (water, sewer, trash); Fee includes plowing and trash removal; Association amenities include snow removal and trash removal
Exterior
- Parking: Paved driveway
- Utilities: Public water; Public sewer; 100 amp electric service with circuit breaker panel; Underground electric; Internet (cable); Cable service by XFinity; Phone service available
- Home design: Single-wide manufactured home; Front dining model (Frt Din 2 Bed); Grey exterior; Existing structure
- Construction: Built in 1972; Metal-clad exterior; Metal and other shingle roofing; Manufactured home construction
- Exterior features: Landscaped lot; Leased lot in a cooperative mobile home park; Level lot; Near shopping; Neighborhood setting; Paved driveway; No water view or waterfront access
Interior
- Kitchen: Electric range; Exhaust hood; Refrigerator
- Bedrooms: Master bedroom (main level); Second bedroom (main level)
- Flooring: Carpet; Vinyl; Vinyl plank
- Bathrooms: One full bathroom
- Heating & cooling: Forced air heating; Kerosene heating; Wall AC units
- Interior features: Five total rooms; Carpet and vinyl/vinyl plank flooring
- Laundry & utility: Washer and dryer; Electric water heater (owned)
Neighborhood map
What this means for you Summary
Snapshot
- This is a 2-bed/1.0-bath manufactured listed at $70k.
Deal economics
- At list price, monthly cash flow is $-25 ($-306/yr) — negative.
- To cash-flow at today's rent, offer at most $65k (6.4% below list).
- Meets the 1% rule at list price ($1k rent vs $70k).
- Recommended offer: $65k (6.4% below list) — sets the bar for cash-flow.
- Cap rate 5.9% vs local median 4.0% in Winooski — top-decile yield for the area; either an underpriced asset or a hidden risk that comps aren't pricing in. Stress-test before assuming the spread holds.
Location & tenants
- Location reads 84/100 on livability (#5 in VT, #831 nationally) — a professional / high-income tenant draw. Strengths: amenities A+, commute A+, health & safety A+; Watch: crime D.
- Market conditions: 1 active listings in the ZIP; 898 units permitted in Chittenden County in 2024 (554 in 5+ unit buildings).
Forward outlook
- In year one you build about $3k of equity ($484 loan paydown + $2k appreciation (3.0% local appreciation)).
- Chittenden County population projected at +8% by 2050 — modest demand growth; plan on rents tracking national, not racing it.
- At projected returns (3.0% appreciation + 3.0% rent growth), your $20k cash investment doubles in ~7 years — after that, you're playing with house money.
Negotiation context
- Only 8 days on market — expect competitive offers; lowballing is unlikely to land.
- Current owner paid $16k; list at $70k implies a 338% gain — meaningful room to come down on a strong offer.
Risks & watch-outs
- Watch-outs: HOA is 45% of rent.
Questions for the listing agent
- What do current leases actually rent for vs. the listed asking? Can we see a recent rent roll and the last 12 months of T-12 income?
- Built in 1972 — when were the roof, HVAC, electrical panel, plumbing, and water heater last replaced?
- What does the HOA fee cover, when was the last increase, and are there any pending special assessments or reserve-fund shortfalls?
- Is there a deadline driving the sale (1031 exchange, divorce, estate, relocation)? That informs how much negotiation room exists.
- Schools are B-rated — typically a magnet for longer-tenancy family renters. What's the average tenant stay here, and is there a school-zone premium baked into asking?
- Crime grade is D in this area — have there been break-ins, vandalism, or insurance claims at this property in the last 3 years? What carrier currently insures it and at what premium?
- What's the average days-on-market for RENTAL listings here right now (not sales)? A rising rental-DOM trend means longer vacancies and softer asking-rent achievability than the comps imply.
- What's the recent tenant-quality profile in this submarket — average credit score on applications, eviction rate, late-payment / NSF rate, and stable-employment percentage? A property-management company in the area should have these aggregated.
- How much new for-sale + rental construction is in the pipeline within 1–3 miles? Heavy new supply typically softens prices + rents 12–24 months out; constrained supply supports both.
Investment metrics
- 1% rule
- 1.64% ✓
- Cap rate
- 5.86%
- Cash-on-cash
- -1.56%
- DSCR
- 0.93
- GRM
- 5.1
CMA / ARV
- ARV (on-the-fly)
- $86,016
- Comps found
- 12
Show comp detail 12 sales within ~0.75 mi
| Address | Dist | Beds/Ba | Sqft | Sold | Price | $/sf | Match |
|---|---|---|---|---|---|---|---|
| 64 Seventh St | 0.06mi | 2/1.0 | 924 (+3%) | 11mo | $80,000 | $87 | 83 |
| 19 Third St | 0.15mi | 2/1.5 | 924 (+3%) | 8mo | $60,000 | $65 | 79 |
| 101 6th St | 0.06mi | 2/1.0 | 924 (+3%) | 18mo | $85,000 | $92 | 77 |
| 70 Fifth St | 0.08mi | 2/2.0 | 924 (+3%) | 13mo | $95,000 | $103 | 76 |
| 78 South St | 0.18mi | 2/2.0 | 952 (+6%) | 2mo | $124,500 | $131 | 75 |
| 44 Second St | 0.16mi | 3/1.0 (+1) | 938 (+5%) | 7mo | $111,000 | $118 | 74 |
| 21 Second St | 0.18mi | 2/2.0 | 960 (+7%) | 5mo | $90,000 | $94 | 72 |
| 116 Seventh St | 0.01mi | 2/2.0 | 1,000 (+12%) | 6mo | $75,000 | $75 | 71 |
| 62 First St | 0.19mi | 2/1.0 | 840 (-6%) | 15mo | $85,000 | $101 | 68 |
| 59 Fifth St | 0.10mi | 2/1.0 | 784 (-12%) | 9mo | $75,000 | $96 | 67 |
| 83 7th St | 0.04mi | 2/1.0 | 784 (-12%) | 18mo | $94,900 | $121 | 62 |
| 69 East Ave | 0.22mi | 2/1.0 | 972 (+8%) | 17mo | $68,500 | $70 | 62 |
Match score weights: distance 35% · size 25% · config 20% · recency 20%. Top-matched comps best support the ARV.
Projected returns pro-forma
3.0% appreciation · 3.0% rent growth · sell at horizon
- IRR
- 6.3%
- Equity multiple
- 1.36×
- Total profit
- $7,102
- Equity at exit
- $31,475
- IRR
- 9.4%
- Equity multiple
- 2.43×
- Total profit
- $27,971
- Equity at exit
- $48,507
Cash invested: $19,600 (down + closing). Projections, not guarantees.
Landlord ↔ Tenant lean methodology
- Overall (STATE)
- 41 Moderately Tenant-Leaning
- State Vermont
- 41 Moderately Tenant-Leaning · D+15
- County
- — inherits STATE
- City
- — inherits STATE
ZIP-level market 05466
- Active inventory
- 1
- Price-to-rent
- 5.1×
Monthly cashflow live
- Estimated rent
- $1,147 medium interval (Pro) →
- Mortgage (P&I)
- −$367
- Tax from tax record
- −$17 /mo · $200/yr
- Insurance
- −$29
- HOA
- −$519
- Vacancy / Maint / Mgmt
- −$241
- Net cashflow
- $-25
Break-even live
UW: 25.0% down · 7.5% · 30yr · 1.5% tax · 5.0% vac · 8.0% maint · 8.0% mgmt
Financing live
Cash to close
- Down payment
- $17,500
- Closing costs
- $2,100
- Reserves months
- —
- Total cash needed
- —
Loan-product check · same deal, 3 products live
Conventional
25% down · 7.5% · 30yr
- Down + closing
- —
- Monthly P&I
- —
- Monthly cashflow
- —
- DSCR
- —
- Eligible?
- —
Personal DTI + credit; lowest rate.
DSCR
20% down · 8.5% · 30yr
- Down + closing
- —
- Monthly P&I
- —
- Monthly cashflow
- —
- DSCR
- —
- Eligible?
- —
No personal income docs; deal must DSCR.
Hard money
10% down · 12.0% · 12mo
- Down + closing
- —
- Monthly P&I
- —
- Monthly cashflow
- —
- DSCR
- —
- Eligible?
- —
Short-term bridge; refi at stabilization.
HOA detail
- Monthly dues
- $519 · $6,228/yr
Listing history 8 events
-
2026-06-19days on market $70,000 Active 8 DOM
-
2026-06-18days on market $70,000 Active 7 DOM
-
2026-06-17days on market $70,000 Active 6 DOM
-
2026-06-16days on market $70,000 Active 5 DOM
-
2026-06-15days on market $70,000 Active 4 DOM
-
2026-06-14days on market $70,000 Active 2 DOM
-
2026-06-13remarks 699-char remark
-
2026-06-13$70,000 Active 1 DOM
ⓘ Source: listings_history table (triggers on properties + properties_extension) + one-shot
backfill from property_details.listing_events for pre-trigger history.
Tax reassessment forecast VT · Partial reset (capped growth)
- Current annual tax
- $200 · $17/mo
- Projected year-2 tax
- $765 · $64/mo
- Expected delta
- +$565/yr (+$47/mo · 282.2%)
ⓘ Screening estimate from a state-policy table — verify with the county assessor before closing.
Climate risk First Street
- Heat 2/10 Low
- Air quality 3/10 Moderate 3 unhealthy d/yr today · 3 by 30 yrs out
Nearby sold comps map
Loading sold comps map…
Walkable amenities ~0.75 mi
Loading nearby amenities…
Taxation est. · year 1
- Rental income
- $13,769
- − Mortgage interest
- −$3,921
- − Property taxes
- −$200
- − Insurance
- −$350
- − Repairs & maintenance
- −$1,102
- − Management
- −$1,102
- − HOA
- −$6,228
- − Depreciation
- −$2,036
- Taxable loss
- −$1,170
- Est. tax savings @ 24.0%
- +$281
- After-tax cash flow
- $-25/yr
For passive investors: Depreciation is non-cash, so a rental often shows a tax loss while cash-flowing — sheltering income. Rental losses are passive: they offset passive income freely, and up to $25,000/yr can offset ordinary (W-2) income if you actively participate and your MAGI is under $100k (phasing out to $0 by $150k); unused losses carry forward. On sale, claimed depreciation is recaptured at up to 25%, and gains may owe capital-gains tax (a 1031 exchange can defer both). Figures are a year-1 estimate at your 24.0% rate — not tax advice; consult a CPA.
Schools (NCES district)
No district data.
Livability — Winooski
- Score
- 84/100
- State rank
- #5
- US rank
- #831
Category grades
Schools grade is shown separately in the Schools card above.
Census & demographics
No demographic data for this ZIP.
Market trends
- HPI YoY
- —
- Current HPI
- —
- Rent YoY
- —
- Metro
- —
- State GDP YoY
- —
- F500 in state
- 0
Price history
+337.5% since first listed2 events — show timeline
- 2026-06-10 Listed $70,000 PrimeMLS
- 2017-11-30 Sold (Public Records) $16,000 Public Records
Property tax history
-2.8%/yrLatest (2024): $200 · +15.1% YoY. Source: county tax records.
Cash-flow waterfall
monthlySold comps — $/sqft
last 12 mo · ≤1 miLoading sold comps…