 🏗️ New Construction
The Levi Plan · Pearland, TX
Flood risk No data
- FEMA flood zone
- —
- Chance of flooding over 30 yrs
- —
- Est. flood insurance / yr
- —
Fire risk No data
- Est. fire insurance / yr
- —
Heat risk No data
- Hot days now (above threshold)
- —
- Hot days in 30 yrs
- —
Wind risk No data
- Chance of severe wind over 30 yrs
- —
Air-quality risk No data
- Unhealthy air days now
- —
- Unhealthy air days in 30 yrs
- —
Risk factors via First Street. Map © Google.
Why this score? — see what drove the B- grade
The composite is a weighted blend of 9 inputs, each scored 0–100. Each bar is that input's sub-score; the figure is the points it added to the 100-point composite (weight × sub-score).
- Cash flow +30.0/30.0
- 1% rule +10.0/10.0
- DSCR +10.0/10.0
- ARV discount +7.5/15.0
- Livability +4.0/5.0
- Rent growth +3.2/5.0
- Schools +1.9/10.0
- Condition / age +1.0/5.0
- Appreciation +0.0/10.0
$117,900
🖨 Deal sheet 📄 Offer letter ✓ Due diligence
Listing remarks MLS
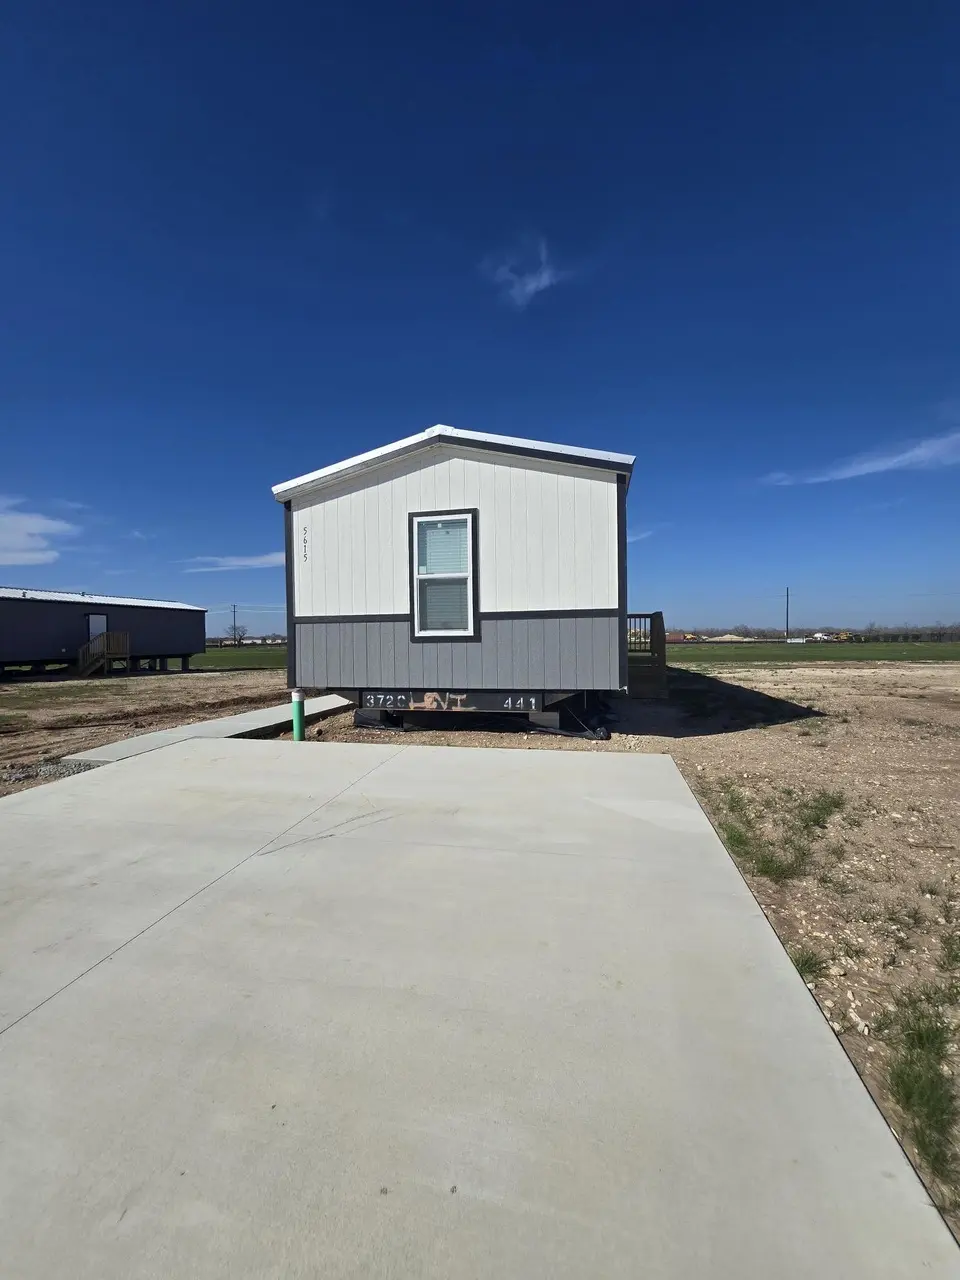
Showstopper Manufactured Home in Gated Community! This stunning manufactured home is move-in ready and packed with features! Highlights: Stainless steel appliances add a modern touch to the kitchen. Separate utility room provides extra storage and functionality. Kitchen island with ample cabinet space makes meal prep and entertaining a breeze. Abundant natural light creates a bright and inviting atmosphere. Energy-efficient features like Thermo-pane windows help keep utility bills low. Large soaker tub in the bathroom provides a relaxing spa-like experience. Central air conditioning keeps you cool and comfortable year-round. Storage shed offers additional space for your belongings. Located in a beautiful gated community, this home offers residents access to: Sparkling pool Inviting clubhouse Modern fitness center Dog park for your furry companions Spacious soccer field And much more! Limited-time specials are available! Don't miss out on this incredible opportunity! Come and see us today! Land Leased not owned
Key facts
- Large soaker tub
- Kitchen island
- Listed 391 days
Tags
Neighborhood map
What this means for you Summary
Snapshot
- This is a 3-bed/2.0-bath manufactured listed at $118k. Condition is rated poor.
Deal economics
- At list price, monthly cash flow is $667 ($8k/yr) — positive.
- The deal already cash-flows at list — no discount required.
- Meets the 1% rule at list price ($2k rent vs $118k).
- Recommended offer: $104k (12.0% below list) — sets the bar for market timing.
- Cap rate 13.1% vs local median 3.0% in Pearland — top-decile yield for the area; either an underpriced asset or a hidden risk that comps aren't pricing in. Stress-test before assuming the spread holds.
Location & tenants
- Location reads 81/100 on livability (#32 in TX, #1,539 nationally) — a professional / high-income tenant draw. Strengths: schools A+, employment A+, housing A+; Watch: amenities D-, commute F.
- East Central ISD (rural): math 16% / reading 25% proficiency, ranked #758 of 826 in TX (top 92%) — low school quality limits family demand, transient renter base, plan for 1-2y turnover; 61% free/reduced lunch — lower-income household profile, screen leases tightly.
- Market conditions: Rents rising (+2.9%/yr); 316 active listings in the ZIP; 6 comparable units currently listed for rent nearby; rentals lingering (median 44d on market — plan ~5-8 weeks vacancy on turnover, expect pricing pressure); 67% of comp listings sitting > 30 days — soft ceiling on asking rent; high-income renter base; 8,308 units permitted in Bexar County in 2024 (2,506 in 5+ unit buildings).
Forward outlook
- Local home prices are declining (-3.0%/yr); year-one equity from $815 of loan paydown is wiped out by about $4k of value loss. Plan a longer hold.
- Bexar County population projected at +50% by 2050 — long-run rental-demand tailwind backs the buy-and-hold thesis.
- At projected returns (-3.0% appreciation + 2.9% rent growth), your $33k cash investment doubles in ~6 years — after that, you're playing with house money.
Negotiation context
- It's been on market 391 days — a 12% lower offer ($104k) is reasonable based on typical stale-listing flexibility.
Questions for the listing agent
- It's been on market 391 days. Have you received any prior offers? Is the seller open to a 12% concession, seller financing, or rate buy-down credit?
- Have any recent inspections been done? Can we get a copy of the seller's disclosures and any deferred-maintenance estimates?
- Why hasn't it sold? Are there any deal-killer items the seller is aware of (foundation, flood, title, zoning, code violations)?
- Is there a deadline driving the sale (1031 exchange, divorce, estate, relocation)? That informs how much negotiation room exists.
- Schools are A-rated — typically a magnet for longer-tenancy family renters. What's the average tenant stay here, and is there a school-zone premium baked into asking?
- What's the average days-on-market for RENTAL listings here right now (not sales)? A rising rental-DOM trend means longer vacancies and softer asking-rent achievability than the comps imply.
- What's the recent tenant-quality profile in this submarket — average credit score on applications, eviction rate, late-payment / NSF rate, and stable-employment percentage? A property-management company in the area should have these aggregated.
- How much new for-sale + rental construction is in the pipeline within 1–3 miles? Heavy new supply typically softens prices + rents 12–24 months out; constrained supply supports both.
Investment metrics
- 1% rule
- 1.59% ✓
- Cap rate
- 13.08%
- Cash-on-cash
- 24.26%
- DSCR
- 2.08
- GRM
- 5.2
CMA / ARV
No comps found within radius.
Projected returns pro-forma
-3.0% appreciation · 2.94% rent growth · sell at horizon
- IRR
- 17.5%
- Equity multiple
- 1.71×
- Total profit
- $23,310
- Equity at exit
- $17,579
- IRR
- 25.9%
- Equity multiple
- 3.26×
- Total profit
- $74,674
- Equity at exit
- $10,194
Cash invested: $33,012 (down + closing). Projections, not guarantees.
Landlord ↔ Tenant lean methodology
- Overall (STATE)
- 87 Strongly Landlord-Friendly
- State Texas
- 87 Strongly Landlord-Friendly · R+5
- County
- — inherits STATE
- City
- — inherits STATE
ZIP-level market 77581
- Home prices YoY
- -29.1%
- Rents YoY
- 2.9%
- Active inventory
- 316
- Price-to-rent
- 5.2×
Monthly cashflow live
- Estimated rent
- $1,876 high interval (Pro) →
- Mortgage (P&I)
- −$618
- Tax est. 1.5%
- −$147 /mo · $1,768/yr
- Insurance
- −$49
- HOA
- −$0
- Vacancy / Maint / Mgmt
- −$394
- Net cashflow
- $667
Break-even live
UW: 25.0% down · 7.5% · 30yr · 1.5% tax · 5.0% vac · 8.0% maint · 8.0% mgmt
Financing live
Cash to close
- Down payment
- $29,475
- Closing costs
- $3,537
- Reserves months
- —
- Total cash needed
- —
Loan-product check · same deal, 3 products live
Conventional
25% down · 7.5% · 30yr
- Down + closing
- —
- Monthly P&I
- —
- Monthly cashflow
- —
- DSCR
- —
- Eligible?
- —
Personal DTI + credit; lowest rate.
DSCR
20% down · 8.5% · 30yr
- Down + closing
- —
- Monthly P&I
- —
- Monthly cashflow
- —
- DSCR
- —
- Eligible?
- —
No personal income docs; deal must DSCR.
Hard money
10% down · 12.0% · 12mo
- Down + closing
- —
- Monthly P&I
- —
- Monthly cashflow
- —
- DSCR
- —
- Eligible?
- —
Short-term bridge; refi at stabilization.
Rent comps 6 comps
| Address | Beds | Baths | Sqft | Rent | $/sqft | DOM | Units | Dist |
|---|---|---|---|---|---|---|---|---|
| 10534 Green Rock Dr San Antonio, TX | 3.0 | 2.5 | 1311 | $1,700 | $1.30 | 43d | 1 | 0.28mi |
| 10454 Clearwater Way San Antonio, TX | 3.0 | 2.5 | 1239 | $1,425 | $1.15 | 11d | 1 | 0.51mi |
| 10447 Clearwater Way San Antonio, TX | 3.0 | 2.5 | 1420 | $1,500 | $1.06 | 43d | 1 | 0.53mi |
| 10822 Green Brook St San Antonio, TX | 3.0 | 2.0 | 1023 | $1,500 | $1.47 | 43d | 1 | 0.55mi |
| 11026 Tree Line San Antonio, TX | 3.0 | 2.5 | 1360 | $1,299 | $0.96 | 43d | 1 | 0.78mi |
| 5727 Coopers Xing San Antonio, TX | 3.0 | 2.0 | 1127 | $2,400 | $2.13 | 22d | 1 | 1.18mi |
Listing history 14 events
-
2026-06-18days on market $117,900 Active 391 DOM
-
2026-06-17days on market $117,900 Active 390 DOM
-
2026-06-16days on market $117,900 Active 389 DOM
-
2026-06-15days on market $117,900 Active 388 DOM
-
2026-06-13days on market $117,900 Active 386 DOM
-
2026-06-09days on market $117,900 Active 382 DOM
-
2026-06-08days on market $117,900 Active 381 DOM
-
2026-06-07days on market $117,900 Active 380 DOM
-
2026-06-04days on market $117,900 Active 377 DOM
-
2026-06-03days on market $117,900 Active 376 DOM
-
2026-06-02days on market $117,900 Active 375 DOM
-
2026-06-01days on market $117,900 Active 374 DOM
-
2026-05-31days on market $117,900 Active 373 DOM
-
2025-05-23$117,900 Active 1028-char remark
Show marketing remark (1028 chars)
Showstopper Manufactured Home in Gated Community! This stunning manufactured home is move-in ready and packed with features! Highlights: Stainless steel appliances add a modern touch to the kitchen. Separate utility room provides extra storage and functionality. Kitchen island with ample cabinet space makes meal prep and entertaining a breeze. Abundant natural light creates a bright and inviting atmosphere. Energy-efficient features like Thermo-pane windows help keep utility bills low. Large soaker tub in the bathroom provides a relaxing spa-like experience. Central air conditioning keeps you cool and comfortable year-round. Storage shed offers additional space for your belongings. Located in a beautiful gated community, this home offers residents access to: Sparkling pool Inviting clubhouse Modern fitness center Dog park for your furry companions Spacious soccer field And much more! Limited-time specials are available! Don't miss out on this incredible opportunity! Come and see us today! Land Leased not owned
ⓘ Source: listings_history table (triggers on properties + properties_extension) + one-shot
backfill from property_details.listing_events for pre-trigger history.
Nearby sold comps map
Loading sold comps map…
Walkable amenities ~0.75 mi
Loading nearby amenities…
Taxation est. · year 1
- Rental income
- $22,512
- − Mortgage interest
- −$6,604
- − Property taxes
- −$1,768
- − Insurance
- −$590
- − Repairs & maintenance
- −$1,801
- − Management
- −$1,801
- − Depreciation
- −$3,430
- Taxable income
- $6,518
- Est. tax owed @ 24.0%
- −$1,564
- After-tax cash flow
- $6,443/yr
For passive investors: Depreciation is non-cash, so a rental often shows a tax loss while cash-flowing — sheltering income. Rental losses are passive: they offset passive income freely, and up to $25,000/yr can offset ordinary (W-2) income if you actively participate and your MAGI is under $100k (phasing out to $0 by $150k); unused losses carry forward. On sale, claimed depreciation is recaptured at up to 25%, and gains may owe capital-gains tax (a 1031 exchange can defer both). Figures are a year-1 estimate at your 24.0% rate — not tax advice; consult a CPA.
Condition & rehab AI · 1 photo
This manufactured home requires extensive repairs and updates to bring it up to a livable condition. Significant investments in the roof, exterior, interior, and systems are necessary to make it move-in ready.
Repairs flagged
- Major roof inspection — Aging roof may need replacement or repair.
- Major exterior siding inspection — Structural integrity of siding needs assessment.
- Major foundation inspection — Foundation may need repair or reinforcement.
- Major interior wall and paint inspection — Interior walls and paint may need repainting or repairs.
- Major kitchen and bathroom inspections — Kitchen and bathroom may need updates or repairs.
- Major HVAC and mechanicals inspection — HVAC and mechanicals may need maintenance or replacement.
- Major landscaping and curb appeal — Landscaping and curb appeal may need improvement to enhance curb appeal.
Value-add opportunities
- Resale exterior siding and roof replacement — Aesthetic and structural improvements.
- Resale interior wall and paint refresh — Enhances the home's appearance and appeal.
- Resale kitchen and bathroom updates — Modernizes the living spaces and adds value.
- Rental HVAC and mechanicals upgrade — Improves comfort and energy efficiency, attracting renters.
- Both landscaping and curb appeal — Enhances the home's curb appeal and adds value for both resale and rental.
Renovation cost estimate screening
| Repair item | Severity | Est. cost |
|---|---|---|
| roof inspection · Aging roof may need replacement or repair. | Major | $15,000–50,000 |
| exterior siding inspection · Structural integrity of siding needs assessment. | Major | $15,000–50,000 |
| foundation inspection · Foundation may need repair or reinforcement. | Major | $15,000–50,000 |
| interior wall and paint inspection · Interior walls and paint may need repainting or repairs. | Major | $15,000–50,000 |
| kitchen and bathroom inspections · Kitchen and bathroom may need updates or repairs. | Major | $15,000–50,000 |
| HVAC and mechanicals inspection · HVAC and mechanicals may need maintenance or replacement. | Major | $15,000–50,000 |
| landscaping and curb appeal · Landscaping and curb appeal may need improvement to enhance curb appeal. | Major | $15,000–50,000 |
| Total estimated repair cost · 7 items | $105,000–350,000 |
Value-add ROI direction
- Resale exterior siding and roof replacement — Aesthetic and structural improvements. ↑
- Resale interior wall and paint refresh — Enhances the home's appearance and appeal. ↑
- Resale kitchen and bathroom updates — Modernizes the living spaces and adds value. ↑
- Rental HVAC and mechanicals upgrade — Improves comfort and energy efficiency, attracting renters. ↑
- Both landscaping and curb appeal — Enhances the home's curb appeal and adds value for both resale and rental. ↑
ⓘ Cost ranges are severity-bucket heuristics (US national rule-of-thumb). Get contractor quotes + a written scope before underwriting a rehab budget.
Schools (NCES district)
- District
- East Central ISD
- NCES district ID
- 4817850
- Math proficiency
- 16% ▼ -12.00%
- Reading proficiency
- 25% ▼ -6.00%
- Median HH income
- $53,941
- Composite
- 18.67/100
- National rank
- #8887
- State rank
- #758 of 826 in TX
Livability — Pearland
- Score
- 81/100
- State rank
- #32
- US rank
- #1539
Category grades
Schools grade is shown separately in the Schools card above.
Census & demographics
- County
- Brazoria County · 374,982 people
- City population
- 142,397
- Metro
- Houston-The Woodlands-Sugar Land, TX
- Population (ZIP)
- 51,332
- Household income
- $111,139
- Rent vs Own
- Severe rent burden
- 826.0
Population outlook (Bexar County) Hauer SSP2
- Today (2025)
- 2,336,851 people
- By 2030
- 2,560,728 · +9.6%
- By 2040
- 3,020,569 · +29.3%
- By 2050
- 3,493,522 · +49.5%
- By 2075
- 4,668,459 · +99.8%
- By 2100
- 5,533,242 · +136.8%
Race, ethnicity, and origin ACS 2023
- Neighborhood character
- Diverse neighborhood (Simpson 0.66)
- Race & ethnicity
- White 47% Hispanic / Latino 33% Two or more races 20% Black 10% Asian 7%
- Hispanic origin (detail)
- Mexican 26% Puerto Rican 2%
- Common ancestry
- Lithuanian 2% Slovak 2% Romanian 2%
- Foreign-born
- 12% · Canada, Vietnam, Guatemala
- Languages at home
- 77% English-only · Spanish 16% Other Indo-European 3% Vietnamese 2%
Political lean MEDSL · Bexar
- 2024 margin
- Lean D (+9.8) · D 54.3% · R 44.6% · Other 1.1%
- 2008→2024 swing
- +4.2pp toward D · 2008: 5.6pp · 2024: 9.8pp
- All cycles
- 2024: D+9.8 2020: D+18.2 2016: D+13.5 2012: D+4.6 2008: D+5.6
Not yet ingested
- Civics
- —
Market trends
- HPI YoY
- ▼ -100.56%
- Current HPI
- 244.7942
- Rent YoY
- ▲ 2.94%
- Metro
- Houston-The Woodlands-Sugar Land, TX
- State GDP YoY
- ▲ 3.95%
- F500 in state
- 110
Industry mix (Fortune 500 HQ in TX)
| Industry | F500 HQs | Revenue |
|---|---|---|
| Energy | 16 | $1,198B |
|
||
| Technology | 5 | $198B |
|
||
| Engineering / Construction | 4 | $72B |
|
||
| Energy Services | 3 | $60B |
|
||
| Utilities | 3 | $41B |
|
||
| Healthcare | 2 | $330B |
|
||
Price history
1 event — show timeline
- 2025-05-23 Listed $117,900 Zillow
Cash-flow waterfall
monthlySold comps — $/sqft
last 12 mo · ≤1 miLoading sold comps…