 🌊 Lakefront
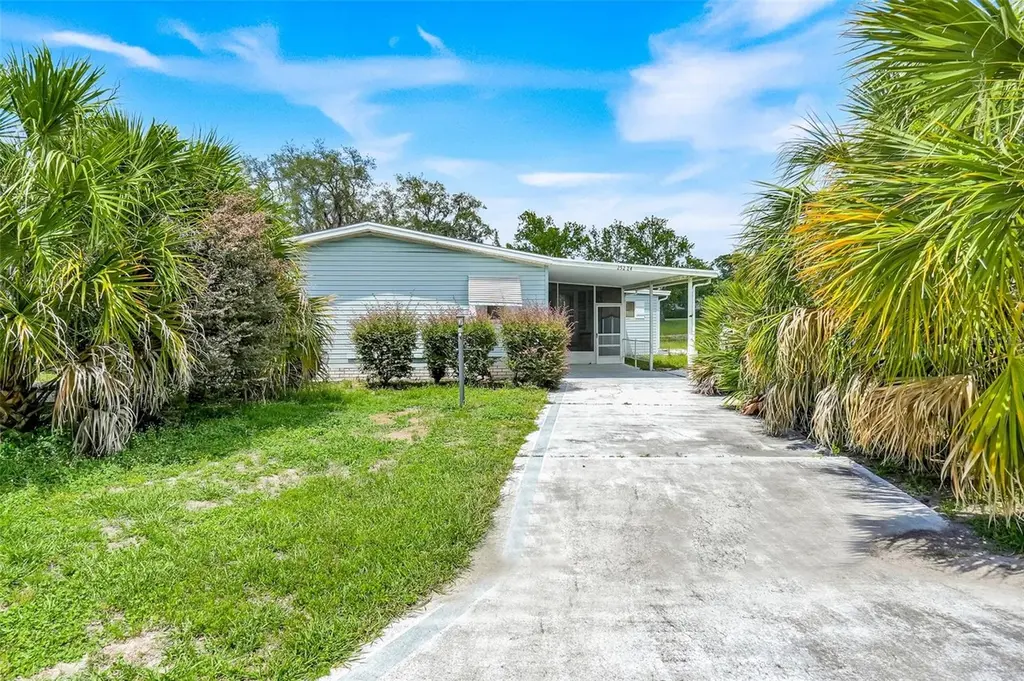
25224 Wild Heron · Leesburg, FL
Flood risk 1/10 · Minimal
- FEMA flood zone
- A
- Chance of flooding over 30 yrs
- 0.0%
- Est. flood insurance / yr
- $1,009 – $1,996
Fire risk 3/10 · Minor
- Est. fire insurance / yr
- $947 – $1,759
Heat risk 8/10 · Major
- Hot days now (above 108°F)
- 7 days/yr
- Hot days in 30 yrs
- 22 days/yr
Wind risk 9/10 · Severe
- Chance of severe wind over 30 yrs
- 99.0%
Air-quality risk 2/10 · Minimal
- Unhealthy air days now
- 1 days/yr
- Unhealthy air days in 30 yrs
- 2 days/yr
Risk factors via First Street. Map © Google.
Why this score? — see what drove the B- grade
The composite is a weighted blend of 9 inputs, each scored 0–100. Each bar is that input's sub-score; the figure is the points it added to the 100-point composite (weight × sub-score).
- Cash flow +30.0/30.0
- 1% rule +10.0/10.0
- DSCR +10.0/10.0
- ARV discount +6.0/15.0
- Schools +4.2/10.0
- Livability +3.1/5.0
- Condition / age +2.5/5.0
- Rent growth +2.3/5.0
- Appreciation +0.0/10.0
$125,000
🖨 Deal sheet 📄 Offer letter ✓ Due diligence
Listing remarks MLS
Resident owned Gated Golf & Tennis Community ~ Three clubhouses, 3 swimming pools, tennis courts, plus too many activities to list ~ 36 holes of year round golf available ~ 30-45 minute drive to Orlando attractions ~ An hour drive either coast ~Mostly Turnkey Furnished ~ New Sink & Fixtures 2010 ~ New AC 2008 ~ New Roof 2005 ~ New Ceramic Top Range 2002 ~ Built In Microwave ~ Washer/Dryer Included ~ Wood Laminate Flooring ~ Ceiling fans: BRs, Living Room, Florida Room & Utility Room ~ Phone jacks: Bedrooms & Kitchen ~ Cable outlets: Living Room, Master BR & Florida Room ~ Gutters and downspouts ~ Irrigation system with timer A MUST SEE! CALL TODAY!!!! ~ Information deemed reliable, but not guaranteed ~ Note: Property taxes may increase or decrease with reassessment after the sale.
Key facts
- 5,511 sq ft lot
- Parking
- Community pool
Property features AI
Finance
- Other: Buyer approval required for community
- Financial info: Monthly HOA $180 (total monthly fees $180); Total annual HOA fees $2,160; Lease restrictions apply
- HOA & community: Plantation HOA with required monthly fee ($180); HOA includes 24-hour guard, pool, and recreational facilities; Association approval required; Clubhouse, community mailbox, deed restrictions, sidewalks, tennis courts, golf carts allowed, special community restrictions; Senior community; Pets allowed
Exterior
- Parking: Has carport (1 space)
- Security: 24-hour guarded community
- Utilities: Public water; Public sewer; Electricity connected
- Home design: Manufactured double-wide home; Residential property; Fixer condition; One level; Faces southwest
- Construction: Frame construction; Membrane roof; Built with crawlspace foundation; Approximately 1,864 total building area
- Exterior features: Sliding doors; Asphalt road frontage
Interior
- Kitchen: Dishwasher; Range; Refrigerator; Electric water heater
- Bedrooms: 2 bedrooms
- Flooring: Laminate; Crawlspace foundation
- Bathrooms: 2 full bathrooms
- Heating & cooling: Central heating (electric); Central air conditioning
- Interior features: Ceiling fans
- Laundry & utility: Laundry room inside
Neighborhood map
What this means for you Summary
Snapshot
- This is a 2-bed/2.0-bath manufactured listed at $125k.
Deal economics
- At list price, monthly cash flow is $520 ($6k/yr) — positive.
- The deal already cash-flows at list — no discount required.
- Meets the 1% rule at list price ($2k rent vs $125k).
- Cap rate 12.5% vs local median 4.5% in Leesburg — top-decile yield for the area; either an underpriced asset or a hidden risk that comps aren't pricing in. Stress-test before assuming the spread holds.
Location & tenants
- Location reads 62/100 on livability (#751 in FL) — a middle-class / working-renter tenant base. Strengths: cost of living A+, housing A+; Watch: schools D+, crime D, amenities F.
- Lake (suburban): math 49% / reading 50% proficiency, ranked #37 of 73 in FL (top 51%) — families likely to look elsewhere, expect single-tenant / working-renter base with shorter leases.
- Market conditions: Rents soft (-0.9%/yr); 783 active listings in the ZIP; 8 comparable units currently listed for rent nearby; rentals at typical pace (median 24d on market — plan ~3-4 weeks tenant-placement turnaround); 4,799 units permitted in Lake County in 2024 (814 in 5+ unit buildings).
- This rent runs 43% of the median local income ($58k/yr) — at the standard rent-burdened threshold; future hikes will face affordability resistance.
Forward outlook
- Local home prices are declining (-3.0%/yr); year-one equity from $864 of loan paydown is wiped out by about $4k of value loss. Plan a longer hold.
- Lake County population projected at +37% by 2050 — long-run rental-demand tailwind backs the buy-and-hold thesis.
- At projected returns (-3.0% appreciation + 0.0% rent growth), your $35k cash investment doubles in ~10 years — after that, you're playing with house money.
Negotiation context
- Only 10 days on market — expect competitive offers; lowballing is unlikely to land.
- 2 sale attempts since 15y ago with the ask held roughly flat each time — persistent listings suggest the price (not the market) is what's stuck; bring a comps-based counter.
- Current owner paid $70k; list at $125k implies a 80% gain — meaningful room to come down on a strong offer.
Risks & watch-outs
- Watch-outs: flood insurance adds $125/mo.
- Climate carrying-cost: in FEMA flood zone A (mandatory federal flood insurance); severe wind risk, 99% chance of damaging wind over 30y; extreme-heat days projected 7→22/yr by 2055 (HVAC capex compounding) — expect insurance premiums to compound above CPI over the hold.
Questions for the listing agent
- What's the actual annual flood-insurance premium (NFIP or private), and is the property in a SFHA with mandatory coverage?
- What does the HOA fee cover, when was the last increase, and are there any pending special assessments or reserve-fund shortfalls?
- Is there a deadline driving the sale (1031 exchange, divorce, estate, relocation)? That informs how much negotiation room exists.
- Schools are D-rated, which usually means shorter tenancies and higher turnover. Who's the typical renter profile here, and what's been the actual vacancy rate?
- Crime grade is D in this area — have there been break-ins, vandalism, or insurance claims at this property in the last 3 years? What carrier currently insures it and at what premium?
- This sits on a lake — are riparian / water-frontage rights deeded with the parcel? Any dock permits, shoreline easements, or HOA water-use restrictions?
- What's the documented flood / surge / shoreline-erosion history here (FEMA AND non-FEMA — e.g., storm surge, creek backup, septic-field saturation)?
- Any water-quality or seasonal algae-bloom issues that affect tenant satisfaction or short-term-rental demand?
- What's the average days-on-market for RENTAL listings here right now (not sales)? A rising rental-DOM trend means longer vacancies and softer asking-rent achievability than the comps imply.
- What's the recent tenant-quality profile in this submarket — average credit score on applications, eviction rate, late-payment / NSF rate, and stable-employment percentage? A property-management company in the area should have these aggregated.
- How much new for-sale + rental construction is in the pipeline within 1–3 miles? Heavy new supply typically softens prices + rents 12–24 months out; constrained supply supports both.
Investment metrics
- 1% rule
- 1.65% ✓
- Cap rate
- 12.49%
- Cash-on-cash
- 22.12%
- DSCR
- 1.98
- GRM
- 5.0
CMA / ARV
- ARV (on-the-fly)
- $120,900
- Comps found
- 1
Show comp detail 1 sale within ~0.75 mi
| Address | Dist | Beds/Ba | Sqft | Sold | Price | $/sf | Match |
|---|---|---|---|---|---|---|---|
| 25101 Barrow Hl | 0.19mi | 2/2.0 | 1,446 (+11%) | 10mo | $135,000 | $93 | 64 |
Match score weights: distance 35% · size 25% · config 20% · recency 20%. Top-matched comps best support the ARV.
Projected returns pro-forma
-3.0% appreciation · 0.0% rent growth · sell at horizon
- IRR
- 5.4%
- Equity multiple
- 1.20×
- Total profit
- $7,004
- Equity at exit
- $18,638
- IRR
- 11.3%
- Equity multiple
- 1.75×
- Total profit
- $26,126
- Equity at exit
- $10,808
Cash invested: $35,000 (down + closing). Projections, not guarantees.
Landlord ↔ Tenant lean methodology
- Overall (STATE)
- 87 Strongly Landlord-Friendly
- State Florida
- 87 Strongly Landlord-Friendly · R+3
- County
- — inherits STATE
- City
- — inherits STATE
ZIP-level market 34748
- Home prices YoY
- -25.3%
- Rents YoY
- -0.9%
- Active inventory
- 783
- Price-to-rent
- 5.0×
Monthly cashflow live
- Estimated rent
- $2,063 high interval (Pro) →
- Mortgage (P&I)
- −$656
- Tax from tax record
- −$97 /mo · $1,162/yr
- Insurance
- −$52
- Flood insurance flood zone
- −$125 /mo · $1,502/yr
- HOA
- −$180
- Vacancy / Maint / Mgmt
- −$433
- Net cashflow
- $520
Break-even live
UW: 25.0% down · 7.5% · 30yr · 1.5% tax · 5.0% vac · 8.0% maint · 8.0% mgmt
Financing live
Cash to close
- Down payment
- $31,250
- Closing costs
- $3,750
- Reserves months
- —
- Total cash needed
- —
Loan-product check · same deal, 3 products live
Conventional
25% down · 7.5% · 30yr
- Down + closing
- —
- Monthly P&I
- —
- Monthly cashflow
- —
- DSCR
- —
- Eligible?
- —
Personal DTI + credit; lowest rate.
DSCR
20% down · 8.5% · 30yr
- Down + closing
- —
- Monthly P&I
- —
- Monthly cashflow
- —
- DSCR
- —
- Eligible?
- —
No personal income docs; deal must DSCR.
Hard money
10% down · 12.0% · 12mo
- Down + closing
- —
- Monthly P&I
- —
- Monthly cashflow
- —
- DSCR
- —
- Eligible?
- —
Short-term bridge; refi at stabilization.
Rent comps 8 comps
| Address | Beds | Baths | Sqft | Rent | $/sqft | DOM | Units | Dist |
|---|---|---|---|---|---|---|---|---|
| 5009 El Destino Dr Leesburg, FL | 2.0 | 2.0 | 1428 | $2,450 | $1.72 | 24d | 1 | 0.18mi |
| 25049 Navel Ave Leesburg, FL | 2.0 | 2.0 | 1430 | $2,800 | $1.96 | 24d | 1 | 0.31mi |
| 25533 Belle Helene Leesburg, FL | 2.0 | 2.0 | 1352 | $1,650 | $1.22 | 5d | 1 | 0.58mi |
| 4728 Belle Grv Leesburg, FL | 2.0 | 2.0 | 1480 | $1,700 | $1.15 | 24d | 1 | 0.63mi |
| 4501 River Ridge Dr Leesburg, FL | 2.0 | 2.0 | 1467 | $1,725 | $1.18 | 5d | 1 | 1.05mi |
| 10140 Huntingnet Way Leesburg, FL | 3.0 | 2.0 | 1589 | $2,250 | $1.42 | 24d | 1 | 1.38mi |
| 5440 Rosewall Cir Leesburg, FL | 2.0 | 2.0 | 1200 | $1,950 | $1.62 | 5d | 1 | 1.48mi |
| 3690 Arlington Ridge Blvd Leesburg, FL | 3.0 | 2.0 | 1699 | $2,200 | $1.29 | 18d | 1 | 1.50mi |
HOA detail
- Monthly dues
- $180 · $2,160/yr
- Likely covers
- cablepoolsecurity
Listing history 7 events
-
2026-06-18days on market $125,000 Active 10 DOM
-
2026-06-17days on market $125,000 Active 9 DOM
-
2026-06-16days on market $125,000 Active 8 DOM
-
2026-06-15days on market $125,000 Active 7 DOM
-
2026-06-13days on market $125,000 Active 5 DOM
-
2026-06-08remarks 675-char remark
-
2026-06-08$125,000 Active 1 DOM
ⓘ Source: listings_history table (triggers on properties + properties_extension) + one-shot
backfill from property_details.listing_events for pre-trigger history.
Tax reassessment forecast FL · Resets to sale price
- Current annual tax
- $1,162 · $97/mo
- Projected year-2 tax
- $1,162 · $97/mo
- Expected delta
- $0/yr ($0/mo · 0.0%)
ⓘ Screening estimate from a state-policy table — verify with the county assessor before closing.
Climate risk First Street
- Flood 1/10 Low FEMA zone A · 0% chance over 30 yrs
- Wildfire 3/10 Moderate
- Heat 8/10 Severe 7 d/yr ≥108°F today · 22 d/yr by 30 yrs out
- Wind 9/10 Extreme 99% chance of damaging wind over 30 yrs
- Air quality 2/10 Low 1 unhealthy d/yr today · 2 by 30 yrs out
Nearby sold comps map
Loading sold comps map…
Walkable amenities ~0.75 mi
Loading nearby amenities…
Taxation est. · year 1
- Rental income
- $24,755
- − Mortgage interest
- −$7,002
- − Property taxes
- −$1,162
- − Insurance
- −$2,128
- − Repairs & maintenance
- −$1,980
- − Management
- −$1,980
- − HOA
- −$2,160
- − Depreciation
- −$3,636
- Taxable income
- $4,706
- Est. tax owed @ 24.0%
- −$1,130
- After-tax cash flow
- $5,111/yr
For passive investors: Depreciation is non-cash, so a rental often shows a tax loss while cash-flowing — sheltering income. Rental losses are passive: they offset passive income freely, and up to $25,000/yr can offset ordinary (W-2) income if you actively participate and your MAGI is under $100k (phasing out to $0 by $150k); unused losses carry forward. On sale, claimed depreciation is recaptured at up to 25%, and gains may owe capital-gains tax (a 1031 exchange can defer both). Figures are a year-1 estimate at your 24.0% rate — not tax advice; consult a CPA.
Schools (NCES district)
- District
- Lake
- NCES district ID
- 1201050
- Math proficiency
- 49% ▼ -7.00%
- Reading proficiency
- 50% ▼ -4.00%
- Median HH income
- $46,632
- Composite
- 42.05/100
- National rank
- #3327
- State rank
- #37 of 73 in FL
Livability — Leesburg
- Score
- 62/100
- State rank
- #751
- US rank
- #16429
Category grades
Schools grade is shown separately in the Schools card above.
Census & demographics
- County
- Lake County · 364,602 people
- City population
- 70,232
- Metro
- Orlando-Kissimmee-Sanford, FL
- Population (ZIP)
- 48,095
- Household income
- $58,192
- Rent vs Own
- Severe rent burden
- 1745.0
Population outlook (Lake County) Hauer SSP2
- Today (2025)
- 386,640 people
- By 2030
- 417,107 · +7.9%
- By 2040
- 476,676 · +23.3%
- By 2050
- 531,296 · +37.4%
- By 2075
- 648,303 · +67.7%
- By 2100
- 698,530 · +80.7%
Race, ethnicity, and origin ACS 2023
- Neighborhood character
- Majority White (64%)
- Race & ethnicity
- White 64% Black 16% Hispanic / Latino 15% Two or more races 9% Asian 1%
- Hispanic origin (detail)
- Mexican 4% Puerto Rican 5% Cuban 3%
- Common ancestry
- Romanian 3% Lithuanian 3% Slovak 2%
- Foreign-born
- 9% · Canada, Vietnam, Jamaica
- Languages at home
- 88% English-only · Spanish 10% French/Haitian/Cajun 1%
Political lean MEDSL · Lake
- 2024 margin
- Strong R (+24.7) · D 37.3% · R 62.0%
- 2008→2024 swing
- -11.2pp toward R · 2008: -13.5pp · 2024: -24.7pp
- All cycles
- 2024: R+24.7 2020: R+20.0 2016: R+23.1 2012: R+17.1 2008: R+13.5
Not yet ingested
- Civics
- —
Market trends
- HPI YoY
- ▼ -88.97%
- Current HPI
- 262.1766
- Rent YoY
- ▼ -0.95%
- Metro
- Orlando-Kissimmee-Sanford, FL
- State GDP YoY
- ▲ 3.28%
- F500 in state
- 36
Industry mix (Fortune 500 HQ in FL)
| Industry | F500 HQs | Revenue |
|---|---|---|
| Industrial Technology | 2 | $29B |
|
||
| Insurance | 2 | $17B |
|
||
| Retail | 1 | $60B |
|
||
| Technology Distribution | 1 | $58B |
|
||
| Homebuilding | 1 | $35B |
|
||
| Technology Manufacturing | 1 | $35B |
|
||
Price history
+62.1% since first listed5 events — show timeline
- 2026-06-08 Listed $125,000 Stellar MLS as Distributed by MLS Grid
- 2011-07-13 Sold (Public Records) $69,500 Public Records
- 2011-06-30 Sold (MLS) $69,500 Stellar MLS as Distributed by MLS Grid
- 2011-01-17 Listed $69,500 Stellar MLS as Distributed by MLS Grid
- 2002-03-14 Sold (Public Records) $77,100 Public Records
Property tax history
+32.0%/yrLatest (2025): $1,162 · +2.3% YoY. Source: county tax records.
Cash-flow waterfall
monthlySold comps — $/sqft
last 12 mo · ≤1 miLoading sold comps…