 Multi-family
12774 Market St Rd · Houston, TX
Flood risk No data
- FEMA flood zone
- —
- Chance of flooding over 30 yrs
- —
- Est. flood insurance / yr
- —
Fire risk No data
- Est. fire insurance / yr
- —
Heat risk No data
- Hot days now (above threshold)
- —
- Hot days in 30 yrs
- —
Wind risk No data
- Chance of severe wind over 30 yrs
- —
Air-quality risk No data
- Unhealthy air days now
- —
- Unhealthy air days in 30 yrs
- —
Risk factors via First Street. Map © Google.
Why this score? — see what drove the D grade
The composite is a weighted blend of 9 inputs, each scored 0–100. Each bar is that input's sub-score; the figure is the points it added to the 100-point composite (weight × sub-score).
- ARV discount +15.0/15.0
- Cash flow +10.0/30.0
- Livability +3.7/5.0
- 1% rule +3.0/10.0
- DSCR +2.9/10.0
- Schools +2.8/10.0
- Rent growth +2.3/5.0
- Condition / age +2.2/5.0
- Appreciation +0.0/10.0
$379,900
🖨 Deal sheet (PDF) 📄 Offer letter ✓ Due diligence
Multi-family units
County records classify this as Multi-Family (2-4 Unit). Listing-text estimate: 1 unit. estimate disagrees with records
Listing remarks MLS
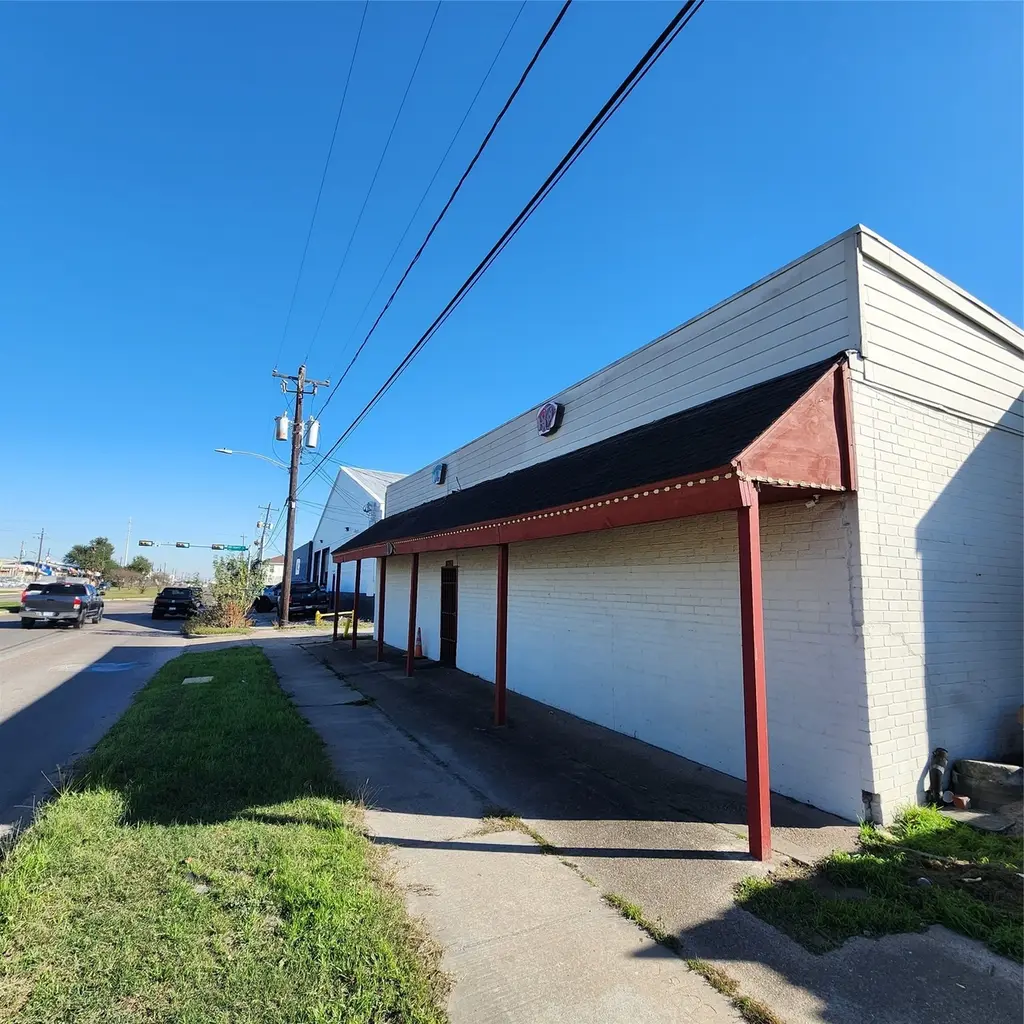
Well-located bar property at 12774 Market Street, Houston, TX 77015, positioned in an up-and-coming East Houston corridor that’s changing rapidly. The site offers strong commercial fundamentals with nearby anchored shopping centers and convenient access to major commuter routes—approximately 15 minutes to Downtown Houston. The improvements include a 3,590 SF main bar/building plus two efficiency apartments totaling 1,026 SF, for a combined 4,616 SF under roof. The 13,345 SF lot provides functional on-site footprint and flexibility for an owner-user, investor, or redevelopment-minded buyer. This is an excellent opportunity for an operator seeking a plug-and-play hospitality location, or an investor looking for a value-add property with built-in ancillary residential component (ideal for rental income, staff housing, or additional creative use—buyer to verify). The surrounding area continues to see momentum with retail, rooftops, and infill activity driving long-term upside.
Key facts
- On-site footprint
- 0.31 acre lot
- Built 1960
Tags
Neighborhood map
What this means for you Summary
Snapshot
- This is a 1-bed/1.0-bath multifamily listed at $380k. Condition is rated fair.
Deal economics
- At list price, monthly cash flow is $-227 ($-3k/yr) — negative.
- To cash-flow at today's rent, offer at most $347k (8.6% below list).
- To meet the 1% rule (rent ≥ 1% of price), the offer needs to be $304k (20.1% below list).
- Recommended offer: $304k (20.1% below list) — sets the bar for 1% rule.
- Cap rate 5.6% vs local median 3.2% in Houston — top-decile yield for the area; either an underpriced asset or a hidden risk that comps aren't pricing in. Stress-test before assuming the spread holds.
Location & tenants
- Location reads 74/100 on livability (#184 in TX, #4,771 nationally) — a middle-class / working-renter tenant base. Strengths: amenities A+, cost of living A+, housing A+; Watch: crime F.
- Galena Park ISD (suburban): math 32% / reading 33% proficiency, ranked #578 of 826 in TX (top 70%) — families likely to look elsewhere, expect single-tenant / working-renter base with shorter leases; 74% free/reduced lunch — lower-income household profile, screen leases tightly.
- Zoned schools: Woodland Acres El (math 30% / reading 39%, grade F, #1,995 of 4,322 statewide, top 50%, 443 students, 85% FRL); Woodland Acres Middle (math 35% / reading 34%, grade F, #858 of 1,662 statewide, top 54%, 603 students, 85% FRL); Galena Park H S (math 37% / reading 36%, grade F, #924 of 1,632 statewide, top 57%, 1,914 students, 87% FRL).
- Market conditions: Rents soft (-0.8%/yr); 164 active listings in the ZIP; 29,883 units permitted in Harris County in 2024 (8,621 in 5+ unit buildings).
- At $3,036/mo this rent would consume 63% of the median local household income ($58k/yr) (locally 1816% of renters already pay >50% of income on rent) — very limited rent-growth headroom before tenants either downsize or default.
Forward outlook
- Local home prices are declining (-3.0%/yr); year-one equity from $3k of loan paydown is wiped out by about $11k of value loss. Plan a longer hold.
- Harris County population projected at +47% by 2050 — long-run rental-demand tailwind backs the buy-and-hold thesis.
Negotiation context
- It's been on market 129 days — a 12% lower offer ($334k) is reasonable based on typical stale-listing flexibility.
Questions for the listing agent
- What do current leases actually rent for vs. the listed asking? Can we see a recent rent roll and the last 12 months of T-12 income?
- It's been on market 129 days. Have you received any prior offers? Is the seller open to a 20% concession, seller financing, or rate buy-down credit?
- Have any recent inspections been done? Can we get a copy of the seller's disclosures and any deferred-maintenance estimates?
- Built in 1960 — when were the roof, HVAC, electrical panel, plumbing, and water heater last replaced?
- Why hasn't it sold? Are there any deal-killer items the seller is aware of (foundation, flood, title, zoning, code violations)?
- Is there a deadline driving the sale (1031 exchange, divorce, estate, relocation)? That informs how much negotiation room exists.
- Schools are D-rated, which usually means shorter tenancies and higher turnover. Who's the typical renter profile here, and what's been the actual vacancy rate?
- Crime grade is F in this area — have there been break-ins, vandalism, or insurance claims at this property in the last 3 years? What carrier currently insures it and at what premium?
- The area grade is low — what's the realistic commute time and amenity access for the typical tenant pool here? Any planned neighborhood developments (good or bad) we should know about?
- What's the average days-on-market for RENTAL listings here right now (not sales)? A rising rental-DOM trend means longer vacancies and softer asking-rent achievability than the comps imply.
- What's the recent tenant-quality profile in this submarket — average credit score on applications, eviction rate, late-payment / NSF rate, and stable-employment percentage? A property-management company in the area should have these aggregated.
- How much new apartment / multifamily construction is in the pipeline within 1–3 miles? Heavy new supply (>2% of stock underway) typically softens rents 12–24 months out; light construction supports rent growth.
Investment metrics
- 1% rule
- 0.80% ✗
- Cap rate
- 5.58%
- Cash-on-cash
- -2.56%
- DSCR
- 0.89
- GRM
- 10.4
CMA / ARV
- ARV (median comp)
- $506,252
- List price
- $379,900
- Delta
- -24.96%
- Verdict
- UNDERPRICED
- Comps
- 3 within 2.0 mi
Projected returns pro-forma
-3.0% appreciation · 0.0% rent growth · sell at horizon
- IRR
- -24.0%
- Equity multiple
- 0.20×
- Total profit
- $-84,867
- Equity at exit
- $56,644
- IRR
- -30.6%
- Equity multiple
- -0.19×
- Total profit
- $-126,713
- Equity at exit
- $32,847
Cash invested: $106,372 (down + closing). Projections, not guarantees.
Landlord ↔ Tenant lean methodology
- Overall (STATE)
- 87 Strongly Landlord-Friendly
- State Texas
- 87 Strongly Landlord-Friendly · R+5
- County
- — inherits STATE
- City
- — inherits STATE
ZIP-level market 77015
- Home prices YoY
- -10.8%
- Rents YoY
- -0.8%
- Active inventory
- 164
- Price-to-rent
- 31.3×
Monthly cashflow live
- Estimated rent
- $3,036 high interval (Pro) →
- Mortgage (P&I)
- −$1,992
- Tax est. 1.5%
- −$475 /mo · $5,698/yr
- Insurance
- −$158
- HOA
- −$0
- Vacancy / Maint / Mgmt
- −$638
- Net cashflow
- $-227
Break-even live
Sensitivity live
| Price | -10% $36 | -5% $-96 | +0% $-227 | +5% $-358 | +10% $-490 |
|---|---|---|---|---|---|
| Rent | -10% $-467 | -5% $-347 | +0% $-227 | +5% $-107 | +10% $13 |
| Rate | -1.0pp $-36 | -0.5pp $-130 | base $-227 | +0.5pp $-325 | +1.0pp $-426 |
3-unit breakdown (identical units grouped — click to expand)
| Units | Beds | Baths | Est. rent |
|---|---|---|---|
| 3× units | 1 | 1 | $3,036 |
| #1 | 1 | 1 | $1,012 |
| #2 | 1 | 1 | $1,012 |
| #3 | 1 | 1 | $1,012 |
| Total (3 units) | $3,036 | ||
UW: 25.0% down · 7.5% · 30yr · 1.5% tax · 5.0% vac · 8.0% maint · 8.0% mgmt
Financing live
Cash to close
- Down payment
- $94,975
- Closing costs
- $11,397
- Reserves months
- —
- Total cash needed
- —
Loan-product check · same deal, 3 products live
Conventional
25% down · 7.5% · 30yr
- Down + closing
- —
- Monthly P&I
- —
- Monthly cashflow
- —
- DSCR
- —
- Eligible?
- —
Personal DTI + credit; lowest rate.
DSCR
20% down · 8.5% · 30yr
- Down + closing
- —
- Monthly P&I
- —
- Monthly cashflow
- —
- DSCR
- —
- Eligible?
- —
No personal income docs; deal must DSCR.
Hard money
10% down · 12.0% · 12mo
- Down + closing
- —
- Monthly P&I
- —
- Monthly cashflow
- —
- DSCR
- —
- Eligible?
- —
Short-term bridge; refi at stabilization.
Listing history 17 events
-
2026-06-21days on market $379,900 Active 129 DOM
-
2026-06-18days on market $379,900 Active 126 DOM
-
2026-06-17days on market $379,900 Active 125 DOM
-
2026-06-16days on market $379,900 Active 124 DOM
-
2026-06-15days on market $379,900 Active 123 DOM
-
2026-06-13days on market $379,900 Active 121 DOM
-
2026-06-13days on market $379,900 Active 120 DOM
-
2026-06-09days on market $379,900 Active 117 DOM
-
2026-06-08days on market $379,900 Active 116 DOM
-
2026-06-07days on market $379,900 Active 115 DOM
-
2026-06-04days on market $379,900 Active 112 DOM
-
2026-06-03days on market $379,900 Active 111 DOM
-
2026-06-02days on market $379,900 Active 110 DOM
-
2026-06-01days on market $379,900 Active 109 DOM
-
2026-05-31days on market $379,900 Active 108 DOM
-
2026-03-25price $379,900 1011-char remark
Show marketing remark (1011 chars)
Well-located bar property at 12774 Market Street, Houston, TX 77015, positioned in an up-and-coming East Houston corridor that’s changing rapidly. The site offers strong commercial fundamentals with nearby anchored shopping centers and convenient access to major commuter routes—approximately 15 minutes to Downtown Houston. The improvements include a 3,590 SF main bar/building plus two efficiency apartments totaling 1,026 SF, for a combined 4,616 SF under roof. The 13,345 SF lot provides functional on-site footprint and flexibility for an owner-user, investor, or redevelopment-minded buyer. This is an excellent opportunity for an operator seeking a plug-and-play hospitality location, or an investor looking for a value-add property with built-in ancillary residential component (ideal for rental income, staff housing, or additional creative use—buyer to verify). The surrounding area continues to see momentum with retail, rooftops, and infill activity driving long-term upside.
-
2026-02-12$417,500 Active 1011-char remark
Show marketing remark (1011 chars)
Well-located bar property at 12774 Market Street, Houston, TX 77015, positioned in an up-and-coming East Houston corridor that’s changing rapidly. The site offers strong commercial fundamentals with nearby anchored shopping centers and convenient access to major commuter routes—approximately 15 minutes to Downtown Houston. The improvements include a 3,590 SF main bar/building plus two efficiency apartments totaling 1,026 SF, for a combined 4,616 SF under roof. The 13,345 SF lot provides functional on-site footprint and flexibility for an owner-user, investor, or redevelopment-minded buyer. This is an excellent opportunity for an operator seeking a plug-and-play hospitality location, or an investor looking for a value-add property with built-in ancillary residential component (ideal for rental income, staff housing, or additional creative use—buyer to verify). The surrounding area continues to see momentum with retail, rooftops, and infill activity driving long-term upside.
ⓘ Source: listings_history table (triggers on properties + properties_extension) + one-shot
backfill from property_details.listing_events for pre-trigger history.
Nearby sold comps map
Loading sold comps map…
Walkable amenities ~0.75 mi
Loading nearby amenities…
Taxation est. · year 1
- Rental income
- $36,432
- − Mortgage interest
- −$21,280
- − Property taxes
- −$5,698
- − Insurance
- −$1,900
- − Repairs & maintenance
- −$2,915
- − Management
- −$2,915
- − Depreciation
- −$11,052
- Taxable loss
- −$9,327
- Est. tax savings @ 24.0%
- +$2,238
- After-tax cash flow
- $-485/yr
For passive investors: Depreciation is non-cash, so a rental often shows a tax loss while cash-flowing — sheltering income. Rental losses are passive: they offset passive income freely, and up to $25,000/yr can offset ordinary (W-2) income if you actively participate and your MAGI is under $100k (phasing out to $0 by $150k); unused losses carry forward. On sale, claimed depreciation is recaptured at up to 25%, and gains may owe capital-gains tax (a 1031 exchange can defer both). Figures are a year-1 estimate at your 24.0% rate — not tax advice; consult a CPA.
Condition & rehab AI · 12 photos
This bar property requires moderate renovations, including painting, flooring, and appliance upgrades, to improve its condition and appeal to potential buyers or renters.
Repairs flagged
- Major Appliances — Outdated and need replacement
- Major Flooring — Worn and uneven
- Major Paint — Chipped and uneven
- Major HVAC/mechanicals — No visible photos, but likely outdated
Value-add opportunities
- Both Paint — Fresh paint can improve the overall appearance and appeal
- Both Flooring — New flooring can enhance the aesthetic and functionality
- Both Appliances — Upgrading appliances can attract more customers and improve the overall experience
Renovation cost estimate screening
| Repair item | Severity | Est. cost |
|---|---|---|
| Appliances · Outdated and need replacement | Major | $15,000–50,000 |
| Flooring · Worn and uneven | Major | $15,000–50,000 |
| Paint · Chipped and uneven | Major | $15,000–50,000 |
| HVAC/mechanicals · No visible photos, but likely outdated | Major | $15,000–50,000 |
| Total estimated repair cost · 4 items | $60,000–200,000 |
Value-add ROI direction
- Both Paint — Fresh paint can improve the overall appearance and appeal ↑
- Both Flooring — New flooring can enhance the aesthetic and functionality ↑
- Both Appliances — Upgrading appliances can attract more customers and improve the overall experience ↑
ⓘ Cost ranges are severity-bucket heuristics (US national rule-of-thumb). Get contractor quotes + a written scope before underwriting a rehab budget.
Schools (NCES district)
- District
- Galena Park ISD
- NCES district ID
- 4820250
- Math proficiency
- 32% ▼ -20.00%
- Reading proficiency
- 33% ▼ -7.00%
- Median HH income
- $43,158
- Composite
- 27.62/100
- National rank
- #6927
- State rank
- #578 of 826 in TX
Livability — Houston
- Score
- 74/100
- State rank
- #184
- US rank
- #4771
Category grades
Schools grade is shown separately in the Schools card above.
Census & demographics
- Census place
- Houston, TX
- County
- Harris County · 4,702,590 people
- City population
- 3,226,434
- Metro
- Houston-The Woodlands-Sugar Land, TX
- Population (ZIP)
- 58,415
- Household income
- $57,753
- Rent vs Own
- Severe rent burden
- 1816.0
Population outlook (Harris County) Hauer SSP2
- Today (2025)
- 5,571,493 people
- By 2030
- 6,089,821 · +9.3%
- By 2040
- 7,142,806 · +28.2%
- By 2050
- 8,185,864 · +46.9%
- By 2075
- 10,574,329 · +89.8%
- By 2100
- 12,109,958 · +117.4%
Race, ethnicity, and origin ACS 2023
- Neighborhood character
- Predominantly Hispanic (77%)
- Race & ethnicity
- Hispanic / Latino 77% Two or more races 54% Black 14% White 6% Asian 1% Native American 1%
- Hispanic origin (detail)
- Mexican 60% Cuban 2%
- Foreign-born
- 33% · Canada, Vietnam
- Languages at home
- 31% English-only · Spanish 68% Vietnamese 1%
Political lean MEDSL · Harris
- 2024 margin
- Lean D (+5.5) · D 52.0% · R 46.4% · Other 1.6%
- 2008→2024 swing
- +3.9pp toward D · 2008: 1.6pp · 2024: 5.5pp
- All cycles
- 2024: D+5.5 2020: D+13.3 2016: D+12.4 2012: D+0.1 2008: D+1.6
Not yet ingested
- Civics
- —
Market trends
- HPI YoY
- ▼ -36.47%
- Current HPI
- 300.1821
- Rent YoY
- ▼ -0.83%
- Metro
- Houston-The Woodlands-Sugar Land, TX
- State GDP YoY
- ▲ 3.95%
- F500 in state
- 110
Industry mix (Fortune 500 HQ in TX)
| Industry | F500 HQs | Revenue |
|---|---|---|
| Energy | 16 | $1,198B |
|
||
| Technology | 5 | $198B |
|
||
| Engineering / Construction | 4 | $72B |
|
||
| Energy Services | 3 | $60B |
|
||
| Utilities | 3 | $41B |
|
||
| Healthcare | 2 | $330B |
|
||
Price history
-9.0% since first listed2 events — show timeline
- 2026-03-25 Price Changed $379,900 HARMLS
- 2026-02-12 Listed $417,500 HARMLS
Cash-flow waterfall
monthlySold comps — $/sqft
last 12 mo · ≤1 miLoading sold comps…