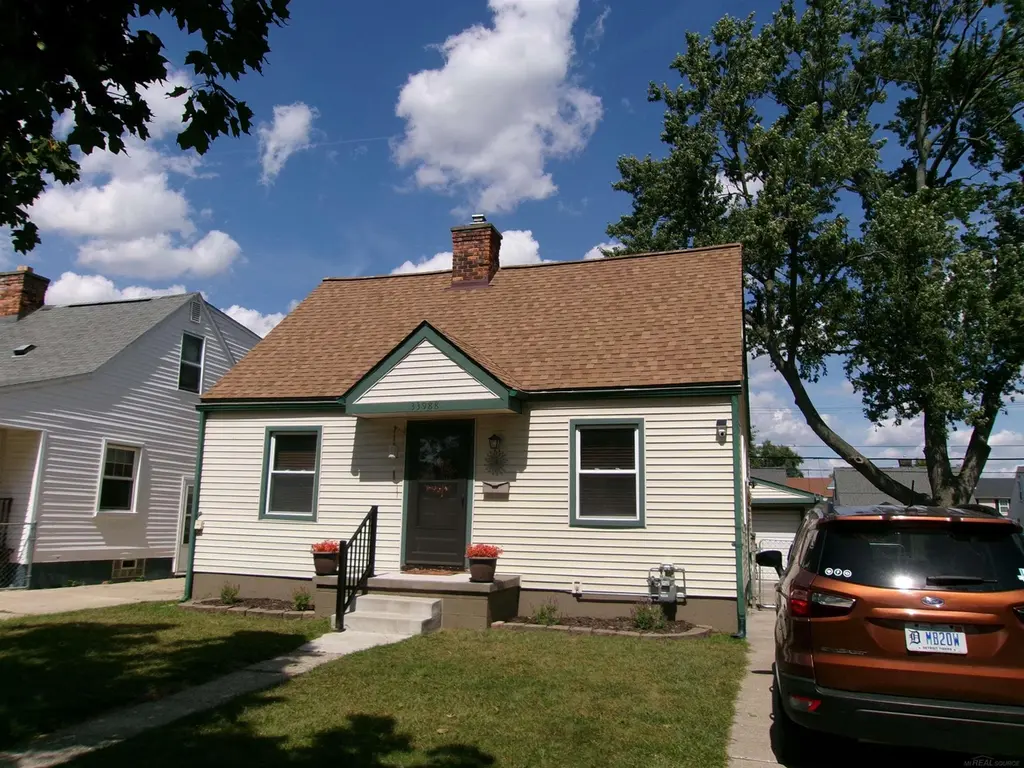
33988 Currier St · Wayne, MI
Flood risk 1/10 · Minimal
- FEMA flood zone
- X (unshaded)
- Chance of flooding over 30 yrs
- 0.0%
- Est. flood insurance / yr
- $473 – $860
Fire risk 3/10 · Minor
- Est. fire insurance / yr
- $784 – $1,456
Heat risk 3/10 · Minor
- Hot days now (above 97°F)
- 7 days/yr
- Hot days in 30 yrs
- 15 days/yr
Wind risk 2/10 · Minimal
- Chance of severe wind over 30 yrs
- —
Air-quality risk 2/10 · Minimal
- Unhealthy air days now
- 1 days/yr
- Unhealthy air days in 30 yrs
- 3 days/yr
Risk factors via First Street. Map © Google.
Why this score? — see what drove the D grade
The composite is a weighted blend of 9 inputs, each scored 0–100. Each bar is that input's sub-score; the figure is the points it added to the 100-point composite (weight × sub-score).
- Cash flow +13.9/30.0
- ARV discount +13.2/15.0
- DSCR +4.2/10.0
- Livability +3.6/5.0
- 1% rule +3.4/10.0
- Rent growth +2.5/5.0
- Condition / age +2.5/5.0
- Schools +1.6/10.0
- Appreciation +0.0/10.0
$149,900
🖨 Deal sheet 📄 Offer letter ✓ Due diligence
Listing remarks MLS
Wonderfully cared for three bedroom bungalow in Wayne. Tons of storage, a two car garage, extremely detailed home with poured basement walls make this a must see. See the walk through video at https://youtu. be/JLd8Kzy4n04?si=ATZ4253Ou0xHta3r
Key facts
- 4,792 sq ft lot
- 2 garage spots
- Built 1943
Property features AI
Finance
- HOA & community: Homeowners association present
Exterior
- Parking: Detached 2-car garage
- Utilities: Public sewer; Water available
- Home design: Single-family residence; One and one-half story
- Construction: Vinyl siding
- Exterior features: Lot approximately 40 x 120 (0.11 acre)
Interior
- Bedrooms: 4 total rooms (includes bedrooms and living spaces)
- Bathrooms: 1 full bathroom
- Heating & cooling: Forced air heating; Natural gas heating; No central cooling
- Interior features: Basement
Neighborhood map
What this means for you Summary
Snapshot
- This is a 3-bed/1.0-bath single-family listed at $150k.
Deal economics
- At list price, monthly cash flow is $17 ($201/yr) — positive.
- The deal already cash-flows at list — no discount required.
- To meet the 1% rule (rent ≥ 1% of price), the offer needs to be $126k (16.2% below list).
- Recommended offer: $126k (16.2% below list) — sets the bar for 1% rule.
Location & tenants
- Location reads 72/100 on livability (#252 in MI) — a middle-class / working-renter tenant base. Strengths: commute A+, cost of living A+, housing A+; Watch: schools F, crime F, employment D-.
- Wayne-Westland Community School District (suburban): math 11% / reading 27% proficiency, ranked #474 of 540 in MI (top 88%) — low school quality limits family demand, transient renter base, plan for 1-2y turnover.
- Market conditions: 56 active listings in the ZIP; 16 comparable units currently listed for rent nearby; rentals at typical pace (median 25d on market — plan ~3-4 weeks tenant-placement turnaround); 44% of comp listings sitting > 30 days — soft ceiling on asking rent; 2,639 units permitted in Wayne County in 2024 (1,216 in 5+ unit buildings).
Forward outlook
- Local home prices are declining (-3.0%/yr); year-one equity from $1k of loan paydown is wiped out by about $4k of value loss. Plan a longer hold.
- Wayne County population projected at -17% by 2050 — secular population decline; favor cash flow + early exit over multi-decade hold.
Negotiation context
- Only 2 days on market — expect competitive offers; lowballing is unlikely to land.
- 18 sale attempts since 25y ago with the ask held roughly flat each time — persistent listings suggest the price (not the market) is what's stuck; bring a comps-based counter.
- Current owner paid $57k; list at $150k implies a 163% gain — meaningful room to come down on a strong offer.
Risks & watch-outs
- Watch-outs: built in 1943 — expect roof / HVAC / electrical / plumbing capex.
Questions for the listing agent
- Built in 1943 — when were the roof, HVAC, electrical panel, plumbing, and water heater last replaced?
- Is there a deadline driving the sale (1031 exchange, divorce, estate, relocation)? That informs how much negotiation room exists.
- Schools are F-rated, which usually means shorter tenancies and higher turnover. Who's the typical renter profile here, and what's been the actual vacancy rate?
- Crime grade is F in this area — have there been break-ins, vandalism, or insurance claims at this property in the last 3 years? What carrier currently insures it and at what premium?
- The area grade is low — what's the realistic commute time and amenity access for the typical tenant pool here? Any planned neighborhood developments (good or bad) we should know about?
- What's the average days-on-market for RENTAL listings here right now (not sales)? A rising rental-DOM trend means longer vacancies and softer asking-rent achievability than the comps imply.
- What's the recent tenant-quality profile in this submarket — average credit score on applications, eviction rate, late-payment / NSF rate, and stable-employment percentage? A property-management company in the area should have these aggregated.
- How much new for-sale + rental construction is in the pipeline within 1–3 miles? Heavy new supply typically softens prices + rents 12–24 months out; constrained supply supports both.
Investment metrics
- 1% rule
- 0.84% ✗
- Cap rate
- 6.43%
- Cash-on-cash
- 0.48%
- DSCR
- 1.02
- GRM
- 9.9
CMA / ARV
- ARV (on-the-fly)
- $171,696
- Comps found
- 12
Show comp detail 12 sales within ~0.75 mi
| Address | Dist | Beds/Ba | Sqft | Sold | Price | $/sf | Match |
|---|---|---|---|---|---|---|---|
| 34084 Currier St | 0.06mi | 3/1.0 | 1,014 (-1%) | 4mo | $170,700 | $168 | 93 |
| 33988 Richard St | 0.16mi | 3/1.0 | 1,022 (0%) | 4mo | $180,000 | $176 | 90 |
| 34441 Phyllis St | 0.26mi | 3/1.0 | 1,040 (+2%) | 2mo | $190,000 | $183 | 84 |
| 34225 Annapolis St | 0.30mi | 3/2.0 | 1,022 (0%) | 8mo | $179,000 | $175 | 75 |
| 4521 Columbus St | 0.34mi | 3/1.0 | 980 (-4%) | 6mo | $145,000 | $148 | 72 |
| 34918 Winslow St | 0.49mi | 3/1.0 | 1,058 (+4%) | 1mo | $147,000 | $139 | 71 |
| 34415 Glover St | 0.21mi | 3/1.0 | 907 (-11%) | 7mo | $156,500 | $173 | 66 |
| 34948 Richard St | 0.46mi | 3/1.0 | 920 (-10%) | 1mo | $160,000 | $174 | 61 |
| 35451 John St | 0.72mi | 3/1.0 | 1,000 (-2%) | 8mo | $165,000 | $165 | 56 |
| 4004 Howe Rd | 0.61mi | 3/2.0 | 1,104 (+8%) | 2mo | $152,000 | $138 | 53 |
| 4052 Howe Rd | 0.58mi | 3/2.0 | 1,104 (+8%) | 3mo | $155,000 | $140 | 53 |
| 4173 Columbus St | 0.50mi | 2/1.0 (-1) | 918 (-10%) | 3mo | $110,000 | $120 | 52 |
Match score weights: distance 35% · size 25% · config 20% · recency 20%. Top-matched comps best support the ARV.
Projected returns pro-forma
-3.0% appreciation · 3.0% rent growth · sell at horizon
- IRR
- -15.6%
- Equity multiple
- 0.45×
- Total profit
- $-23,243
- Equity at exit
- $22,351
- IRR
- -7.1%
- Equity multiple
- 0.55×
- Total profit
- $-18,941
- Equity at exit
- $12,961
Cash invested: $41,972 (down + closing). Projections, not guarantees.
Landlord ↔ Tenant lean methodology
- Overall (STATE)
- 62 Landlord-Friendly
- State Michigan
- 62 Landlord-Friendly · EVEN
- County
- — inherits STATE
- City
- — inherits STATE
ZIP-level market 48184
- Active inventory
- 56
- Price-to-rent
- 9.9×
Monthly cashflow live
- Estimated rent
- $1,257 high interval (Pro) →
- Mortgage (P&I)
- −$786
- Tax from tax record
- −$127 /mo · $1,529/yr
- Insurance
- −$62
- HOA
- −$0
- Vacancy / Maint / Mgmt
- −$264
- Net cashflow
- $17
Break-even live
UW: 25.0% down · 7.5% · 30yr · 1.5% tax · 5.0% vac · 8.0% maint · 8.0% mgmt
Financing live
Cash to close
- Down payment
- $37,475
- Closing costs
- $4,497
- Reserves months
- —
- Total cash needed
- —
Loan-product check · same deal, 3 products live
Conventional
25% down · 7.5% · 30yr
- Down + closing
- —
- Monthly P&I
- —
- Monthly cashflow
- —
- DSCR
- —
- Eligible?
- —
Personal DTI + credit; lowest rate.
DSCR
20% down · 8.5% · 30yr
- Down + closing
- —
- Monthly P&I
- —
- Monthly cashflow
- —
- DSCR
- —
- Eligible?
- —
No personal income docs; deal must DSCR.
Hard money
10% down · 12.0% · 12mo
- Down + closing
- —
- Monthly P&I
- —
- Monthly cashflow
- —
- DSCR
- —
- Eligible?
- —
Short-term bridge; refi at stabilization.
Rent comps 16 comps
| Address | Beds | Baths | Sqft | Rent | $/sqft | DOM | Units | Dist |
|---|---|---|---|---|---|---|---|---|
| 5672 Howe Rd Unit 15 Wayne, MI | 2.0 | 1.0 | 700 | $850 | $1.21 | 18d | 1 | 0.16mi |
| 4924 Howe Rd Wayne, MI | 3.0 | 1.0 | 1022 | $1,300 | $1.27 | 17d | 1 | 0.17mi |
| 34510 Van Born Rd Wayne, MI | 2.0 | 1.0 | 990 | $1,325 | $1.34 | 15d | 1 | 0.30mi |
| 35390 Van Born Rd #103 Wayne, MI | 2.0 | 1.0 | 925 | $1,100 | $1.19 | 44d | 1 | 0.63mi |
| 4332 Biddle St Wayne, MI | 3.0 | 2.0 | 1176 | $1,525 | $1.30 | 44d | 1 | 0.70mi |
| 33095 Forest St Wayne, MI | 1.0–2.0 | 1.0 | 815 | $1,142 | $1.40 | 2d | 5 | 0.70mi |
| 34639 Brush St Wayne, MI | 2.0 | 1.0 | 780 | $1,200 | $1.54 | 44d | 1 | 0.72mi |
| 3741 S Wayne Rd Wayne, MI | 2.0 | 1.5 | 1114 | $1,500 | $1.35 | 2d | 1 | 0.88mi |
| 34420 Sims St Unit 14 Wayne, MI | 2.0 | 1.0 | 800 | $900 | $1.12 | 44d | 1 | 0.89mi |
| 34420 Sims St Unit 11 Wayne, MI | 2.0 | 1.0 | 800 | $849 | $1.06 | 5d | 1 | 0.89mi |
| 5228 Fletcher St Wayne, MI | 3.0 | 1.0 | 900 | $1,750 | $1.94 | 2d | 1 | 0.96mi |
| 35505 E Michigan Ave Unit 1 Wayne, MI | 2.0 | 1.0 | 780 | $775 | $0.99 | 44d | 1 | 1.00mi |
| 35700 E Michigan Ave Wayne, MI | 2.0 | 1.0 | 701 | $1,060 | $1.51 | 5d | 6 | 1.13mi |
| 33000 Parkhill St Wayne, MI | 1.0–2.0 | 1.0–1.5 | 800 | $1,240 | $1.55 | 24d | 1 | 1.29mi |
| 34630 Glenwood Rd Westland, MI | 2.0 | 1.0 | 710 | $1,150 | $1.62 | 44d | 1 | 1.36mi |
| 34039 Cambria Ct Westland, MI | 2.0 | 1.0 | 836 | $1,395 | $1.67 | 44d | 1 | 1.44mi |
Listing history 37 events
-
2026-04-29status Pending
Show marketing remark (242 chars)
Wonderfully cared for three bedroom bungalow in Wayne. Tons of storage, a two car garage, extremely detailed home with poured basement walls make this a must see. See the walk through video at https://youtu. be/JLd8Kzy4n04?si=ATZ4253Ou0xHta3r
-
2026-04-29status Pending 242-char remark
Show marketing remark (242 chars)
Wonderfully cared for three bedroom bungalow in Wayne. Tons of storage, a two car garage, extremely detailed home with poured basement walls make this a must see. See the walk through video at https://youtu. be/JLd8Kzy4n04?si=ATZ4253Ou0xHta3r
-
2026-04-27$149,900 Active
Show marketing remark (242 chars)
Wonderfully cared for three bedroom bungalow in Wayne. Tons of storage, a two car garage, extremely detailed home with poured basement walls make this a must see. See the walk through video at https://youtu. be/JLd8Kzy4n04?si=ATZ4253Ou0xHta3r
-
2026-04-27$149,900 Active 242-char remark
Show marketing remark (242 chars)
Wonderfully cared for three bedroom bungalow in Wayne. Tons of storage, a two car garage, extremely detailed home with poured basement walls make this a must see. See the walk through video at https://youtu. be/JLd8Kzy4n04?si=ATZ4253Ou0xHta3r
-
2008-09-30soldstatus $57,000 222-char remark
Show marketing remark (222 chars)
DON'T MISS OUT ON THIS ONE! GREAT PRICE! BANK OWNED, AS IS. BUYER TO SIGN ACR WITH CITY FOR ANY/ALL REPAIRS NEEDED FOR REQUIRED CERT OF OCC. ALL DATA DEEMED ACCURATE, NOT GUARANTEED, BUYER, BUYER'S AGENT TO VERIFY. AS IS.
-
2008-05-07$59,900 222-char remark
Show marketing remark (222 chars)
DON'T MISS OUT ON THIS ONE! GREAT PRICE! BANK OWNED, AS IS. BUYER TO SIGN ACR WITH CITY FOR ANY/ALL REPAIRS NEEDED FOR REQUIRED CERT OF OCC. ALL DATA DEEMED ACCURATE, NOT GUARANTEED, BUYER, BUYER'S AGENT TO VERIFY. AS IS.
-
2008-05-05historical
-
2008-04-08$59,900
-
2008-04-04historical
-
2008-02-28historical
-
2008-02-28historical
-
2007-12-13$69,900
-
2007-12-13historical
-
2007-10-31historical
-
2007-10-31historical
-
2007-10-29$99,900
-
2007-10-29$99,900
-
2007-06-18$99,900
-
2007-06-18$99,900
-
2007-06-18$99,900
-
2006-07-03historical
-
2006-02-03$119,900
-
2006-02-03historical
-
2005-06-29$119,900
-
2005-06-28historical
-
2005-06-09$124,900
-
2005-06-09historical
-
2005-05-26historical
-
2005-05-25$129,900
-
2005-05-15$129,900
-
2003-02-14historical
-
2003-01-07$119,900
-
2002-06-12soldstatus $72,900
-
2002-02-06soldstatus $729,000
-
2001-11-05$79,900
-
2001-07-26historical
-
2001-07-09$89,900
ⓘ Source: listings_history table (triggers on properties + properties_extension) + one-shot
backfill from property_details.listing_events for pre-trigger history.
Tax reassessment forecast MI · Partial reset (capped growth)
- Current annual tax
- $1,529 · $127/mo
- Projected year-2 tax
- $1,919 · $160/mo
- Expected delta
- +$390/yr (+$32/mo · 25.5%)
ⓘ Screening estimate from a state-policy table — verify with the county assessor before closing.
Climate risk First Street
- Flood 1/10 Low FEMA zone X (unshaded) · 0% chance over 30 yrs
- Wildfire 3/10 Moderate
- Heat 3/10 Moderate 7 d/yr ≥97°F today · 15 d/yr by 30 yrs out
- Wind 2/10 Low
- Air quality 2/10 Low 1 unhealthy d/yr today · 3 by 30 yrs out
Nearby sold comps map
Loading sold comps map…
Walkable amenities ~0.75 mi
Loading nearby amenities…
Taxation est. · year 1
- Rental income
- $15,078
- − Mortgage interest
- −$8,397
- − Property taxes
- −$1,529
- − Insurance
- −$750
- − Repairs & maintenance
- −$1,206
- − Management
- −$1,206
- − Depreciation
- −$4,361
- Taxable loss
- −$2,370
- Est. tax savings @ 24.0%
- +$569
- After-tax cash flow
- $769/yr
For passive investors: Depreciation is non-cash, so a rental often shows a tax loss while cash-flowing — sheltering income. Rental losses are passive: they offset passive income freely, and up to $25,000/yr can offset ordinary (W-2) income if you actively participate and your MAGI is under $100k (phasing out to $0 by $150k); unused losses carry forward. On sale, claimed depreciation is recaptured at up to 25%, and gains may owe capital-gains tax (a 1031 exchange can defer both). Figures are a year-1 estimate at your 24.0% rate — not tax advice; consult a CPA.
Schools (NCES district)
- District
- Wayne-Westland Community School District
- NCES district ID
- 2600015
- Math proficiency
- 11% ▼ -6.00%
- Reading proficiency
- 27% ▼ -2.00%
- Median HH income
- $43,524
- Composite
- 16.4/100
- National rank
- #9195
- State rank
- #474 of 540 in MI
Livability — Wayne
- Score
- 72/100
- State rank
- #252
- US rank
- #6284
Category grades
Schools grade is shown separately in the Schools card above.
Census & demographics
- Census place
- Wayne, MI
- County
- Wayne County · 1,562,939 people
- City population
- 17,348
- Metro
- Detroit-Warren-Dearborn, MI
- Population (ZIP)
- 17,348
- Household income
- $59,171
- Rent vs Own
- Severe rent burden
- 720.0
Population outlook (Wayne County) Hauer SSP2
- Today (2025)
- 1,675,273 people
- By 2030
- 1,620,300 · -3.3%
- By 2040
- 1,502,341 · -10.3%
- By 2050
- 1,384,039 · -17.4%
- By 2075
- 1,124,592 · -32.9%
- By 2100
- 881,193 · -47.4%
Race, ethnicity, and origin ACS 2023
- Neighborhood character
- Diverse neighborhood (Simpson 0.56)
- Race & ethnicity
- White 61% Black 25% Two or more races 7% Hispanic / Latino 5% Asian 2% Native American 1%
- Hispanic origin (detail)
- Mexican 4% Puerto Rican 1%
- Common ancestry
- Romanian 7% Lithuanian 3% Italian 2%
- Foreign-born
- 6% · Canada, South Korea
- Languages at home
- 92% English-only · Spanish 3% Other Indo-European 1% French/Haitian/Cajun 1%
Political lean MEDSL · Wayne
- 2024 margin
- Strong D (+29.0) · D 62.7% · R 33.7% · Other 3.6%
- 2008→2024 swing
- -20.5pp toward R · 2008: 49.5pp · 2024: 29.0pp
- All cycles
- 2024: D+29.0 2020: D+38.1 2016: D+37.3 2012: D+46.9 2008: D+49.5
Not yet ingested
- Civics
- —
Market trends
- HPI YoY
- ▼ -171.12%
- Current HPI
- 217.8548
- Rent YoY
- —
- Metro
- Detroit-Warren-Dearborn, MI
- State GDP YoY
- ▲ 1.37%
- F500 in state
- 28
Industry mix (Fortune 500 HQ in MI)
| Industry | F500 HQs | Revenue |
|---|---|---|
| Automotive Parts | 3 | $48B |
|
||
| Automotive | 2 | $372B |
|
||
| Chemicals | 1 | $45B |
|
||
| Automotive Retail | 1 | $29B |
|
||
| Healthcare / Medical Devices | 1 | $23B |
|
||
| Automotive Technology | 1 | $20B |
|
||
Price history
+66.7% since first listed37 events — show timeline
- 2026-04-29 Pending — REALCOMP
- 2026-04-29 Pending — MiRealSource-MiMLS
- 2026-04-27 Listed $149,900 REALCOMP
- 2026-04-27 Listed $149,900 MiRealSource-MiMLS
- 2008-09-30 Sold (MLS) $57,000 REALCOMP
- 2008-05-07 Listed $59,900 REALCOMP
- 2008-05-05 Listing Removed — REALCOMP
- 2008-04-08 Listed $59,900 REALCOMP
- 2008-04-04 Listing Removed — REALCOMP
- 2008-02-28 Listing Removed — MiRealSource-MiMLS
- 2008-02-28 Listing Removed — REALCOMP
- 2007-12-13 Listing Removed — REALCOMP
- 2007-12-13 Listed $69,900 REALCOMP
- 2007-10-31 Listing Removed — REALCOMP
- 2007-10-31 Listing Removed — MiRealSource-MiMLS
- 2007-10-29 Listed $99,900 MiRealSource-MiMLS
- 2007-10-29 Listed $99,900 REALCOMP
- 2007-06-18 Listed $99,900 REALCOMP
- 2007-06-18 Listed $99,900 MiRealSource-MiMLS
- 2007-06-18 Listed $99,900 REALCOMP
- 2006-07-03 Listing Removed — REALCOMP
- 2006-02-03 Listing Removed — REALCOMP
- 2006-02-03 Listed $119,900 REALCOMP
- 2005-06-29 Listed $119,900 REALCOMP
- 2005-06-28 Listing Removed — REALCOMP
- 2005-06-09 Listing Removed — REALCOMP
- 2005-06-09 Listed $124,900 REALCOMP
- 2005-05-26 Listing Removed — REALCOMP
- 2005-05-25 Listed $129,900 REALCOMP
- 2005-05-15 Listed $129,900 REALCOMP
- 2003-02-14 Listing Removed — REALCOMP
- 2003-01-07 Listed $119,900 REALCOMP
- 2002-06-12 Sold (Public Records) $72,900 Public Records
- 2002-02-06 Sold (MLS) $729,000 REALCOMP
- 2001-11-05 Listed $79,900 REALCOMP
- 2001-07-26 Listing Removed — REALCOMP
- 2001-07-09 Listed $89,900 REALCOMP
Property tax history
+0.6%/yrLatest (2025): $1,529 · -16.1% YoY. Source: county tax records.
Cash-flow waterfall
monthlySold comps — $/sqft
last 12 mo · ≤1 miLoading sold comps…