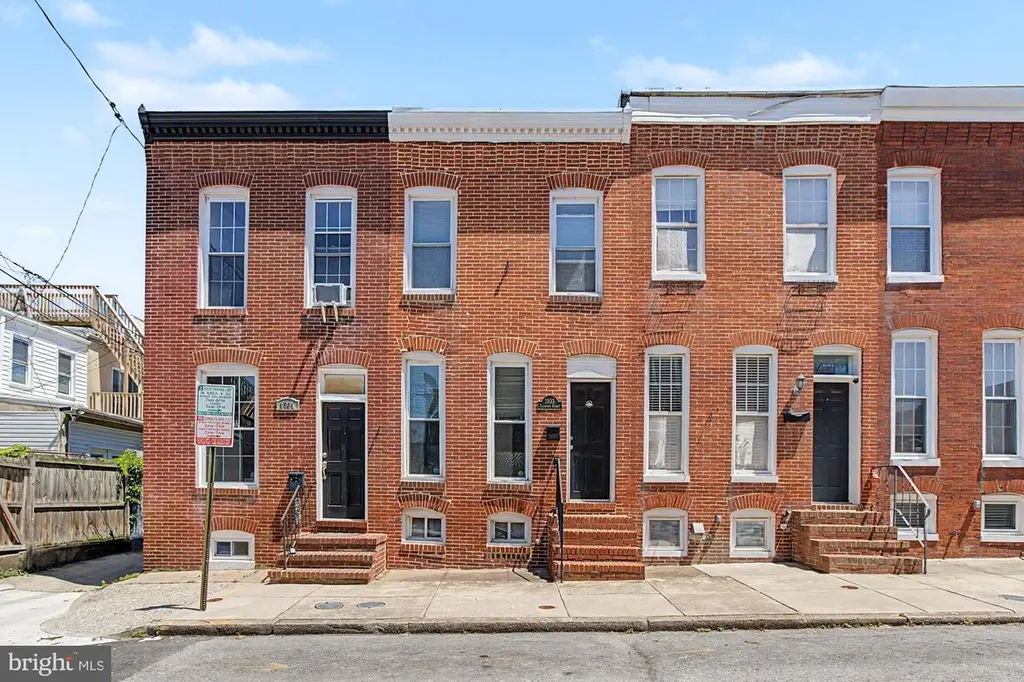
1303 Clarkson St · Baltimore, MD
Flood risk 1/10 · Minimal
- FEMA flood zone
- X (unshaded)
- Chance of flooding over 30 yrs
- 0.0%
- Est. flood insurance / yr
- $473 – $860
Fire risk 1/10 · Minimal
- Est. fire insurance / yr
- $755 – $1,403
Heat risk 8/10 · Major
- Hot days now (above 102°F)
- 7 days/yr
- Hot days in 30 yrs
- 15 days/yr
Wind risk 6/10 · Moderate
- Chance of severe wind over 30 yrs
- 27.0%
Air-quality risk 4/10 · Minor
- Unhealthy air days now
- 6 days/yr
- Unhealthy air days in 30 yrs
- 7 days/yr
Risk factors via First Street. Map © Google.
Why this score? — see what drove the D grade
The composite is a weighted blend of 9 inputs, each scored 0–100. Each bar is that input's sub-score; the figure is the points it added to the 100-point composite (weight × sub-score).
- ARV discount +13.4/15.0
- Cash flow +12.2/30.0
- 1% rule +3.8/10.0
- Livability +3.8/5.0
- DSCR +3.6/10.0
- Condition / age +2.5/5.0
- Rent growth +2.2/5.0
- Schools +1.0/10.0
- Appreciation +0.0/10.0
$279,900
🖨 Deal sheet 📄 Offer letter ✓ Due diligence
Listing remarks MLS
Move-in ready brick Fed Hill home w PARKING PAD for $225k!!! New wd floors in Liv & Din. New carpet on 2nd fl. New granite and st stl appliances in terrific open kit. Great space w/ potential for 3 br's (1 is walk thru to the bath). 1st fl half ba & laundry. Central air. Recessed lights. Sec system. Easy walk to stadiums and everything Fed Hill. Super quiet non-thru street. New front door on order.
Key facts
- Parking
- Built 1900
- Listed 34 days
Property features AI
Finance
- Other: Total below-grade area: 546 (unfinished); Above-grade finished area: 1,196
- Financial info: Ground rent payment of $54 semi-annually
Exterior
- Parking: Off-street parking (1 space); Total of 1 garage/parking space
- Utilities: Public water; Public sewer; Electric cooling; Natural gas heating and hot water
- Home design: Interior townhouse/rowhouse; Brick construction
- Construction: Brick construction; Slab foundation; Above-grade and below-grade structures; Unfinished below-grade area
- Exterior features: In city limits; Ground rent exists (semi-annual payment)
Interior
- Kitchen: Dishwasher; Gas range/oven; Refrigerator; Stainless steel appliances; Eat-in kitchen
- Bedrooms: Three bedrooms on the first upper level
- Flooring: Wood floors; Carpet
- Bathrooms: One full bath on the upper level; One half bath on the main level
- Heating & cooling: Forced air heating (natural gas); Central air conditioning (electric)
- Interior features: Carpet; Ceiling fan(s); Stall shower; Combination kitchen/dining; Dining area; Eat-in kitchen; Recessed lighting; Upgraded countertops; Wood floors; Unfinished basement
- Laundry & utility: Washer; Dryer; Natural gas hot water
Neighborhood map
What this means for you Summary
Snapshot
- This is a 3-bed/1.5-bath townhouse listed at $280k.
Deal economics
- At list price, monthly cash flow is $-56 ($-677/yr) — negative.
- To cash-flow at today's rent, offer at most $270k (3.6% below list).
- To meet the 1% rule (rent ≥ 1% of price), the offer needs to be $247k (11.7% below list).
- Recommended offer: $247k (11.7% below list) — sets the bar for 1% rule.
Location & tenants
- Location reads 76/100 on livability (#90 in MD, #3,396 nationally) — a middle-class / working-renter tenant base. Strengths: amenities A+, commute A+, housing A+; Watch: schools D, crime F.
- Baltimore City Public Schools (urban): math 7% / reading 16% proficiency, ranked #24 of 24 in MD (top 100%) — low school quality limits family demand, transient renter base, plan for 1-2y turnover; 79% free/reduced lunch — lower-income household profile, screen leases tightly.
- Market conditions: Rents soft (-1.0%/yr); 362 active listings in the ZIP; 40 comparable units currently listed for rent nearby; rentals at typical pace (median 24d on market — plan ~3-4 weeks tenant-placement turnaround); solid renter incomes; 1,273 units permitted in Baltimore city in 2024 (1,104 in 5+ unit buildings).
- This rent runs 32% of the median local income ($92k/yr) — at the standard rent-burdened threshold; future hikes will face affordability resistance.
Forward outlook
- Local home prices are declining (-3.0%/yr); year-one equity from $2k of loan paydown is wiped out by about $8k of value loss. Plan a longer hold.
- Baltimore County population projected to shrink 4% by 2050 — rents likely to lag national; underwrite the cash flow, not the appreciation.
Negotiation context
- It's been on market 35 days — a 3% lower offer ($272k) is reasonable based on typical stale-listing flexibility.
- 8 sale attempts since 29y ago with the ask held roughly flat each time — persistent listings suggest the price (not the market) is what's stuck; bring a comps-based counter.
- Current owner paid $225k; 24% above their basis — modest negotiation headroom, anchor on the comps not their cost.
Risks & watch-outs
- Watch-outs: built in 1900 — expect roof / HVAC / electrical / plumbing capex.
- Climate carrying-cost: major wind risk, 27% chance of damaging wind over 30y; extreme-heat days projected 7→15/yr by 2055 (HVAC capex compounding) — expect insurance premiums to compound above CPI over the hold.
Questions for the listing agent
- What do current leases actually rent for vs. the listed asking? Can we see a recent rent roll and the last 12 months of T-12 income?
- It's been on market 35 days. Have you received any prior offers? Is the seller open to a 12% concession, seller financing, or rate buy-down credit?
- Built in 1900 — when were the roof, HVAC, electrical panel, plumbing, and water heater last replaced?
- Is there a deadline driving the sale (1031 exchange, divorce, estate, relocation)? That informs how much negotiation room exists.
- Schools are D-rated, which usually means shorter tenancies and higher turnover. Who's the typical renter profile here, and what's been the actual vacancy rate?
- Crime grade is F in this area — have there been break-ins, vandalism, or insurance claims at this property in the last 3 years? What carrier currently insures it and at what premium?
- The area grade is low — what's the realistic commute time and amenity access for the typical tenant pool here? Any planned neighborhood developments (good or bad) we should know about?
- What's the average days-on-market for RENTAL listings here right now (not sales)? A rising rental-DOM trend means longer vacancies and softer asking-rent achievability than the comps imply.
- What's the recent tenant-quality profile in this submarket — average credit score on applications, eviction rate, late-payment / NSF rate, and stable-employment percentage? A property-management company in the area should have these aggregated.
- How much new for-sale + rental construction is in the pipeline within 1–3 miles? Heavy new supply typically softens prices + rents 12–24 months out; constrained supply supports both.
Investment metrics
- 1% rule
- 0.88% ✗
- Cap rate
- 6.05%
- Cash-on-cash
- -0.86%
- DSCR
- 0.96
- GRM
- 9.4
CMA / ARV
- ARV (median comp)
- $322,269
- List price
- $279,900
- Delta
- -13.15%
- Verdict
- UNDERPRICED
- Comps
- 20 within 1.0 mi
Show comp detail 12 sales within ~0.75 mi
| Address | Dist | Beds/Ba | Sqft | Sold | Price | $/sf | Match |
|---|---|---|---|---|---|---|---|
| 3 East Ostend St | 0.11mi | 2/1.5 (-1) | 1,148 (-4%) | 2mo | $275,000 | $240 | 82 |
| 1433 Patapsco St | 0.16mi | 2/2.0 (-1) | 1,305 (+9%) | 1mo | $285,000 | $218 | 69 |
| 1416 Jackson St | 0.56mi | 2/2.0 (-1) | 1,208 (+1%) | 1mo | $191,000 | $158 | 64 |
| 30 E Wheeling St | 0.33mi | 2/2.5 (-1) | 1,104 (-8%) | 1mo | $200,000 | $181 | 62 |
| 1405 Covington St | 0.50mi | 2/1.0 (-1) | 1,124 (-6%) | 0mo | $315,000 | $280 | 59 |
| 29 E Henrietta St | 0.34mi | 2/1.0 (-1) | 1,067 (-11%) | 1mo | $250,000 | $234 | 58 |
| 109 W Montgomery St | 0.43mi | 2/2.5 (-1) | 1,300 (+9%) | 0mo | $390,000 | $300 | 56 |
| 418 S Hanover St | 0.65mi | 2/1.5 (-1) | 1,260 (+5%) | 1mo | $340,000 | $270 | 55 |
| 1808 Light St | 0.41mi | 2/2.5 (-1) | 1,342 (+12%) | 1mo | $330,000 | $246 | 51 |
| 444 E Clement St | 0.48mi | 2/1.5 (-1) | 1,356 (+13%) | 1mo | $330,000 | $243 | 50 |
| 141 W Montgomery St | 0.41mi | 2/2.5 (-1) | 1,368 (+14%) | 0mo | $364,080 | $266 | 48 |
| 100 Harborview Dr #513 | 0.67mi | 2/2.0 (-1) | 1,355 (+13%) | 1mo | $235,000 | $173 | 38 |
Match score weights: distance 35% · size 25% · config 20% · recency 20%. Top-matched comps best support the ARV.
Projected returns pro-forma
-3.0% appreciation · 0.0% rent growth · sell at horizon
- IRR
- -21.2%
- Equity multiple
- 0.28×
- Total profit
- $-56,103
- Equity at exit
- $41,734
- IRR
- -24.4%
- Equity multiple
- -0.04×
- Total profit
- $-81,119
- Equity at exit
- $24,201
Cash invested: $78,372 (down + closing). Projections, not guarantees.
Landlord ↔ Tenant lean methodology
- Overall (CITY)
- 12 Strongly Tenant-Friendly
- State Maryland
- 27 Tenant-Leaning · D+14
- County
- — inherits STATE
- City Baltimore
- 12 Strongly Tenant-Friendly · D+58
ZIP-level market 21230
- Rents YoY
- -1.0%
- Active inventory
- 362
- Price-to-rent
- 9.4×
Monthly cashflow live
- Estimated rent
- $2,470 high interval (Pro) →
- Mortgage (P&I)
- −$1,468
- Tax from tax record
- −$423 /mo · $5,081/yr
- Insurance
- −$117
- HOA
- −$0
- Vacancy / Maint / Mgmt
- −$519
- Net cashflow
- $-56
Break-even live
UW: 25.0% down · 7.5% · 30yr · 1.5% tax · 5.0% vac · 8.0% maint · 8.0% mgmt
Financing live
Cash to close
- Down payment
- $69,975
- Closing costs
- $8,397
- Reserves months
- —
- Total cash needed
- —
Loan-product check · same deal, 3 products live
Conventional
25% down · 7.5% · 30yr
- Down + closing
- —
- Monthly P&I
- —
- Monthly cashflow
- —
- DSCR
- —
- Eligible?
- —
Personal DTI + credit; lowest rate.
DSCR
20% down · 8.5% · 30yr
- Down + closing
- —
- Monthly P&I
- —
- Monthly cashflow
- —
- DSCR
- —
- Eligible?
- —
No personal income docs; deal must DSCR.
Hard money
10% down · 12.0% · 12mo
- Down + closing
- —
- Monthly P&I
- —
- Monthly cashflow
- —
- DSCR
- —
- Eligible?
- —
Short-term bridge; refi at stabilization.
Rent comps 40 comps
| Address | Beds | Baths | Sqft | Rent | $/sqft | DOM | Units | Dist |
|---|---|---|---|---|---|---|---|---|
| 1312 S Hanover St Apt 3 Baltimore, MD | 2.0 | 1.0 | 750 | $2,200 | $2.93 | 43d | 1 | 0.03mi |
| 126 Burnett St Baltimore, MD | 2.0 | 2.5 | 984 | $2,200 | $2.24 | 24d | 1 | 0.05mi |
| 1403 Race St Baltimore, MD | 3.0 | 3.0 | 1008 | $2,200 | $2.18 | 43d | 1 | 0.06mi |
| 1516 Clarkson St Baltimore, MD | 2.0 | 1.5 | 1050 | $1,795 | $1.71 | 24d | 1 | 0.13mi |
| 1201 S Charles St Baltimore, MD | 2.0–3.0 | 2.0 | 1341 | $2,350 | $1.75 | 4d | 4 | 0.15mi |
| 1503 S Charles St Unit 2 Baltimore, MD | 2.0 | 2.0 | 1100 | $2,375 | $2.16 | 43d | 1 | 0.16mi |
| 1303 Patapsco St Baltimore, MD | 2.0 | 2.5 | 1200 | $3,000 | $2.50 | 3d | 1 | 0.16mi |
| 101 W Cross St Baltimore, MD | 2.0 | 1.0–2.0 | 937 | $3,332 | $3.55 | 2d | 23 | 0.16mi |
| 1601 S Hanover St Apt 1R Baltimore, MD | 2.0 | 1.0 | 900 | $1,600 | $1.78 | 2d | 1 | 0.19mi |
| 1608 S Hanover St Baltimore, MD | 3.0 | 3.5 | 1346 | $3,000 | $2.23 | 18d | 1 | 0.19mi |
| 8 E Randall St Baltimore, MD | 2.0 | 2.5 | 1148 | $2,600 | $2.26 | 4d | 1 | 0.20mi |
| 1021 S Hanover St Baltimore, MD | 2.0 | 2.5 | 1300 | $2,800 | $2.15 | 24d | 1 | 0.23mi |
| 1211 Light St Baltimore, MD | 2.0 | 2.0 | 921 | $2,172 | $2.36 | 24d | 1 | 0.25mi |
| 1631 S Charles St Baltimore, MD | 2.0 | 3.0 | 1460 | $2,607 | $1.79 | 4d | 1 | 0.26mi |
| 118 E Gittings St Baltimore, MD | 3.0 | 2.5 | 1148 | $2,600 | $2.26 | 24d | 1 | 0.26mi |
| 110 Birckhead St Baltimore, MD | 2.0 | 2.5 | 1220 | $2,750 | $2.25 | 43d | 1 | 0.26mi |
| 1026 Patapsco St Baltimore, MD | 2.0 | 2.0 | 1008 | $2,100 | $2.08 | 24d | 1 | 0.27mi |
| 111 W Heath St Baltimore, MD | 2.0 | 1.0–2.5 | 1263 | $2,850 | $2.26 | 3d | 7 | 0.27mi |
| 1718 S Hanover St Baltimore, MD | 2.0 | 2.5 | 1296 | $2,700 | $2.08 | 24d | 1 | 0.27mi |
| 14 Poultney St Baltimore, MD | 3.0 | 2.5 | 1344 | $2,500 | $1.86 | 12d | 1 | 0.28mi |
| 1600 Light St Unit C Baltimore, MD | 3.0 | 2.0 | 1500 | $1,800 | $1.20 | 11d | 1 | 0.28mi |
| 1103 Light St Unit B Baltimore, MD | 2.0 | 2.0 | 1295 | $1,845 | $1.42 | 24d | 1 | 0.29mi |
| 1103 Light St Unit B Baltimore, MD | 2.0 | 2.0 | 1295 | $1,845 | $1.42 | 43d | 1 | 0.29mi |
| 1746 S Hanover St Baltimore, MD | 3.0 | 2.0 | 1490 | $2,700 | $1.81 | 11d | 1 | 0.30mi |
| 1703 Patapsco St Baltimore, MD | 4.0 | 4.5 | 960 | $3,000 | $3.12 | 24d | 1 | 0.31mi |
| 49 E Heath St Baltimore, MD | 2.0 | 1.5 | 858 | $1,800 | $2.10 | 11d | 1 | 0.31mi |
| 910 S Charles St Unit B Baltimore, MD | 2.0 | 1.0 | 700 | $1,700 | $2.43 | 18d | 1 | 0.33mi |
| 1710 Marshall St Baltimore, MD | 2.0 | 1.0 | 1110 | $2,500 | $2.25 | 43d | 1 | 0.33mi |
| 1111 Light St Baltimore, MD | 2.0 | 1.0–2.0 | 982 | $2,449 | $2.49 | 4d | 13 | 0.33mi |
| 1702 Light St Unit 302 Baltimore, MD | 2.0 | 2.0 | 735 | $2,300 | $3.13 | 18d | 1 | 0.34mi |
| 1290 Battery Ave Baltimore, MD | 2.0 | 2.5 | 968 | $2,900 | $3.00 | 24d | 1 | 0.34mi |
| 1001 Light St Fl -3 Baltimore, MD | 2.0 | 1.0 | 861 | $1,350 | $1.57 | 24d | 1 | 0.35mi |
| 02 W Henrietta St Unit B Baltimore, MD | 3.0 | 2.0 | 1500 | $2,000 | $1.33 | 18d | 1 | 0.36mi |
| 1815 S Charles St Baltimore, MD | 2.0 | 2.0 | 1208 | $2,100 | $1.74 | 43d | 1 | 0.36mi |
| 1839 S Charles St Baltimore, MD | 3.0 | 2.5 | 1238 | $2,600 | $2.10 | 43d | 1 | 0.39mi |
| 1900 S Hanover St Baltimore, MD | 3.0 | 1.0–2.0 | 875 | $3,932 | $4.49 | 2d | 66 | 0.39mi |
| 724 S Hanover St Baltimore, MD | 3.0 | 2.5 | 1351 | $2,895 | $2.14 | 43d | 1 | 0.42mi |
| 1807 Westphal Pl Baltimore, MD | 2.0 | 2.5 | 1378 | $2,500 | $1.81 | 4d | 1 | 0.43mi |
| 1444 Henry St Baltimore, MD | 2.0 | 2.5 | 1248 | $2,950 | $2.36 | 15d | 1 | 0.44mi |
| 301 Warren Ave Baltimore, MD | 1.0–3.0 | 1.0–2.5 | 1533 | $3,865 | $2.52 | 2d | 9 | 0.47mi |
Listing history 40 events
-
2026-06-18days on market $279,900 Active 35 DOM
-
2026-06-17days on market $279,900 Active 34 DOM
-
2026-06-16days on market $279,900 Active 33 DOM
-
2026-06-15days on market $279,900 Active 32 DOM
-
2026-06-13days on market $279,900 Active 30 DOM
-
2026-06-09days on market $279,900 Active 26 DOM
-
2026-06-08days on market $279,900 Active 25 DOM
-
2026-06-07days on market $279,900 Active 24 DOM
-
2026-06-04days on market $279,900 Active 21 DOM
-
2026-06-03pricedays on market $279,900 Active 20 DOM
-
2026-06-02days on market $289,900 Active 19 DOM
-
2026-06-01days on market $289,900 Active 18 DOM
-
2026-05-31days on market $289,900 Active 17 DOM
-
2026-05-15$289,900 Active 938-char remark
-
2026-05-13historical $289,900 938-char remark
-
2016-08-23soldstatus $225,000
-
2016-08-19soldstatus $225,000 Sold 413-char remark
Show marketing remark (413 chars)
Move-in ready brick Fed Hill home w PARKING PAD for $225k!!! New wd floors in Liv & Din. New carpet on 2nd fl. New granite and st stl appliances in terrific open kit. Great space w/ potential for 3 br's (1 is walk thru to the bath). 1st fl half ba & laundry. Central air. Recessed lights. Sec system. Easy walk to stadiums and everything Fed Hill. Super quiet non-thru street. New front door on order.
-
2016-08-19soldstatus $225,000
Show marketing remark (413 chars)
Move-in ready brick Fed Hill home w PARKING PAD for $225k!!! New wd floors in Liv & Din. New carpet on 2nd fl. New granite and st stl appliances in terrific open kit. Great space w/ potential for 3 br's (1 is walk thru to the bath). 1st fl half ba & laundry. Central air. Recessed lights. Sec system. Easy walk to stadiums and everything Fed Hill. Super quiet non-thru street. New front door on order.
-
2016-07-02status Contract 413-char remark
Show marketing remark (413 chars)
Move-in ready brick Fed Hill home w PARKING PAD for $225k!!! New wd floors in Liv & Din. New carpet on 2nd fl. New granite and st stl appliances in terrific open kit. Great space w/ potential for 3 br's (1 is walk thru to the bath). 1st fl half ba & laundry. Central air. Recessed lights. Sec system. Easy walk to stadiums and everything Fed Hill. Super quiet non-thru street. New front door on order.
-
2016-06-28$225,000 Active 413-char remark
Show marketing remark (413 chars)
Move-in ready brick Fed Hill home w PARKING PAD for $225k!!! New wd floors in Liv & Din. New carpet on 2nd fl. New granite and st stl appliances in terrific open kit. Great space w/ potential for 3 br's (1 is walk thru to the bath). 1st fl half ba & laundry. Central air. Recessed lights. Sec system. Easy walk to stadiums and everything Fed Hill. Super quiet non-thru street. New front door on order.
-
2002-05-16soldstatus $110,000
-
2002-02-13soldstatus $109,900
-
2002-01-07historical
-
2002-01-02$109,900
-
2001-12-08historical
-
2001-09-13
-
2001-01-19soldstatus $85,000
-
2000-12-20soldstatus $85,000
-
2000-11-20historical
-
2000-07-27$85,000
-
2000-03-04soldstatus $30,000
-
2000-02-10historical
-
1999-10-05$34,900
-
1998-02-09historical
-
1997-09-04
-
1997-07-31historical
-
1997-02-11
-
1996-06-11soldstatus $63,000
-
1996-06-11soldstatus $63,000
-
1988-01-14soldstatus $37,000
ⓘ Source: listings_history table (triggers on properties + properties_extension) + one-shot
backfill from property_details.listing_events for pre-trigger history.
Tax reassessment forecast MD · Partial reset (capped growth)
- Current annual tax
- $5,081 · $423/mo
- Projected year-2 tax
- $5,081 · $423/mo
- Expected delta
- $0/yr ($0/mo · 0.0%)
ⓘ Screening estimate from a state-policy table — verify with the county assessor before closing.
Climate risk First Street
- Flood 1/10 Low FEMA zone X (unshaded) · 0% chance over 30 yrs
- Wildfire 1/10 Low
- Heat 8/10 Severe 7 d/yr ≥102°F today · 15 d/yr by 30 yrs out
- Wind 6/10 Major 27% chance of damaging wind over 30 yrs
- Air quality 4/10 Moderate 6 unhealthy d/yr today · 7 by 30 yrs out
Nearby sold comps map
Loading sold comps map…
Walkable amenities ~0.75 mi
Loading nearby amenities…
Taxation est. · year 1
- Rental income
- $29,642
- − Mortgage interest
- −$15,679
- − Property taxes
- −$5,081
- − Insurance
- −$1,400
- − Repairs & maintenance
- −$2,371
- − Management
- −$2,371
- − Depreciation
- −$8,143
- Taxable loss
- −$5,402
- Est. tax savings @ 24.0%
- +$1,296
- After-tax cash flow
- $620/yr
For passive investors: Depreciation is non-cash, so a rental often shows a tax loss while cash-flowing — sheltering income. Rental losses are passive: they offset passive income freely, and up to $25,000/yr can offset ordinary (W-2) income if you actively participate and your MAGI is under $100k (phasing out to $0 by $150k); unused losses carry forward. On sale, claimed depreciation is recaptured at up to 25%, and gains may owe capital-gains tax (a 1031 exchange can defer both). Figures are a year-1 estimate at your 24.0% rate — not tax advice; consult a CPA.
Schools (NCES district)
- District
- Baltimore City Public Schools
- NCES district ID
- 2400090
- Math proficiency
- 7% ▼ -9.00%
- Reading proficiency
- 16% ▼ -5.00%
- Median HH income
- $42,108
- Composite
- 10.08/100
- National rank
- #9805
- State rank
- #24 of 24 in MD
Livability — Baltimore
- Score
- 76/100
- State rank
- #90
- US rank
- #3396
Category grades
Schools grade is shown separately in the Schools card above.
Census & demographics
- Census place
- Baltimore, MD
- County
- Baltimore City · 558,601 people
- City population
- 588,727
- Metro
- Baltimore-Columbia-Towson, MD
- Population (ZIP)
- 32,977
- Household income
- $91,842
- Rent vs Own
- Severe rent burden
- 1463.0
Population outlook (Baltimore County) Hauer SSP2
- Today (2025)
- 624,249 people
- By 2030
- 621,541 · -0.4%
- By 2040
- 609,756 · -2.3%
- By 2050
- 597,249 · -4.3%
- By 2075
- 552,236 · -11.5%
- By 2100
- 513,934 · -17.7%
Race, ethnicity, and origin ACS 2023
- Neighborhood character
- Diverse neighborhood (Simpson 0.63)
- Race & ethnicity
- White 55% Black 23% Hispanic / Latino 13% Two or more races 6% Asian 4%
- Hispanic origin (detail)
- Mexican 1% Puerto Rican 1%
- Common ancestry
- Romanian 5% Lithuanian 2% Italian 2%
- Foreign-born
- 10% · Canada, China
- Languages at home
- 85% English-only · Spanish 9% Other Indo-European 1% Other Asian/Pacific 1%
Political lean MEDSL · Baltimore
- 2024 margin
- Solid D (+73.0) · D 85.2% · R 12.2% · Other 2.6%
- 2008→2024 swing
- -2.5pp toward R · 2008: 75.5pp · 2024: 73.0pp
- All cycles
- 2024: D+73.0 2020: D+76.6 2016: D+74.6 2012: D+76.4 2008: D+75.5
Not yet ingested
- Civics
- —
Market trends
- HPI YoY
- ▼ -311.43%
- Current HPI
- 284.338
- Rent YoY
- ▼ -1.00%
- Metro
- Baltimore-Columbia-Towson, MD
- State GDP YoY
- ▲ 2.97%
- F500 in state
- 12
Industry mix (Fortune 500 HQ in MD)
| Industry | F500 HQs | Revenue |
|---|---|---|
| Aerospace / Defense | 1 | $71B |
|
||
| Utilities | 1 | $25B |
|
||
| Hotels | 1 | $24B |
|
||
| Consumer Goods | 1 | $7B |
|
||
| Real Estate | 1 | $6B |
|
||
| Chemicals | 1 | $2B |
|
||
Price history
+656.5% since first listed28 events — show timeline
- 2026-06-03 Price Changed $279,900 BRIGHT MLS
- 2026-05-15 Listed $289,900 BRIGHT MLS
- 2026-05-13 Coming Soon $289,900 BRIGHT MLS
- 2016-08-23 Sold (Public Records) $225,000 Public Records
- 2016-08-19 Sold (MLS) $225,000 MRIS
- 2016-08-19 Sold (MLS) $225,000 BRIGHT MLS
- 2016-07-02 Pending — MRIS
- 2016-06-28 Listed $225,000 MRIS
- 2002-05-16 Sold (Public Records) $110,000 Public Records
- 2002-02-13 Sold (MLS) $109,900 MRIS
- 2002-01-07 Delisted — MRIS
- 2002-01-02 Listed $109,900 MRIS
- 2001-12-08 Delisted — MRIS
- 2001-09-13 Listed — MRIS
- 2001-01-19 Sold (Public Records) $85,000 Public Records
- 2000-12-20 Sold (MLS) $85,000 MRIS
- 2000-11-20 Delisted — MRIS
- 2000-07-27 Listed $85,000 MRIS
- 2000-03-04 Sold (MLS) $30,000 MRIS
- 2000-02-10 Delisted — MRIS
- 1999-10-05 Listed $34,900 MRIS
- 1998-02-09 Delisted — MRIS
- 1997-09-04 Listed — MRIS
- 1997-07-31 Delisted — MRIS
- 1997-02-11 Listed — MRIS
- 1996-06-11 Sold (Public Records) $63,000 Public Records
- 1996-06-11 Sold (Public Records) $63,000 Public Records
- 1988-01-14 Sold (Public Records) $37,000 Public Records
Property tax history
-0.3%/yrLatest (2025): $5,081 · +1.1% YoY. Source: county tax records.
Cash-flow waterfall
monthlySold comps — $/sqft
last 12 mo · ≤1 miLoading sold comps…