 15-Plex
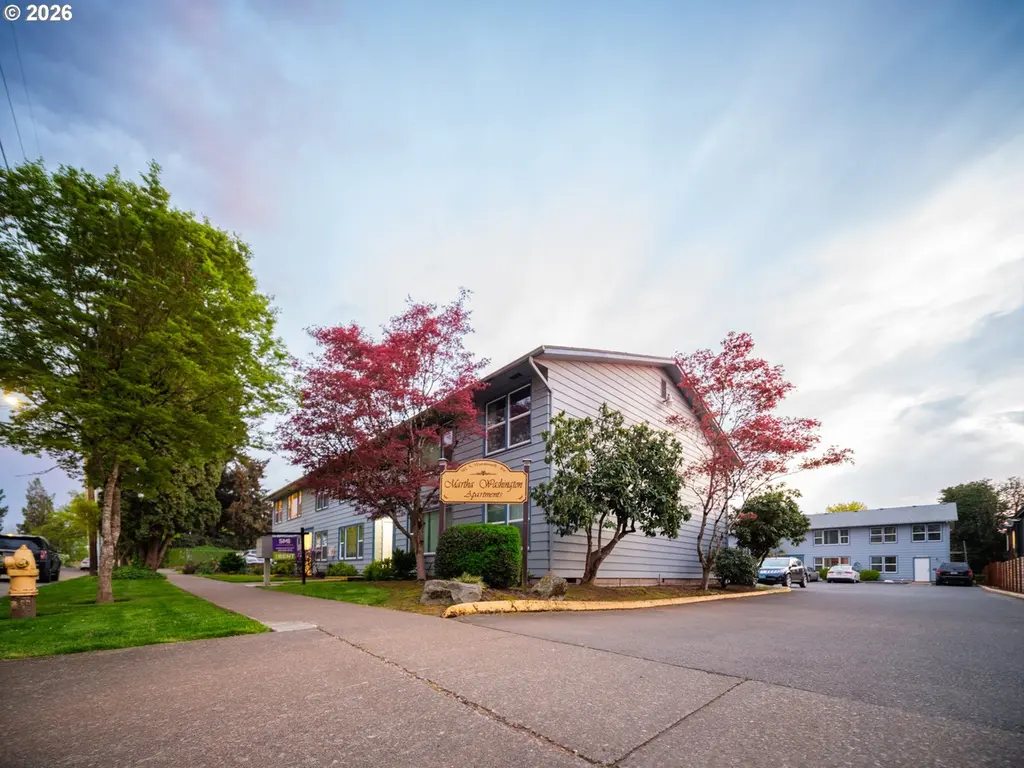
302 Monmouth Ave · Monmouth, OR
Flood risk No data
- FEMA flood zone
- —
- Chance of flooding over 30 yrs
- —
- Est. flood insurance / yr
- —
Fire risk No data
- Est. fire insurance / yr
- —
Heat risk 3/10 · Minor
- Hot days now (above threshold)
- 7 days/yr
- Hot days in 30 yrs
- 13 days/yr
Wind risk No data
- Chance of severe wind over 30 yrs
- —
Air-quality risk 9/10 · Severe
- Unhealthy air days now
- 11 days/yr
- Unhealthy air days in 30 yrs
- 11 days/yr
Risk factors via First Street. Map © Google.
Why this score? — see what drove the C grade
The composite is a weighted blend of 9 inputs, each scored 0–100. Each bar is that input's sub-score; the figure is the points it added to the 100-point composite (weight × sub-score).
- Cash flow +17.4/30.0
- ARV discount +15.0/15.0
- DSCR +5.4/10.0
- 1% rule +4.7/10.0
- Condition / age +3.8/5.0
- Livability +3.6/5.0
- Schools +3.1/10.0
- Rent growth +2.5/5.0
- Appreciation +0.0/10.0
$2,350,000
🖨 Deal sheet 📄 Offer letter ✓ Due diligence
Multi-family units
County records classify this as Multi-Family (5+ Unit). Listing-text estimate: 15 units. confirmed
5+ unit building — per-unit beds/baths from public records are typically unavailable; the breakdown below (if shown) is an estimate from the listing text.
Listing remarks MLS
Martha Washington Apartments is a well maintained 15-unit community located in central Monmouth. The property features (14) 2 bed / 1 bath units and (1) 1 bed / 1 bath unit situated on 0.60 acres with 20 off street parking spaces. Stable producing asset with a strong 6.55% in place cap rate. Upgrades include new roofs and exterior paint.Please do not disturb the tenants.Members of the selling entity are Licensed Real Estate Brokers in the State of Oregon.
Key facts
- Exterior paint
- New roofs
- Central monmouth
Tags
Neighborhood map
What this means for you Summary
Snapshot
- This is a 14×2bd/1ba + 1×1bd/1ba units multifamily listed at $2.35M. Condition is rated good.
Deal economics
- At list price, monthly cash flow is $2k ($21k/yr) — positive. Per door: $117/mo.
- The deal already cash-flows at list — no discount required.
- To meet the 1% rule (rent ≥ 1% of price), the offer needs to be $2.28M (3.1% below list).
- Recommended offer: $2.28M (3.1% below list) — sets the bar for 1% rule.
- Cap rate 7.2% vs local median 2.6% in Monmouth — top-decile yield for the area; either an underpriced asset or a hidden risk that comps aren't pricing in. Stress-test before assuming the spread holds.
Location & tenants
- Location reads 72/100 on livability (#108 in OR) — a middle-class / working-renter tenant base. Strengths: crime A+, commute A+, housing B+; Watch: schools C-, health & safety D+, amenities D.
- Central SD 13J (town): math 26% / reading 41% proficiency, ranked #149 of 183 in OR (top 81%) — families likely to look elsewhere, expect single-tenant / working-renter base with shorter leases.
- Market conditions: 67 active listings in the ZIP; 177 units permitted in Polk County in 2024 (14 in 5+ unit buildings).
- At $22,774/mo this rent would consume 393% of the median local household income ($70k/yr) (locally 412% of renters already pay >50% of income on rent) — very limited rent-growth headroom before tenants either downsize or default.
Forward outlook
- Local home prices are declining (-3.0%/yr); year-one equity from $16k of loan paydown is wiped out by about $70k of value loss. Plan a longer hold.
- Polk County population projected at +25% by 2050 — long-run rental-demand tailwind backs the buy-and-hold thesis.
Negotiation context
- It's been on market 40 days — a 3% lower offer ($2.28M) is reasonable based on typical stale-listing flexibility.
Questions for the listing agent
- It's been on market 40 days. Have you received any prior offers? Is the seller open to a 3% concession, seller financing, or rate buy-down credit?
- Can we see the unit-by-unit rent roll, current vacancy, and any below-market leases? What's the average tenancy length?
- What capital expenditures (roof, boiler, parking lot, exteriors) have been made in the last 5 years, and what's planned in the next 2?
- Built in 1969 — when were the roof, HVAC, electrical panel, plumbing, and water heater last replaced?
- Is there a deadline driving the sale (1031 exchange, divorce, estate, relocation)? That informs how much negotiation room exists.
- What's the average days-on-market for RENTAL listings here right now (not sales)? A rising rental-DOM trend means longer vacancies and softer asking-rent achievability than the comps imply.
- What's the recent tenant-quality profile in this submarket — average credit score on applications, eviction rate, late-payment / NSF rate, and stable-employment percentage? A property-management company in the area should have these aggregated.
- How much new apartment / multifamily construction is in the pipeline within 1–3 miles? Heavy new supply (>2% of stock underway) typically softens rents 12–24 months out; light construction supports rent growth.
Investment metrics
- 1% rule
- 0.97% ✗
- Cap rate
- 7.19%
- Cash-on-cash
- 3.19%
- DSCR
- 1.14
- GRM
- 8.6
CMA / ARV
- ARV (median comp)
- $3,315,351
- List price
- $2,350,000
- Delta
- -29.12%
- Verdict
- UNDERPRICED
- Comps
- 3 within 1.0 mi
Projected returns pro-forma
-3.0% appreciation · 3.0% rent growth · sell at horizon
- IRR
- -11.3%
- Equity multiple
- 0.59×
- Total profit
- $-268,926
- Equity at exit
- $350,393
- IRR
- -2.0%
- Equity multiple
- 0.86×
- Total profit
- $-89,166
- Equity at exit
- $203,185
Cash invested: $658,000 (down + closing). Projections, not guarantees.
Landlord ↔ Tenant lean methodology
- Overall (STATE)
- 28 Tenant-Leaning
- State Oregon
- 28 Tenant-Leaning · D+6
- County
- — inherits STATE
- City
- — inherits STATE
ZIP-level market 97361
- Home prices YoY
- -34.5%
- Active inventory
- 67
- Price-to-rent
- 128.3×
Monthly cashflow live
- Estimated rent
- $22,774 high interval (Pro) →
- Mortgage (P&I)
- −$12,324
- Tax est. 1.5%
- −$2,938 /mo · $35,250/yr
- Insurance
- −$979
- HOA
- −$0
- Vacancy / Maint / Mgmt
- −$4,783
- Net cashflow
- $1,751
Break-even live
15-unit breakdown (identical units grouped — click to expand)
| Units | Beds | Baths | Est. rent |
|---|---|---|---|
| 14× units | 2 | 1 | $21,364 |
| #1 | 2 | 1 | $1,526 |
| #2 | 2 | 1 | $1,526 |
| #3 | 2 | 1 | $1,526 |
| #4 | 2 | 1 | $1,526 |
| #5 | 2 | 1 | $1,526 |
| #6 | 2 | 1 | $1,526 |
| #7 | 2 | 1 | $1,526 |
| #8 | 2 | 1 | $1,526 |
| #9 | 2 | 1 | $1,526 |
| #10 | 2 | 1 | $1,526 |
| #11 | 2 | 1 | $1,526 |
| #12 | 2 | 1 | $1,526 |
| #13 | 2 | 1 | $1,526 |
| #14 | 2 | 1 | $1,526 |
| 1× unit | 1 | 1 | $1,405 |
| Total (15 units) | $22,774 | ||
UW: 25.0% down · 7.5% · 30yr · 1.5% tax · 5.0% vac · 8.0% maint · 8.0% mgmt
Financing live
Cash to close
- Down payment
- $587,500
- Closing costs
- $70,500
- Reserves months
- —
- Total cash needed
- —
Loan-product check · same deal, 3 products live
Conventional
25% down · 7.5% · 30yr
- Down + closing
- —
- Monthly P&I
- —
- Monthly cashflow
- —
- DSCR
- —
- Eligible?
- —
Personal DTI + credit; lowest rate.
DSCR
20% down · 8.5% · 30yr
- Down + closing
- —
- Monthly P&I
- —
- Monthly cashflow
- —
- DSCR
- —
- Eligible?
- —
No personal income docs; deal must DSCR.
Hard money
10% down · 12.0% · 12mo
- Down + closing
- —
- Monthly P&I
- —
- Monthly cashflow
- —
- DSCR
- —
- Eligible?
- —
Short-term bridge; refi at stabilization.
Listing history 11 events
-
2026-06-10days on market $2,350,000 Active 40 DOM
-
2026-06-09days on market $2,350,000 Active 39 DOM
-
2026-06-08days on market $2,350,000 Active 38 DOM
-
2026-06-07days on market $2,350,000 Active 37 DOM
-
2026-06-05days on market $2,350,000 Active 34 DOM
-
2026-06-03days on market $2,350,000 Active 33 DOM
-
2026-06-02days on market $2,350,000 Active 32 DOM
-
2026-06-01days on market $2,350,000 Active 31 DOM
-
2026-05-31days on market $2,350,000 Active 30 DOM
-
2026-05-30days on market $2,350,000 Active 29 DOM
-
2026-05-01$2,350,000 Active 459-char remark
Show marketing remark (459 chars)
Martha Washington Apartments is a well maintained 15-unit community located in central Monmouth. The property features (14) 2 bed / 1 bath units and (1) 1 bed / 1 bath unit situated on 0.60 acres with 20 off street parking spaces. Stable producing asset with a strong 6.55% in place cap rate. Upgrades include new roofs and exterior paint.Please do not disturb the tenants.Members of the selling entity are Licensed Real Estate Brokers in the State of Oregon.
ⓘ Source: listings_history table (triggers on properties + properties_extension) + one-shot
backfill from property_details.listing_events for pre-trigger history.
Climate risk First Street
- Heat 3/10 Moderate
- Air quality 9/10 Extreme 11 unhealthy d/yr today · 11 by 30 yrs out
Nearby sold comps map
Loading sold comps map…
Walkable amenities ~0.75 mi
Loading nearby amenities…
Taxation est. · year 1
- Rental income
- $273,288
- − Mortgage interest
- −$131,637
- − Property taxes
- −$35,250
- − Insurance
- −$11,750
- − Repairs & maintenance
- −$21,863
- − Management
- −$21,863
- − Depreciation
- −$68,364
- Taxable loss
- −$17,438
- Est. tax savings @ 24.0%
- +$4,185
- After-tax cash flow
- $25,199/yr
For passive investors: Depreciation is non-cash, so a rental often shows a tax loss while cash-flowing — sheltering income. Rental losses are passive: they offset passive income freely, and up to $25,000/yr can offset ordinary (W-2) income if you actively participate and your MAGI is under $100k (phasing out to $0 by $150k); unused losses carry forward. On sale, claimed depreciation is recaptured at up to 25%, and gains may owe capital-gains tax (a 1031 exchange can defer both). Figures are a year-1 estimate at your 24.0% rate — not tax advice; consult a CPA.
Condition & rehab AI · 12 photos
This 15-unit apartment complex is in good condition with minimal repairs needed. Upgrades to the exterior, interior, and common areas can significantly increase its value.
Value-add opportunities
- Both Paint exterior siding — Fresh paint can enhance curb appeal and property value.
- Both Replace carpet with hardwood flooring — Hardwood flooring can increase both resale and rental value.
- Both Upgrade kitchen appliances — Upgraded appliances can attract more buyers and renters.
- Both Install smart home technology — Smart home technology can increase property value and attract tech-savvy buyers and renters.
Renovation cost estimate screening
Value-add ROI direction
- Both Paint exterior siding — Fresh paint can enhance curb appeal and property value. ↑
- Both Replace carpet with hardwood flooring — Hardwood flooring can increase both resale and rental value. ↑
- Both Upgrade kitchen appliances — Upgraded appliances can attract more buyers and renters. ↑
- Both Install smart home technology — Smart home technology can increase property value and attract tech-savvy buyers and renters. ↑
ⓘ Cost ranges are severity-bucket heuristics (US national rule-of-thumb). Get contractor quotes + a written scope before underwriting a rehab budget.
Schools (NCES district)
- District
- Central SD 13J
- NCES district ID
- 4102840
- Math proficiency
- 26% ▼ -3.00%
- Reading proficiency
- 41% ▼ -2.00%
- Median HH income
- $42,374
- Composite
- 31.04/100
- National rank
- #11310
- State rank
- #149 of 183 in OR
Livability — Monmouth
- Score
- 72/100
- State rank
- #108
- US rank
- #5992
Category grades
Schools grade is shown separately in the Schools card above.
Census & demographics
- Census place
- Monmouth, OR
- County
- Polk County · 84,240 people
- City population
- 14,488
- Metro
- Salem, OR
- Population (ZIP)
- 14,488
- Household income
- $69,505
- Rent vs Own
- Severe rent burden
- 412.0
Population outlook (Polk County) Hauer SSP2
- Today (2025)
- 88,594 people
- By 2030
- 93,209 · +5.2%
- By 2040
- 101,942 · +15.1%
- By 2050
- 110,395 · +24.6%
- By 2075
- 131,091 · +48.0%
- By 2100
- 141,746 · +60.0%
Race, ethnicity, and origin ACS 2023
- Neighborhood character
- Predominantly White (76%)
- Race & ethnicity
- White 76% Hispanic / Latino 16% Two or more races 12% Native American 2% Asian 1%
- Hispanic origin (detail)
- Mexican 15%
- Common ancestry
- Slovak 4% Italian 3% Portuguese 3%
- Foreign-born
- 6% · Canada, South Korea
- Languages at home
- 87% English-only · Spanish 10% Other Asian/Pacific 1% Korean 1%
Political lean MEDSL · Polk
- 2024 margin
- Toss-up / Even · D 46.6% · R 50.4% · Other 3.0%
- 2008→2024 swing
- -3.3pp toward R · 2008: -0.5pp · 2024: -3.8pp
- All cycles
- 2024: R+3.8 2020: R+1.7 2016: R+7.0 2012: R+4.8 2008: R+0.5
Not yet ingested
- Civics
- —
Market trends
- HPI YoY
- ▼ -162.97%
- Current HPI
- 309.076
- Rent YoY
- —
- Metro
- Salem, OR
- State GDP YoY
- ▲ 2.05%
- F500 in state
- 2
Industry mix (Fortune 500 HQ in OR)
| Industry | F500 HQs | Revenue |
|---|---|---|
| Consumer Goods | 1 | $51B |
|
||
Price history
1 event — show timeline
- 2026-05-01 Listed $2,350,000 RMLS
Cash-flow waterfall
monthlySold comps — $/sqft
last 12 mo · ≤1 miLoading sold comps…