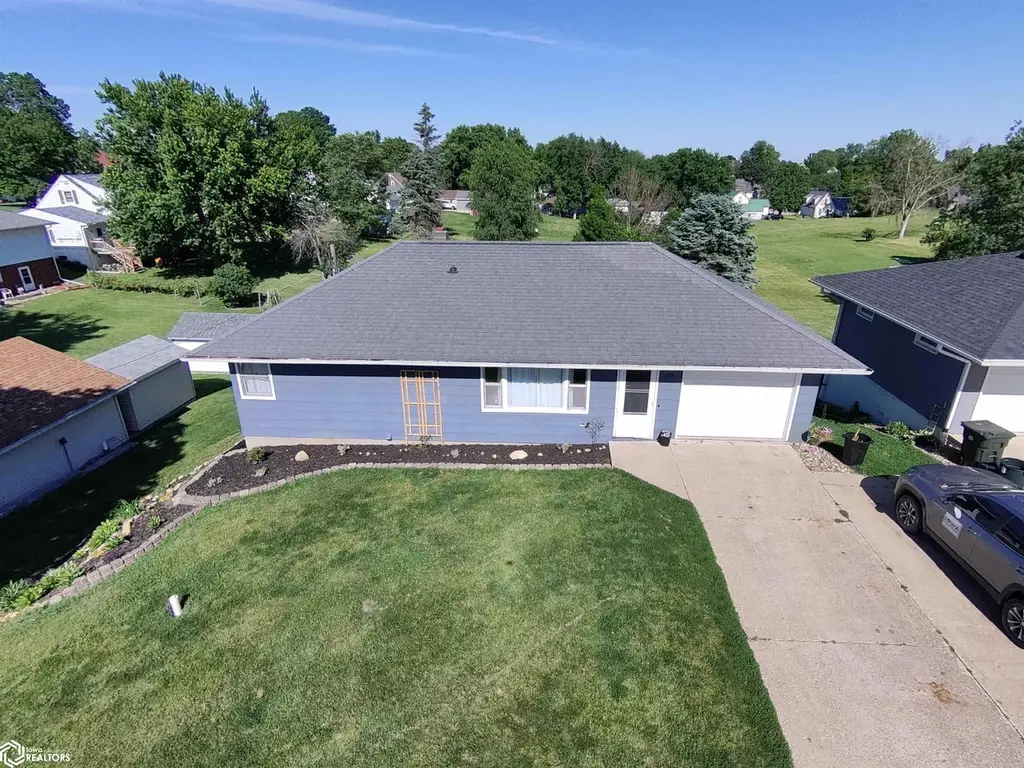
511 N Orchard St · Brooklyn, IA
Flood risk 1/10 · Minimal
- FEMA flood zone
- X (unshaded)
- Chance of flooding over 30 yrs
- 0.0%
- Est. flood insurance / yr
- $473 – $860
Fire risk 1/10 · Minimal
- Est. fire insurance / yr
- $902 – $1,676
Heat risk 3/10 · Minor
- Hot days now (above 104°F)
- 7 days/yr
- Hot days in 30 yrs
- 15 days/yr
Wind risk 2/10 · Minimal
- Chance of severe wind over 30 yrs
- —
Air-quality risk 2/10 · Minimal
- Unhealthy air days now
- 1 days/yr
- Unhealthy air days in 30 yrs
- 1 days/yr
Risk factors via First Street. Map © Google.
Why this score? — see what drove the D- grade
The composite is a weighted blend of 9 inputs, each scored 0–100. Each bar is that input's sub-score; the figure is the points it added to the 100-point composite (weight × sub-score).
- Appreciation +9.3/10.0
- Cash flow +7.3/30.0
- Schools +6.2/10.0
- Livability +3.3/5.0
- ARV discount +2.8/15.0
- Rent growth +2.5/5.0
- Condition / age +2.5/5.0
- 1% rule +1.4/10.0
- DSCR +1.4/10.0
$155,000
🖨 Deal sheet 📄 Offer letter ✓ Due diligence
Listing remarks MLS
Well-built 2 BR, 1 BA ranch home. One car attached garage. Beautiful hardwood flooring in the bedroom. Walkout basement with much potential. Nice sized back yard provides room for a nice garden or playset. Call today to schedule your viewing!
Key facts
- Office
- Back yard
- Family room
Tags
Property features AI
Exterior
- Parking: Attached concrete garage (1 car)
- Utilities: Public water; Public sewer
- Home design: Single-family residence
- Construction: Basement
- Exterior features: Public water; Public sewer; Lot dimensions approximately 75.00 x 148.20
Interior
- Bathrooms: 1 full bathroom
- Heating & cooling: Central air conditioning; Forced air heating
- Interior features: Fireplace (1)
Neighborhood map
What this means for you Summary
Snapshot
- This is a 3-bed/2.0-bath single-family listed at $155k.
Deal economics
- At list price, monthly cash flow is $-210 ($-3k/yr) — negative.
- To cash-flow at today's rent, offer at most $118k (23.9% below list).
- To meet the 1% rule (rent ≥ 1% of price), the offer needs to be $99k (36.3% below list).
- Recommended offer: $99k (36.3% below list) — sets the bar for 1% rule.
Location & tenants
- Location reads 66/100 on livability (#509 in IA) — a middle-class / working-renter tenant base. Strengths: crime A+, cost of living A+, housing A+; Watch: employment D+, amenities F, commute F.
- Brooklyn-Guernsey-Malcom Community School District (rural): math 72% / reading 74% proficiency, ranked #101 of 289 in IA (top 35%) — strong family-tenant draw, lease renewals of 3-5y typical.
- Market conditions: 57 active listings in the ZIP; 27 units permitted in Poweshiek County in 2024 (0 in 5+ unit buildings).
Forward outlook
- In year one you build about $14k of equity ($1k loan paydown + $13k appreciation (8.6% local appreciation)).
- Poweshiek County population projected to shrink 3% by 2050 — rents likely to lag national; underwrite the cash flow, not the appreciation.
- By year 3, paydown + projected appreciation supports a ~$36k cash-out refi (75% LTV) — recoverable capital for the next deal without selling this one.
Negotiation context
- Only 7 days on market — expect competitive offers; lowballing is unlikely to land.
- 3 sale attempts since 5y ago with the ask held roughly flat each time — persistent listings suggest the price (not the market) is what's stuck; bring a comps-based counter.
- Current owner paid $85k; list at $155k implies a 82% gain — meaningful room to come down on a strong offer.
Risks & watch-outs
- Watch-outs: built in 1957 — expect roof / HVAC / electrical / plumbing capex.
Questions for the listing agent
- What do current leases actually rent for vs. the listed asking? Can we see a recent rent roll and the last 12 months of T-12 income?
- Built in 1957 — when were the roof, HVAC, electrical panel, plumbing, and water heater last replaced?
- Is there a deadline driving the sale (1031 exchange, divorce, estate, relocation)? That informs how much negotiation room exists.
- Schools are A-rated — typically a magnet for longer-tenancy family renters. What's the average tenant stay here, and is there a school-zone premium baked into asking?
- The area grade is low — what's the realistic commute time and amenity access for the typical tenant pool here? Any planned neighborhood developments (good or bad) we should know about?
- What's the average days-on-market for RENTAL listings here right now (not sales)? A rising rental-DOM trend means longer vacancies and softer asking-rent achievability than the comps imply.
- What's the recent tenant-quality profile in this submarket — average credit score on applications, eviction rate, late-payment / NSF rate, and stable-employment percentage? A property-management company in the area should have these aggregated.
- How much new for-sale + rental construction is in the pipeline within 1–3 miles? Heavy new supply typically softens prices + rents 12–24 months out; constrained supply supports both.
Investment metrics
- 1% rule
- 0.64% ✗
- Cap rate
- 4.67%
- Cash-on-cash
- -5.80%
- DSCR
- 0.74
- GRM
- 13.1
CMA / ARV
- ARV (on-the-fly)
- $140,400
- Comps found
- 4
Show comp detail 4 sales within ~0.75 mi
| Address | Dist | Beds/Ba | Sqft | Sold | Price | $/sf | Match |
|---|---|---|---|---|---|---|---|
| 807 Park Ave | 0.28mi | 3/1.0 | 880 (-2%) | 6mo | $137,000 | $156 | 74 |
| 410 Sunset Dr | 0.17mi | 2/1.0 (-1) | 832 (-8%) | 7mo | $140,000 | $168 | 65 |
| 215 Linden Ct | 0.27mi | 2/1.5 (-1) | 988 (+10%) | 9mo | $140,000 | $142 | 57 |
| 511 Middle St | 0.57mi | 2/1.0 (-1) | 900 (0%) | 9mo | $62,000 | $69 | 57 |
Match score weights: distance 35% · size 25% · config 20% · recency 20%. Top-matched comps best support the ARV.
Projected returns pro-forma
8.56% appreciation · 3.0% rent growth · sell at horizon
- IRR
- 16.9%
- Equity multiple
- 2.29×
- Total profit
- $56,065
- Equity at exit
- $123,722
- IRR
- 16.1%
- Equity multiple
- 4.98×
- Total profit
- $172,941
- Equity at exit
- $251,506
Cash invested: $43,400 (down + closing). Projections, not guarantees.
Landlord ↔ Tenant lean methodology
- Overall (STATE)
- 83 Strongly Landlord-Friendly
- State Iowa
- 83 Strongly Landlord-Friendly · R+6
- County
- — inherits STATE
- City
- — inherits STATE
ZIP-level market 52211
- Home prices YoY
- 2.6%
- Active inventory
- 57
- Price-to-rent
- 13.1×
Monthly cashflow live
- Estimated rent
- $987 medium interval (Pro) →
- Mortgage (P&I)
- −$813
- Tax from tax record
- −$112 /mo · $1,346/yr
- Insurance
- −$65
- HOA
- −$0
- Vacancy / Maint / Mgmt
- −$207
- Net cashflow
- $-210
Break-even live
UW: 25.0% down · 7.5% · 30yr · 1.5% tax · 5.0% vac · 8.0% maint · 8.0% mgmt
Financing live
Cash to close
- Down payment
- $38,750
- Closing costs
- $4,650
- Reserves months
- —
- Total cash needed
- —
Loan-product check · same deal, 3 products live
Conventional
25% down · 7.5% · 30yr
- Down + closing
- —
- Monthly P&I
- —
- Monthly cashflow
- —
- DSCR
- —
- Eligible?
- —
Personal DTI + credit; lowest rate.
DSCR
20% down · 8.5% · 30yr
- Down + closing
- —
- Monthly P&I
- —
- Monthly cashflow
- —
- DSCR
- —
- Eligible?
- —
No personal income docs; deal must DSCR.
Hard money
10% down · 12.0% · 12mo
- Down + closing
- —
- Monthly P&I
- —
- Monthly cashflow
- —
- DSCR
- —
- Eligible?
- —
Short-term bridge; refi at stabilization.
Listing history 7 events
-
2026-06-09statusdays on market $155,000 Pending 7 DOM
-
2026-06-08days on market $155,000 Active Under Contract 6 DOM
-
2026-06-07days on market $155,000 Active Under Contract 5 DOM
-
2026-06-07statusdays on market $155,000 Active Under Contract 4 DOM
-
2026-06-04remarks 541-char remark
-
2026-06-03remarks 455-char remark
-
2026-06-03$155,000 Active 1 DOM
ⓘ Source: listings_history table (triggers on properties + properties_extension) + one-shot
backfill from property_details.listing_events for pre-trigger history.
Tax reassessment forecast IA · Partial reset (capped growth)
- Current annual tax
- $1,346 · $112/mo
- Projected year-2 tax
- $1,890 · $157/mo
- Expected delta
- +$544/yr (+$45/mo · 40.4%)
ⓘ Screening estimate from a state-policy table — verify with the county assessor before closing.
Climate risk First Street
- Flood 1/10 Low FEMA zone X (unshaded) · 0% chance over 30 yrs
- Wildfire 1/10 Low
- Heat 3/10 Moderate 7 d/yr ≥104°F today · 15 d/yr by 30 yrs out
- Wind 2/10 Low
- Air quality 2/10 Low 1 unhealthy d/yr today · 1 by 30 yrs out
Nearby sold comps map
Loading sold comps map…
Walkable amenities ~0.75 mi
Loading nearby amenities…
Taxation est. · year 1
- Rental income
- $11,846
- − Mortgage interest
- −$8,682
- − Property taxes
- −$1,346
- − Insurance
- −$775
- − Repairs & maintenance
- −$948
- − Management
- −$948
- − Depreciation
- −$4,509
- Taxable loss
- −$5,362
- Est. tax savings @ 24.0%
- +$1,287
- After-tax cash flow
- $-1,230/yr
For passive investors: Depreciation is non-cash, so a rental often shows a tax loss while cash-flowing — sheltering income. Rental losses are passive: they offset passive income freely, and up to $25,000/yr can offset ordinary (W-2) income if you actively participate and your MAGI is under $100k (phasing out to $0 by $150k); unused losses carry forward. On sale, claimed depreciation is recaptured at up to 25%, and gains may owe capital-gains tax (a 1031 exchange can defer both). Figures are a year-1 estimate at your 24.0% rate — not tax advice; consult a CPA.
Schools (NCES district)
- District
- Brooklyn-Guernsey-Malcom Community School District
- NCES district ID
- 1905490
- Math proficiency
- 72% ▼ -4.00%
- Reading proficiency
- 74% ▲ 2.00%
- Median HH income
- $49,307
- Composite
- 61.79/100
- National rank
- #734
- State rank
- #101 of 289 in IA
Livability — Brooklyn
- Score
- 66/100
- State rank
- #509
- US rank
- #11267
Category grades
Schools grade is shown separately in the Schools card above.
Census & demographics
- Census place
- Brooklyn, IA
- Population (ZIP)
- 2,671
Population outlook (Poweshiek County) Hauer SSP2
- Today (2025)
- 18,601 people
- By 2030
- 18,342 · -1.4%
- By 2040
- 17,944 · -3.5%
- By 2050
- 18,029 · -3.1%
- By 2075
- 19,945 · +7.2%
- By 2100
- 22,637 · +21.7%
Race, ethnicity, and origin ACS 2023
- Neighborhood character
- Predominantly White (98%)
- Race & ethnicity
- White 98% Hispanic / Latino 2%
- Common ancestry
- English 4% Slovak 3% Iranian 2%
- Foreign-born
- 2% · Canada
- Languages at home
- 98% English-only · Spanish 1%
Political lean MEDSL · Poweshiek
- 2024 margin
- R (+17.0) · D 40.8% · R 57.8% · Other 1.5%
- 2008→2024 swing
- -28.7pp toward R · 2008: 11.8pp · 2024: -17.0pp
- All cycles
- 2024: R+17.0 2020: R+13.3 2016: R+6.8 2012: D+9.1 2008: D+11.8
Not yet ingested
- Civics
- —
Market trends
- HPI YoY
- ▲ 8.56%
- Current HPI
- 332.4308
- Rent YoY
- —
- Metro
- —
- State GDP YoY
- ▲ 2.48%
- F500 in state
- 4
Industry mix (Fortune 500 HQ in IA)
| Industry | F500 HQs | Revenue |
|---|---|---|
| Financial Services | 1 | $16B |
|
||
| Retail / Convenience | 1 | $15B |
|
||
Price history
+138.5% since first listed10 events — show timeline
- 2026-06-02 Listed $155,000 IAR
- 2026-02-04 Price Changed $150,000 IAR
- 2025-10-24 Price Changed $160,000 IAR
- 2025-09-11 Price Changed $170,000 IAR
- 2025-08-24 Listed $175,000 IAR
- 2021-04-28 Sold (Public Records) $85,000 Public Records
- 2021-04-26 Sold (MLS) $85,000 IAR
- 2021-03-18 Listed $94,900 IAR
- 2013-08-28 Sold (Public Records) $72,100 Public Records
- 2008-05-06 Sold (Public Records) $65,000 Public Records
Property tax history
-0.0%/yrLatest (2025): $1,346 · -20.9% YoY. Source: county tax records.
Cash-flow waterfall
monthlySold comps — $/sqft
last 12 mo · ≤1 miLoading sold comps…