11621 Tazwell Dr · Louisville/Jefferson County metro government (balance), KY
Flood risk 1/10 · Minimal
- FEMA flood zone
- X (unshaded)
- Chance of flooding over 30 yrs
- 0.0%
- Est. flood insurance / yr
- $473 – $860
Fire risk 1/10 · Minimal
- Est. fire insurance / yr
- $839 – $1,559
Heat risk 5/10 · Moderate
- Hot days now (above 104°F)
- 7 days/yr
- Hot days in 30 yrs
- 20 days/yr
Wind risk 2/10 · Minimal
- Chance of severe wind over 30 yrs
- 2.0%
Air-quality risk 3/10 · Minor
- Unhealthy air days now
- 2 days/yr
- Unhealthy air days in 30 yrs
- 3 days/yr
Risk factors via First Street. Map © Google.
Why this score? — see what drove the F grade
The composite is a weighted blend of 9 inputs, each scored 0–100. Each bar is that input's sub-score; the figure is the points it added to the 100-point composite (weight × sub-score).
- Cash flow +14.5/30.0
- DSCR +4.4/10.0
- 1% rule +3.0/10.0
- Rent growth +2.8/5.0
- Livability +2.5/5.0
- Condition / age +2.5/5.0
- Schools +2.3/10.0
- ARV discount +0.0/15.0
- Appreciation +0.0/10.0
$197,500
🖨 Deal sheet 📄 Offer letter ✓ Due diligence
Listing remarks
BACK ON MARKET!! (owners agree to have new furnace & ac unit installed before closing! ) this lovely townhouse is currently ready for SALE! 3 bedrooms, 1 full bathroom & 1/2 bath, kitchen with dining room area, there is a 1/2 bath off the kitchen and a privacy fenced backyard! CALL YOUR AGENT TODAY! MOVE IN READY!!
Key facts
- Built 1991
- Listed 28 days
Tags
Property features AI
Finance
- HOA & community: No association fee
Exterior
- Utilities: Electricity connected; Natural gas available
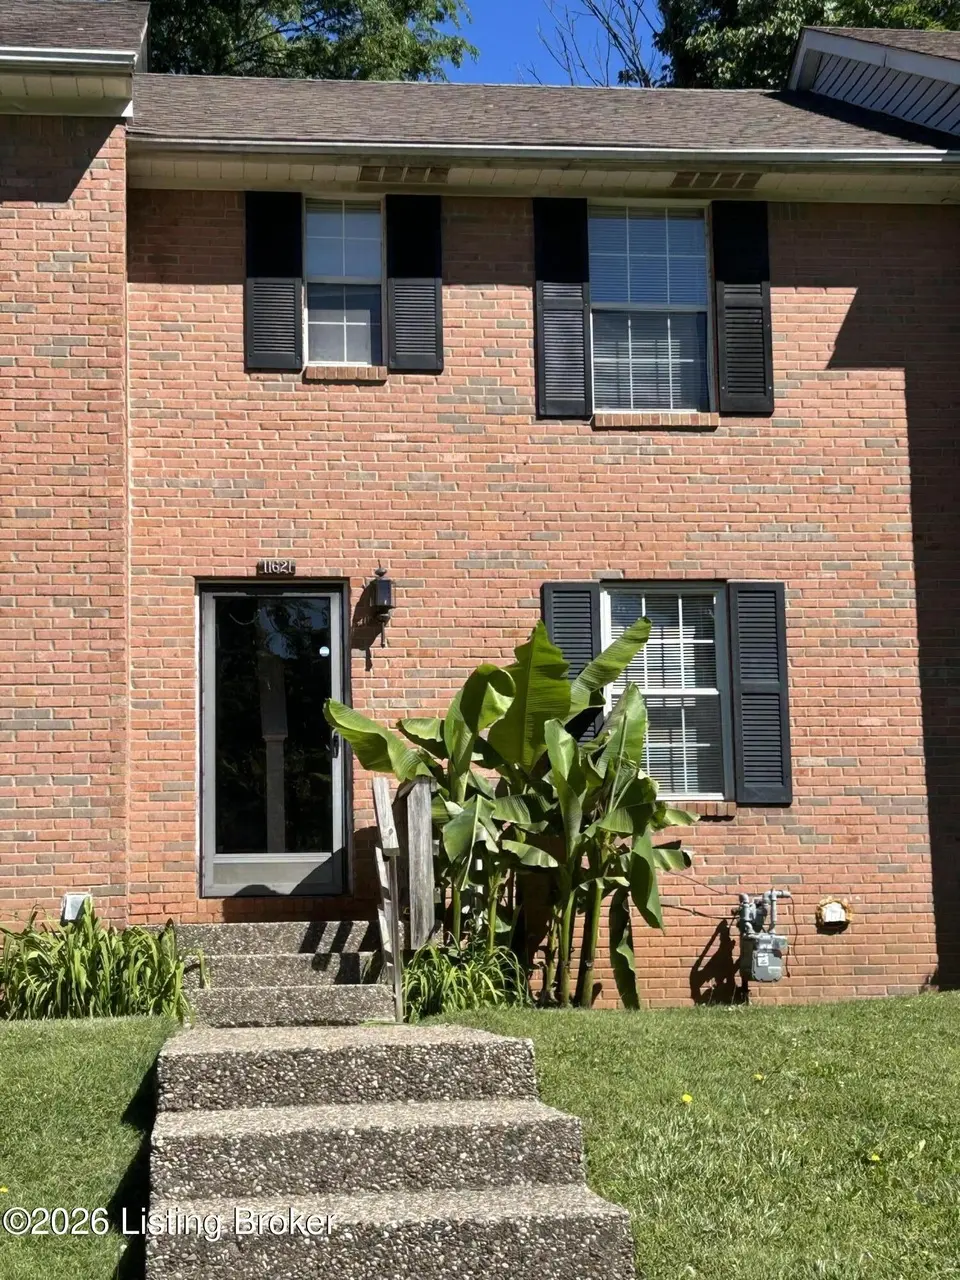
- Home design: Traditional-style residential property; Two stories; Located in the Pine Tree Villa subdivision
- Construction: Built in 1991; Brick construction; Shingle roof; Poured concrete foundation
- Exterior features: No additional exterior features listed
Interior
- Kitchen: Kitchen on the first floor; First-floor dining area
- Bedrooms: Three bedrooms located on the second floor
- Bathrooms: One full bathroom on the second floor; One half bathroom on the first floor
- Heating & cooling: Electric forced-air heating with natural gas; Central air conditioning
- Interior features: Six total rooms; Six closets; Unfinished basement
- Laundry & utility: Laundry room in the basement
Neighborhood map
What this means for you Summary
Snapshot
- This is a 3-bed/1.5-bath townhouse listed at $198k.
Deal economics
- At list price, monthly cash flow is $45 ($542/yr) — positive.
- The deal already cash-flows at list — no discount required.
- To meet the 1% rule (rent ≥ 1% of price), the offer needs to be $157k (20.5% below list).
- Recommended offer: $157k (20.5% below list) — sets the bar for 1% rule.
- Cap rate 6.6% vs local median 4.0% in Louisville/Jefferson County metro government (balance) — top-decile yield for the area; either an underpriced asset or a hidden risk that comps aren't pricing in. Stress-test before assuming the spread holds.
Location & tenants
- Location reads: area grade F — affects rentability + tenant quality, not the cash-flow math above.
- Jefferson County (urban): math 19% / reading 35% proficiency, ranked #121 of 165 in KY (top 73%) — low school quality limits family demand, transient renter base, plan for 1-2y turnover.
- Market conditions: Rents rising (+1.2%/yr); 343 active listings in the ZIP; 14 comparable units currently listed for rent nearby; rentals leasing fast (median 2d on market — plan ~1-2 weeks tenant-placement turnaround); high-income renter base; 2,836 units permitted in Jefferson County in 2024 (1,558 in 5+ unit buildings).
- This rent is only 15% of the median local income ($123k/yr) — well below the 30% rent-burden line; pricing power to push rent on renewal without tenant pushback.
Forward outlook
- Local home prices are declining (-3.0%/yr); year-one equity from $1k of loan paydown is wiped out by about $6k of value loss. Plan a longer hold.
- Jefferson County population projected at +13% by 2050 — modest demand growth; plan on rents tracking national, not racing it.
Negotiation context
- It's been on market 28 days — a 2% lower offer ($195k) is reasonable based on typical stale-listing flexibility.
- 2 sale attempts since 3y ago with the ask held roughly flat each time — persistent listings suggest the price (not the market) is what's stuck; bring a comps-based counter.
Risks & watch-outs
- Climate carrying-cost: extreme-heat days projected 7→20/yr by 2055 (HVAC capex compounding) — expect insurance premiums to compound above CPI over the hold.
Questions for the listing agent
- Is there a deadline driving the sale (1031 exchange, divorce, estate, relocation)? That informs how much negotiation room exists.
- The area grade is low — what's the realistic commute time and amenity access for the typical tenant pool here? Any planned neighborhood developments (good or bad) we should know about?
- What's the average days-on-market for RENTAL listings here right now (not sales)? A rising rental-DOM trend means longer vacancies and softer asking-rent achievability than the comps imply.
- What's the recent tenant-quality profile in this submarket — average credit score on applications, eviction rate, late-payment / NSF rate, and stable-employment percentage? A property-management company in the area should have these aggregated.
- How much new for-sale + rental construction is in the pipeline within 1–3 miles? Heavy new supply typically softens prices + rents 12–24 months out; constrained supply supports both.
Investment metrics
- 1% rule
- 0.80% ✗
- Cap rate
- 6.57%
- Cash-on-cash
- 0.98%
- DSCR
- 1.04
- GRM
- 10.5
CMA / ARV
- ARV (on-the-fly)
- $162,240
- Comps found
- 12
Show comp detail 12 sales within ~0.75 mi
| Address | Dist | Beds/Ba | Sqft | Sold | Price | $/sf | Match |
|---|---|---|---|---|---|---|---|
| 11915 Tazwell Dr Apt 6 | 0.29mi | 2/2.0 (-1) | 985 (+3%) | 3mo | $157,000 | $159 | 73 |
| 11913 Tazwell Dr #2 | 0.29mi | 2/2.0 (-1) | 970 (+1%) | 8mo | $160,000 | $165 | 71 |
| 11909 Tazwell Dr #5 | 0.26mi | 2/2.0 (-1) | 930 (-3%) | 6mo | $155,000 | $167 | 71 |
| 11911 Tazwell Dr #2 | 0.26mi | 2/2.0 (-1) | 981 (+2%) | 16mo | $158,750 | $162 | 64 |
| 11915 Tazwell Dr Apt 8 | 0.29mi | 2/2.0 (-1) | 898 (-6%) | 8mo | $152,000 | $169 | 62 |
| 3726 Charter Oaks Dr #3 | 0.70mi | 2/1.5 (-1) | 950 (-1%) | 6mo | $148,500 | $156 | 56 |
| 12417 Kiawah Ct | 0.72mi | 2/2.0 (-1) | 945 (-2%) | 4mo | $190,000 | $201 | 54 |
| 3724 Charter Oaks Dr #3 | 0.68mi | 2/1.5 (-1) | 948 (-1%) | 12mo | $145,000 | $153 | 51 |
| 12405 Kiawah Ct | 0.68mi | 3/1.5 | 890 (-7%) | 19mo | $185,000 | $208 | 40 |
| 12502 Kiawah Ct | 0.73mi | 3/1.0 | 862 (-10%) | 12mo | $165,000 | $191 | 36 |
| 12414 Kiawah Ct | 0.72mi | 2/2.0 (-1) | 866 (-10%) | 12mo | $169,000 | $195 | 32 |
| 12400 Kiawah Ct #44 | 0.68mi | 3/1.0 | 829 (-14%) | 20mo | $165,000 | $199 | 27 |
Match score weights: distance 35% · size 25% · config 20% · recency 20%. Top-matched comps best support the ARV.
Projected returns pro-forma
-3.0% appreciation · 1.24% rent growth · sell at horizon
- IRR
- -16.5%
- Equity multiple
- 0.42×
- Total profit
- $-31,939
- Equity at exit
- $29,448
- IRR
- -11.5%
- Equity multiple
- 0.36×
- Total profit
- $-35,259
- Equity at exit
- $17,076
Cash invested: $55,300 (down + closing). Projections, not guarantees.
Landlord ↔ Tenant lean methodology
- Overall (STATE)
- 83 Strongly Landlord-Friendly
- State Kentucky
- 83 Strongly Landlord-Friendly · R+16
- County
- — inherits STATE
- City
- — inherits STATE
ZIP-level market 40245
- Home prices YoY
- -24.9%
- Rents YoY
- 1.2%
- Active inventory
- 343
- Price-to-rent
- 10.5×
Monthly cashflow live
- Estimated rent
- $1,571 high interval (Pro) →
- Mortgage (P&I)
- −$1,036
- Tax from tax record
- −$78 /mo · $933/yr
- Insurance
- −$82
- HOA
- −$0
- Vacancy / Maint / Mgmt
- −$330
- Net cashflow
- $45
Break-even live
UW: 25.0% down · 7.5% · 30yr · 1.5% tax · 5.0% vac · 8.0% maint · 8.0% mgmt
Financing live
Cash to close
- Down payment
- $49,375
- Closing costs
- $5,925
- Reserves months
- —
- Total cash needed
- —
Loan-product check · same deal, 3 products live
Conventional
25% down · 7.5% · 30yr
- Down + closing
- —
- Monthly P&I
- —
- Monthly cashflow
- —
- DSCR
- —
- Eligible?
- —
Personal DTI + credit; lowest rate.
DSCR
20% down · 8.5% · 30yr
- Down + closing
- —
- Monthly P&I
- —
- Monthly cashflow
- —
- DSCR
- —
- Eligible?
- —
No personal income docs; deal must DSCR.
Hard money
10% down · 12.0% · 12mo
- Down + closing
- —
- Monthly P&I
- —
- Monthly cashflow
- —
- DSCR
- —
- Eligible?
- —
Short-term bridge; refi at stabilization.
Rent comps 14 comps
| Address | Beds | Baths | Sqft | Rent | $/sqft | DOM | Units | Dist |
|---|---|---|---|---|---|---|---|---|
| 4500 Westport Woods Ln Unit 4506-304 Louisville, KY | 2.0 | 1.0 | 930 | $1,100 | $1.18 | 10d | 1 | 0.16mi |
| 4500 Westport Woods Ln Unit 4508-104 Louisville, KY | 2.0 | 1.0 | 930 | $1,100 | $1.18 | 24d | 1 | 0.16mi |
| 11707 Nansemond Pl Louisville, KY | 1.0–3.0 | 1.0–2.0 | 824 | $1,499 | $1.82 | 2d | 12 | 0.21mi |
| 11353 N Tazwell Dr Louisville, KY | 1.0–3.0 | 1.0–2.5 | 1366 | $1,850 | $1.35 | 2d | 29 | 0.24mi |
| 4429 Baygarden Ct Louisville, KY | 2.0 | 1.0 | 872 | $1,700 | $1.95 | 16d | 1 | 0.28mi |
| 3906 Accomack Dr Louisville, KY | 2.0 | 1.0 | 945 | $1,045 | $1.11 | 3d | 3 | 0.43mi |
| 11507 Maple Brook Dr Louisville, KY | 1.0–3.0 | 1.0–2.0 | 1044 | $1,756 | $1.68 | 2d | 7 | 0.48mi |
| 4605 Pulaski Ct Louisville, KY | 3.0 | 2.0 | 1111 | $2,100 | $1.89 | 24d | 1 | 0.53mi |
| 5004 Winding Spring Pl Louisville, KY | 3.0 | 1.0 | 1056 | $1,499 | $1.42 | 10d | 1 | 0.84mi |
| 5004 Winding Spring Pl Louisville, KY | 3.0 | 1.0 | 1056 | $1,499 | $1.42 | 2d | 1 | 0.84mi |
| 10720 Bell Tucker Ln Louisville, KY | 1.0–3.0 | 1.0–2.0 | 1064 | $2,139 | $2.01 | 2d | 29 | 0.97mi |
| 11000 Indian Legends Dr Louisville, KY | 1.0–3.0 | 1.0–2.5 | 1165 | $1,999 | $1.72 | 2d | 9 | 1.20mi |
| 10400 Shadow Ridge Ln Louisville, KY | 1.0–2.0 | 1.0–2.0 | 1108 | $1,795 | $1.62 | 2d | 23 | 1.45mi |
| 3700 Springhurst Blvd Louisville, KY | 1.0–3.0 | 1.0–2.0 | 998 | $1,842 | $1.84 | 2d | 29 | 1.48mi |
Listing history 16 events
-
2026-06-18days on market $197,500 Active 28 DOM
-
2026-06-17days on market $197,500 Active 27 DOM
-
2026-06-16days on market $197,500 Active 26 DOM
-
2026-06-15days on market $197,500 Active 25 DOM
-
2026-06-13days on market $197,500 Active 23 DOM
-
2026-06-10days on market $197,500 Active 20 DOM
-
2026-06-09days on market $197,500 Active 19 DOM
-
2026-06-08days on market $197,500 Active 18 DOM
-
2026-06-07remarks 323-char remark
-
2026-06-07statusdays on market $197,500 Active 17 DOM
-
2026-05-14$197,500 Active
-
2023-04-01status Pending
-
2023-03-16historical
-
2023-03-16price $135,000
-
2023-03-16historical
-
2023-02-20$525,000 Active
ⓘ Source: listings_history table (triggers on properties + properties_extension) + one-shot
backfill from property_details.listing_events for pre-trigger history.
Tax reassessment forecast KY · Resets to sale price
- Current annual tax
- $933 · $78/mo
- Projected year-2 tax
- $1,698 · $142/mo
- Expected delta
- +$766/yr (+$64/mo · 82.1%)
ⓘ Screening estimate from a state-policy table — verify with the county assessor before closing.
Climate risk First Street
- Flood 1/10 Low FEMA zone X (unshaded) · 0% chance over 30 yrs
- Wildfire 1/10 Low
- Heat 5/10 Major 7 d/yr ≥104°F today · 20 d/yr by 30 yrs out
- Wind 2/10 Low 2% chance of damaging wind over 30 yrs
- Air quality 3/10 Moderate 2 unhealthy d/yr today · 3 by 30 yrs out
Nearby sold comps map
Loading sold comps map…
Walkable amenities ~0.75 mi
Loading nearby amenities…
Taxation est. · year 1
- Rental income
- $18,850
- − Mortgage interest
- −$11,063
- − Property taxes
- −$933
- − Insurance
- −$988
- − Repairs & maintenance
- −$1,508
- − Management
- −$1,508
- − Depreciation
- −$5,745
- Taxable loss
- −$2,895
- Est. tax savings @ 24.0%
- +$695
- After-tax cash flow
- $1,237/yr
For passive investors: Depreciation is non-cash, so a rental often shows a tax loss while cash-flowing — sheltering income. Rental losses are passive: they offset passive income freely, and up to $25,000/yr can offset ordinary (W-2) income if you actively participate and your MAGI is under $100k (phasing out to $0 by $150k); unused losses carry forward. On sale, claimed depreciation is recaptured at up to 25%, and gains may owe capital-gains tax (a 1031 exchange can defer both). Figures are a year-1 estimate at your 24.0% rate — not tax advice; consult a CPA.
Schools (NCES district)
- District
- Jefferson County
- NCES district ID
- 2102990
- Math proficiency
- 19% ▼ -17.00%
- Reading proficiency
- 35% ▼ -11.00%
- Median HH income
- $47,885
- Composite
- 23.45/100
- National rank
- #7884
- State rank
- #121 of 165 in KY
Livability — Louisville/Jefferson County metro government (balance)
No livability data for this city. (Only ~50 U.S. cities are tracked.)
Census & demographics
- Census place
- Louisville/Jefferson County metro government (balance), KY
- County
- Jefferson County · 790,184 people
- City population
- 419,741
- Metro
- Louisville/Jefferson County, KY-IN
- Population (ZIP)
- 39,835
- Household income
- $122,948
- Rent vs Own
- Severe rent burden
- 826.0
Population outlook (Jefferson County) Hauer SSP2
- Today (2025)
- 823,112 people
- By 2030
- 849,343 · +3.2%
- By 2040
- 895,696 · +8.8%
- By 2050
- 933,630 · +13.4%
- By 2075
- 1,028,262 · +24.9%
- By 2100
- 1,072,675 · +30.3%
Race, ethnicity, and origin ACS 2023
- Neighborhood character
- Predominantly White (74%)
- Race & ethnicity
- White 74% Black 8% Asian 8% Two or more races 7% Hispanic / Latino 6%
- Hispanic origin (detail)
- Mexican 2% Cuban 2%
- Common ancestry
- Slovak 2% Romanian 2% Lithuanian 2%
- Foreign-born
- 11% · Canada, China, Jamaica
- Languages at home
- 87% English-only · Spanish 4% Other Indo-European 4% Other Asian/Pacific 2%
Political lean MEDSL · Jefferson
- 2024 margin
- D (+16.6) · D 57.4% · R 40.9% · Other 1.7%
- 2008→2024 swing
- +4.5pp toward D · 2008: 12.0pp · 2024: 16.6pp
- All cycles
- 2024: D+16.6 2020: D+20.1 2016: D+13.3 2012: D+11.1 2008: D+12.0
Not yet ingested
- Civics
- —
Market trends
- HPI YoY
- ▼ -72.50%
- Current HPI
- 218.7477
- Rent YoY
- ▲ 1.24%
- Metro
- Louisville/Jefferson County, KY-IN
- State GDP YoY
- ▲ 1.81%
- F500 in state
- 4
Industry mix (Fortune 500 HQ in KY)
| Industry | F500 HQs | Revenue |
|---|---|---|
| Healthcare | 1 | $118B |
|
||
| Food / Beverage | 1 | $7B |
|
||
Price history
-62.4% since first listed6 events — show timeline
- 2026-05-14 Listed $197,500 Metro Search MLS
- 2023-04-01 Pending — Metro Search MLS
- 2023-03-16 Listing Removed — Metro Search MLS
- 2023-03-16 Price Changed $135,000 Metro Search MLS
- 2023-03-16 Listing Removed — Metro Search MLS
- 2023-02-20 Listed $525,000 Metro Search MLS
Property tax history
+2.1%/yrLatest (2025): $933 · -1.9% YoY. Source: county tax records.
Cash-flow waterfall
monthlySold comps — $/sqft
last 12 mo · ≤1 miLoading sold comps…