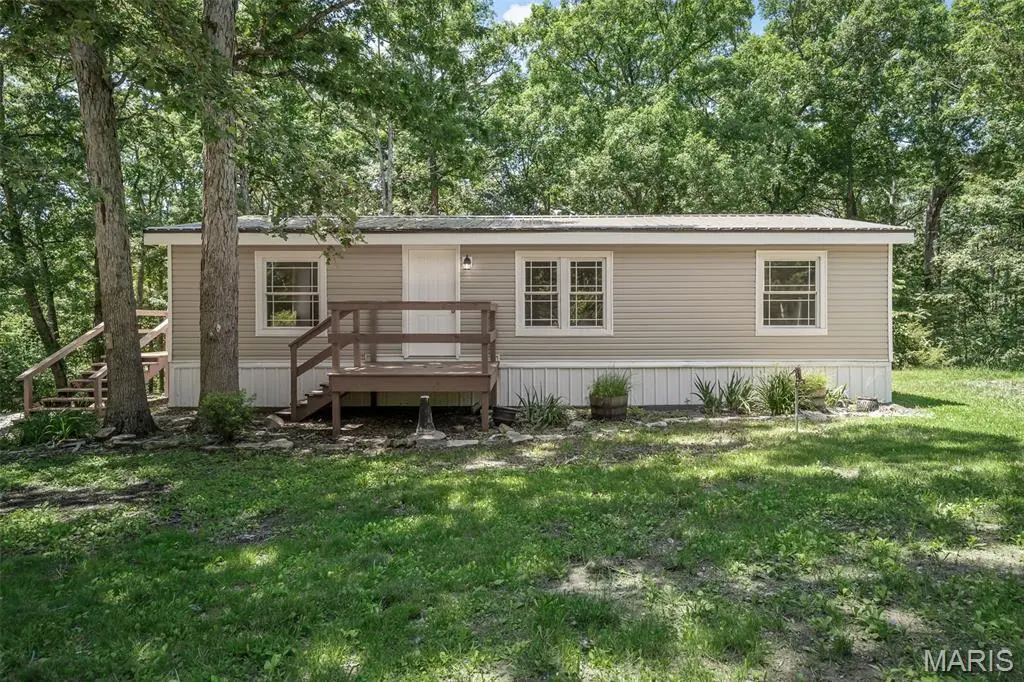
23857 Alberta Dr · Pendleton, MO
Flood risk 1/10 · Minimal
- FEMA flood zone
- X (unshaded)
- Chance of flooding over 30 yrs
- 0.0%
- Est. flood insurance / yr
- $507 – $1,088
Fire risk 4/10 · Minor
- Est. fire insurance / yr
- $1,054 – $1,958
Heat risk 3/10 · Minor
- Hot days now (above 106°F)
- 7 days/yr
- Hot days in 30 yrs
- 20 days/yr
Wind risk 2/10 · Minimal
- Chance of severe wind over 30 yrs
- 1.0%
Air-quality risk 2/10 · Minimal
- Unhealthy air days now
- 0 days/yr
- Unhealthy air days in 30 yrs
- 1 days/yr
Risk factors via First Street. Map © Google.
Why this score? — see what drove the D grade
The composite is a weighted blend of 9 inputs, each scored 0–100. Each bar is that input's sub-score; the figure is the points it added to the 100-point composite (weight × sub-score).
- Cash flow +16.2/30.0
- ARV discount +7.5/15.0
- DSCR +5.0/10.0
- Schools +3.3/10.0
- 1% rule +3.1/10.0
- Livability +2.9/5.0
- Rent growth +2.5/5.0
- Condition / age +2.5/5.0
- Appreciation +0.0/10.0
$180,000
🖨 Deal sheet (PDF) 📄 Offer letter ✓ Due diligence
Listing remarks
Tucked away on a 2.94-acre lot, down a quiet private lane shared by just 3 other homes, this fully updated ranch offers space, privacy, and a great natural setting. The property is mostly wooded with gently rolling ground, giving it a peaceful, country feel while still being just a short drive to Warrenton. Inside, you'll find 3 bedrooms and 2 full baths, all completely updated from top to bottom. The vaulted ceilings give the main living space an open, airy feel, and the luxury vinyl plank flooring runs throughout the entire home. The kitchen and both bathrooms have been nicely redone with modern finishes, and everything has a fresh, clean look. Big-ticket items are already taken care of,
Key facts
- 2.95 acre lot
- Garage
- Built 1994
Property features AI
Finance
- Other: Property type: Residential (Mobile Home); Lot size about 2.9 acres (source: public records)
- Financial info: Lease not considered; No home warranty indicated
Exterior
- Parking: Total parking for 2 vehicles; Detached carport (1 space); Detached garage (1 space); Additional off-street parking
- Security: Smoke detector(s)
- Utilities: Well water; Septic tank; Electric connected (service type: other); Underground utilities
- Home design: Manufactured home; One level; Updated/remodeled condition; Private ownership
- Construction: Metal roof; Construction materials: Unknown; Slab foundation; Structure listed as manufactured house; Living area listed as 1,144 (above grade)
- Exterior features: Deck; Shed(s); Adjoins wooded area with many trees; Gravel road access; City street frontage (about 459' frontage)
Interior
- Kitchen: Electric range
- Bedrooms: 3 bedrooms, all on the main level
- Bathrooms: 2 full bathrooms, both on the main level
- Heating & cooling: Forced air heating; Central electric air conditioning
- Interior features: Eat-in kitchen; Kitchen and dining room combo; Open floorplan; Insulated windows
- Laundry & utility: Washer hookup on main level; Electric dryer hookup on main level; Main-level laundry room (approx. 8x5)
Neighborhood map
What this means for you Summary
Snapshot
- This is a 3-bed/1.0-bath manufactured listed at $180k.
Deal economics
- At list price, monthly cash flow is $94 ($1k/yr) — positive.
- The deal already cash-flows at list — no discount required.
- To meet the 1% rule (rent ≥ 1% of price), the offer needs to be $146k (19.1% below list).
- Recommended offer: $146k (19.1% below list) — sets the bar for 1% rule.
Location & tenants
- Location reads 58/100 on livability (#607 in MO) — a working-class tenant base; expect higher turnover. Strengths: employment A+, cost of living A+, crime A; Watch: amenities F, commute F, health & safety F.
- Warren County R-III (town): math 30% / reading 46% proficiency, ranked #172 of 324 in MO (top 53%) — families likely to look elsewhere, expect single-tenant / working-renter base with shorter leases.
- Zoned schools: Warrior Ridge Elem. (math 48% / reading 57%, grade C-, #226 of 1,115 statewide, top 21%, 544 students, 42% FRL); Black Hawk Middle (math 25% / reading 43%, grade F, #255 of 391 statewide, top 66%, 698 students, 43% FRL); Warrenton High (math 28% / reading 57%, grade F, #216 of 521 statewide, top 41%, 997 students, 40% FRL) — zoned schools at 42% FRL track the district average.
- Market conditions: 177 active listings in the ZIP; 424 units permitted in Warren County in 2024 (126 in 5+ unit buildings).
Forward outlook
- Local home prices are declining (-3.0%/yr); year-one equity from $1k of loan paydown is wiped out by about $5k of value loss. Plan a longer hold.
Negotiation context
- It's been on market 19 days — a 2% lower offer ($177k) is reasonable based on typical stale-listing flexibility.
Questions for the listing agent
- Is there a deadline driving the sale (1031 exchange, divorce, estate, relocation)? That informs how much negotiation room exists.
- Schools are F-rated, which usually means shorter tenancies and higher turnover. Who's the typical renter profile here, and what's been the actual vacancy rate?
- The area grade is low — what's the realistic commute time and amenity access for the typical tenant pool here? Any planned neighborhood developments (good or bad) we should know about?
- What's the average days-on-market for RENTAL listings here right now (not sales)? A rising rental-DOM trend means longer vacancies and softer asking-rent achievability than the comps imply.
- What's the recent tenant-quality profile in this submarket — average credit score on applications, eviction rate, late-payment / NSF rate, and stable-employment percentage? A property-management company in the area should have these aggregated.
- How much new for-sale + rental construction is in the pipeline within 1–3 miles? Heavy new supply typically softens prices + rents 12–24 months out; constrained supply supports both.
Investment metrics
- 1% rule
- 0.81% ✗
- Cap rate
- 6.92%
- Cash-on-cash
- 2.24%
- DSCR
- 1.10
- GRM
- 10.3
CMA / ARV
No comps found within radius.
Projected returns pro-forma
-3.0% appreciation · 3.0% rent growth · sell at horizon
- IRR
- -12.8%
- Equity multiple
- 0.54×
- Total profit
- $-23,259
- Equity at exit
- $26,839
- IRR
- -3.9%
- Equity multiple
- 0.74×
- Total profit
- $-12,904
- Equity at exit
- $15,563
Cash invested: $50,400 (down + closing). Projections, not guarantees.
Landlord ↔ Tenant lean methodology
- Overall (STATE)
- 81 Strongly Landlord-Friendly
- State Missouri
- 81 Strongly Landlord-Friendly · R+10
- County
- — inherits STATE
- City
- — inherits STATE
ZIP-level market 63383
- Home prices YoY
- -28.9%
- Active inventory
- 177
- Price-to-rent
- 10.3×
Monthly cashflow live
- Estimated rent
- $1,456 medium interval (Pro) →
- Mortgage (P&I)
- −$944
- Tax from tax record
- −$37 /mo · $440/yr
- Insurance
- −$75
- HOA
- −$0
- Vacancy / Maint / Mgmt
- −$306
- Net cashflow
- $94
Break-even live
Sensitivity live
| Price | -10% $196 | -5% $145 | +0% $94 | +5% $43 | +10% $-8 |
|---|---|---|---|---|---|
| Rent | -10% $-21 | -5% $37 | +0% $94 | +5% $152 | +10% $209 |
| Rate | -1.0pp $185 | -0.5pp $140 | base $94 | +0.5pp $48 | +1.0pp $0 |
UW: 25.0% down · 7.5% · 30yr · 1.5% tax · 5.0% vac · 8.0% maint · 8.0% mgmt
Financing live
Cash to close
- Down payment
- $45,000
- Closing costs
- $5,400
- Reserves months
- —
- Total cash needed
- —
Loan-product check · same deal, 3 products live
Conventional
25% down · 7.5% · 30yr
- Down + closing
- —
- Monthly P&I
- —
- Monthly cashflow
- —
- DSCR
- —
- Eligible?
- —
Personal DTI + credit; lowest rate.
DSCR
20% down · 8.5% · 30yr
- Down + closing
- —
- Monthly P&I
- —
- Monthly cashflow
- —
- DSCR
- —
- Eligible?
- —
No personal income docs; deal must DSCR.
Hard money
10% down · 12.0% · 12mo
- Down + closing
- —
- Monthly P&I
- —
- Monthly cashflow
- —
- DSCR
- —
- Eligible?
- —
Short-term bridge; refi at stabilization.
Listing history 12 events
-
2026-06-21days on market $180,000 Active 19 DOM
-
2026-06-18days on market $180,000 Active 16 DOM
-
2026-06-17status $180,000 Active 15 DOM
-
2026-06-17days on market $180,000 Active Under Contract 15 DOM
-
2026-06-16days on market $180,000 Active Under Contract 14 DOM
-
2026-06-15days on market $180,000 Active Under Contract 13 DOM
-
2026-06-13days on market $180,000 Active Under Contract 11 DOM
-
2026-06-09days on market $180,000 Active Under Contract 7 DOM
-
2026-06-08days on market $180,000 Active Under Contract 6 DOM
-
2026-06-07statusdays on market $180,000 Active Under Contract 5 DOM
-
2026-06-03remarks 699-char remark
-
2026-06-03$180,000 Active 1 DOM
ⓘ Source: listings_history table (triggers on properties + properties_extension) + one-shot
backfill from property_details.listing_events for pre-trigger history.
Tax reassessment forecast MO · Resets to sale price
- Current annual tax
- $440 · $37/mo
- Projected year-2 tax
- $1,746 · $146/mo
- Expected delta
- +$1,306/yr (+$109/mo · 296.9%)
ⓘ Screening estimate from a state-policy table — verify with the county assessor before closing.
Climate risk First Street
- Flood 1/10 Low FEMA zone X (unshaded) · 0% chance over 30 yrs
- Wildfire 4/10 Moderate
- Heat 3/10 Moderate 7 d/yr ≥106°F today · 20 d/yr by 30 yrs out
- Wind 2/10 Low 100% chance of damaging wind over 30 yrs
- Air quality 2/10 Low 0 unhealthy d/yr today · 1 by 30 yrs out
Nearby sold comps map
Loading sold comps map…
Walkable amenities ~0.75 mi
Loading nearby amenities…
Taxation est. · year 1
- Rental income
- $17,466
- − Mortgage interest
- −$10,083
- − Property taxes
- −$440
- − Insurance
- −$900
- − Repairs & maintenance
- −$1,397
- − Management
- −$1,397
- − Depreciation
- −$5,236
- Taxable loss
- −$1,988
- Est. tax savings @ 24.0%
- +$477
- After-tax cash flow
- $1,608/yr
For passive investors: Depreciation is non-cash, so a rental often shows a tax loss while cash-flowing — sheltering income. Rental losses are passive: they offset passive income freely, and up to $25,000/yr can offset ordinary (W-2) income if you actively participate and your MAGI is under $100k (phasing out to $0 by $150k); unused losses carry forward. On sale, claimed depreciation is recaptured at up to 25%, and gains may owe capital-gains tax (a 1031 exchange can defer both). Figures are a year-1 estimate at your 24.0% rate — not tax advice; consult a CPA.
Schools (NCES district)
- District
- Warren County R-III
- NCES district ID
- 2931050
- Math proficiency
- 30% ▼ -12.00%
- Reading proficiency
- 46% ▼ -4.00%
- Median HH income
- $47,644
- Composite
- 32.55/100
- National rank
- #5690
- State rank
- #172 of 324 in MO
Livability — Pendleton
- Score
- 58/100
- State rank
- #607
- US rank
- #21234
Category grades
Schools grade is shown separately in the Schools card above.
Census & demographics
- Population (ZIP)
- 16,120
Population outlook (Warren County) Hauer SSP2
- Today (2025)
- 35,105 people
- By 2030
- 35,605 · +1.4%
- By 2040
- 36,047 · +2.7%
- By 2050
- 35,479 · +1.1%
- By 2075
- 33,325 · -5.1%
- By 2100
- 28,282 · -19.4%
Race, ethnicity, and origin ACS 2023
- Neighborhood character
- Predominantly White (91%)
- Race & ethnicity
- White 91% Two or more races 6% Hispanic / Latino 4%
- Common ancestry
- Italian 6% Lithuanian 3% Iranian 1%
- Foreign-born
- 0%
- Languages at home
- 98% English-only · Spanish 1%
Political lean MEDSL · Warren
- 2024 margin
- Solid R (+49.5) · D 24.7% · R 74.2% · Other 1.0%
- 2008→2024 swing
- -36.9pp toward R · 2008: -12.6pp · 2024: -49.5pp
- All cycles
- 2024: R+49.5 2020: R+46.0 2016: R+45.6 2012: R+26.8 2008: R+12.6
Not yet ingested
- Civics
- —
Market trends
- HPI YoY
- ▼ -77.56%
- Current HPI
- 191.2467
- Rent YoY
- —
- Metro
- —
- State GDP YoY
- ▲ 1.84%
- F500 in state
- 20
Industry mix (Fortune 500 HQ in MO)
| Industry | F500 HQs | Revenue |
|---|---|---|
| Healthcare | 1 | $163B |
|
||
| Insurance | 1 | $21B |
|
||
| Industrial Technology | 1 | $17B |
|
||
| Retail | 1 | $16B |
|
||
| Industrial Distribution | 1 | $10B |
|
||
| Utilities | 1 | $9B |
|
||
Price history
+0.0% since first listed2 events — show timeline
- 2026-06-03 Listed $180,000 MARIS as Distributed by MLS Grid
- 2026-06-03 Coming Soon $180,000 MARIS as Distributed by MLS Grid
Property tax history
+2.6%/yrLatest (2025): $440 · +16.0% YoY. Source: county tax records.
Cash-flow waterfall
monthlySold comps — $/sqft
last 12 mo · ≤1 miLoading sold comps…