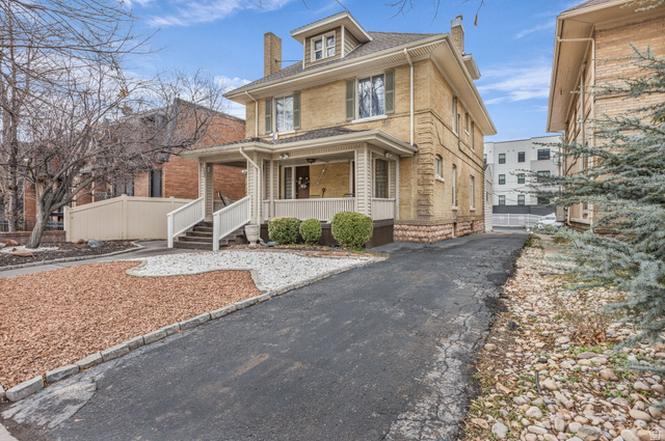
 6-Plex
732 E 100 S · Salt Lake City, UT
Flood risk 1/10 · Minimal
- FEMA flood zone
- X (unshaded)
- Chance of flooding over 30 yrs
- 0.0%
- Est. flood insurance / yr
- $507 – $1,088
Fire risk 3/10 · Minor
- Est. fire insurance / yr
- $453 – $841
Heat risk 4/10 · Minor
- Hot days now (above 94°F)
- 7 days/yr
- Hot days in 30 yrs
- 19 days/yr
Wind risk 1/10 · Minimal
- Chance of severe wind over 30 yrs
- —
Air-quality risk 4/10 · Minor
- Unhealthy air days now
- 5 days/yr
- Unhealthy air days in 30 yrs
- 7 days/yr
Risk factors via First Street. Map © Google.
Why this score? — see what drove the D grade
The composite is a weighted blend of 9 inputs, each scored 0–100. Each bar is that input's sub-score; the figure is the points it added to the 100-point composite (weight × sub-score).
- Cash flow +14.2/30.0
- ARV discount +7.5/15.0
- DSCR +4.3/10.0
- 1% rule +4.0/10.0
- Livability +3.8/5.0
- Rent growth +3.0/5.0
- Schools +2.9/10.0
- Condition / age +2.5/5.0
- Appreciation +0.0/10.0
$1,425,000
🖨 Deal sheet 📄 Offer letter ✓ Due diligence
Multi-family units
County records classify this as Multi-Family (5+ Unit). Listing-text estimate: 6 units. confirmed
5+ unit building — per-unit beds/baths from public records are typically unavailable; the breakdown below (if shown) is an estimate from the listing text.
Listing remarks MLS
There are no remarks available.
Key facts
- 6 unit apartment
- Updated bathrooms
- Downtown location
Tags
Property features AI
Finance
- Other: Property condition: Built/Standing
- Financial info: Multi-family zoning (RMF35); 6 total residential units with current rents reported for individual units
Exterior
- Parking: Uncovered open parking; 7 open parking spaces (total 7 spaces)
- Utilities: Natural gas connected; Electricity connected; Sewer connected (public); Culinary water connected
- Home design: 3-story building; Faces north; Used for residential/multi-family
- Construction: Built in 1974; Aluminum and brick construction; Asphalt and membrane roof
- Exterior features: Double pane windows; Open porch; Partially fenced yard; Automatic full sprinkler system
Interior
- Kitchen: Updated kitchen
- Bedrooms: Property includes multiple residential units (6 total)
- Flooring: Carpet; Tile
- Heating & cooling: Electric heating; Central gas heating; Radiant gas heating
- Interior features: Updated kitchen; Blinds on windows
Neighborhood map
What this means for you Summary
Snapshot
- This is a 6 × 7-bed/6.0-bath units multifamily listed at $1.43M.
Deal economics
- At list price, monthly cash flow is $232 ($3k/yr) — positive. Per door: $39/mo.
- The deal already cash-flows at list — no discount required.
- To meet the 1% rule (rent ≥ 1% of price), the offer needs to be $1.28M (10.5% below list).
- Recommended offer: $1.28M (10.5% below list) — sets the bar for 1% rule.
Location & tenants
- Location reads 75/100 on livability (#64 in UT, #3,994 nationally) — a middle-class / working-renter tenant base. Strengths: amenities A+, commute A+, housing A; Watch: cost of living D+, crime F.
- Salt Lake District (urban): math 30% / reading 37% proficiency, ranked #65 of 80 in UT (top 81%) — families likely to look elsewhere, expect single-tenant / working-renter base with shorter leases.
- Zoned schools: M. Lynn Bennion School (math 8% / reading 12%, grade F, #577 of 585 statewide, top 99%, 175 students, 100% FRL); Salt Lake Center For Science Education Bryant (math 14% / reading 29%, grade F, #125 of 138 statewide, top 91%, 407 students, 64% FRL); East High (math 17% / reading 36%, grade F, #136 of 171 statewide, top 79%, 1,886 students, 51% FRL).
- Zoned-school proficiency averages 19% at this address vs 34% district-wide (-14 pts) — the specific schools serving this property underperform the Salt Lake District average; the district grade overstates school quality for this exact location.
- Market conditions: Rents rising (+2.0%/yr); 133 active listings in the ZIP; 4,970 units permitted in Salt Lake County in 2024 (1,963 in 5+ unit buildings).
- At $12,759/mo this rent would consume 293% of the median local household income ($52k/yr) (locally 2450% of renters already pay >50% of income on rent) — very limited rent-growth headroom before tenants either downsize or default.
Forward outlook
- Local home prices are declining (-3.0%/yr); year-one equity from $10k of loan paydown is wiped out by about $43k of value loss. Plan a longer hold.
- Salt Lake County population projected at +37% by 2050 — long-run rental-demand tailwind backs the buy-and-hold thesis.
Negotiation context
- It's been on market 107 days — a 9% lower offer ($1.30M) is reasonable based on typical stale-listing flexibility.
- 9 sale attempts since 27y ago; this cycle's ask has dropped $75k (5%) from the opening price — seller is motivated, your offer sets the floor, not the list.
Risks & watch-outs
- Watch-outs: built in 1901 — expect roof / HVAC / electrical / plumbing capex.
Questions for the listing agent
- It's been on market 107 days. Have you received any prior offers? Is the seller open to a 10% concession, seller financing, or rate buy-down credit?
- Can we see the unit-by-unit rent roll, current vacancy, and any below-market leases? What's the average tenancy length?
- What capital expenditures (roof, boiler, parking lot, exteriors) have been made in the last 5 years, and what's planned in the next 2?
- Built in 1901 — when were the roof, HVAC, electrical panel, plumbing, and water heater last replaced?
- Why hasn't it sold? Are there any deal-killer items the seller is aware of (foundation, flood, title, zoning, code violations)?
- Is there a deadline driving the sale (1031 exchange, divorce, estate, relocation)? That informs how much negotiation room exists.
- Crime grade is F in this area — have there been break-ins, vandalism, or insurance claims at this property in the last 3 years? What carrier currently insures it and at what premium?
- The area grade is low — what's the realistic commute time and amenity access for the typical tenant pool here? Any planned neighborhood developments (good or bad) we should know about?
- What's the average days-on-market for RENTAL listings here right now (not sales)? A rising rental-DOM trend means longer vacancies and softer asking-rent achievability than the comps imply.
- What's the recent tenant-quality profile in this submarket — average credit score on applications, eviction rate, late-payment / NSF rate, and stable-employment percentage? A property-management company in the area should have these aggregated.
- How much new apartment / multifamily construction is in the pipeline within 1–3 miles? Heavy new supply (>2% of stock underway) typically softens rents 12–24 months out; light construction supports rent growth.
Investment metrics
- 1% rule
- 0.90% ✗
- Cap rate
- 6.49%
- Cash-on-cash
- 0.70%
- DSCR
- 1.03
- GRM
- 9.3
CMA / ARV
No comps found within radius.
Projected returns pro-forma
-3.0% appreciation · 2.02% rent growth · sell at horizon
- IRR
- -16.3%
- Equity multiple
- 0.43×
- Total profit
- $-228,418
- Equity at exit
- $212,472
- IRR
- -9.8%
- Equity multiple
- 0.43×
- Total profit
- $-229,242
- Equity at exit
- $123,208
Cash invested: $399,000 (down + closing). Projections, not guarantees.
Landlord ↔ Tenant lean methodology
- Overall (STATE)
- 86 Strongly Landlord-Friendly
- State Utah
- 86 Strongly Landlord-Friendly · R+15
- County
- — inherits STATE
- City
- — inherits STATE
ZIP-level market 84102
- Rents YoY
- 2.0%
- Active inventory
- 133
- Price-to-rent
- 55.8×
Monthly cashflow live
- Estimated rent
- $12,759 medium interval (Pro) →
- Mortgage (P&I)
- −$7,473
- Tax est. 1.5%
- −$1,781 /mo · $21,375/yr
- Insurance
- −$594
- HOA
- −$0
- Vacancy / Maint / Mgmt
- −$2,679
- Net cashflow
- $232
Break-even live
6-unit breakdown (identical units grouped — click to expand)
| Units | Beds | Baths | Est. rent |
|---|---|---|---|
| 6× units | 7 | 6 | $12,762 |
| #1 | 7 | 6 | $2,127 |
| #2 | 7 | 6 | $2,127 |
| #3 | 7 | 6 | $2,127 |
| #4 | 7 | 6 | $2,127 |
| #5 | 7 | 6 | $2,127 |
| #6 | 7 | 6 | $2,127 |
| Total (6 units) | $12,759 | ||
UW: 25.0% down · 7.5% · 30yr · 1.5% tax · 5.0% vac · 8.0% maint · 8.0% mgmt
Financing live
Cash to close
- Down payment
- $356,250
- Closing costs
- $42,750
- Reserves months
- —
- Total cash needed
- —
Loan-product check · same deal, 3 products live
Conventional
25% down · 7.5% · 30yr
- Down + closing
- —
- Monthly P&I
- —
- Monthly cashflow
- —
- DSCR
- —
- Eligible?
- —
Personal DTI + credit; lowest rate.
DSCR
20% down · 8.5% · 30yr
- Down + closing
- —
- Monthly P&I
- —
- Monthly cashflow
- —
- DSCR
- —
- Eligible?
- —
No personal income docs; deal must DSCR.
Hard money
10% down · 12.0% · 12mo
- Down + closing
- —
- Monthly P&I
- —
- Monthly cashflow
- —
- DSCR
- —
- Eligible?
- —
Short-term bridge; refi at stabilization.
Listing history 39 events
-
2026-06-18days on market $1,425,000 Active 107 DOM
-
2026-06-17days on market $1,425,000 Active 106 DOM
-
2026-06-16days on market $1,425,000 Active 105 DOM
-
2026-06-15days on market $1,425,000 Active 104 DOM
-
2026-06-13days on market $1,425,000 Active 102 DOM
-
2026-06-13days on market $1,425,000 Active 101 DOM
-
2026-06-09days on market $1,425,000 Active 98 DOM
-
2026-06-08days on market $1,425,000 Active 97 DOM
-
2026-06-07days on market $1,425,000 Active 96 DOM
-
2026-06-05days on market $1,425,000 Active 93 DOM
-
2026-06-03days on market $1,425,000 Active 92 DOM
-
2026-06-02days on market $1,425,000 Active 91 DOM
-
2026-06-01days on market $1,425,000 Active 90 DOM
-
2026-05-31days on market $1,425,000 Active 89 DOM
-
2026-04-10price $1,425,000
-
2026-03-02$1,500,000 Active
-
2017-08-31soldstatus Sold 31-char remark
Show marketing remark (31 chars)
There are no remarks available.
-
2017-07-17status Under Contract 31-char remark
Show marketing remark (31 chars)
There are no remarks available.
-
2017-06-30$750,000 Active 31-char remark
Show marketing remark (31 chars)
There are no remarks available.
-
2012-09-24soldstatus 31-char remark
Show marketing remark (31 chars)
There are no remarks available.
-
2012-01-06$349,900 31-char remark
Show marketing remark (31 chars)
There are no remarks available.
-
2011-12-20historical
-
2011-06-20$364,900
-
2005-12-07soldstatus
-
2005-12-02soldstatus
-
2005-10-21$465,000
-
2005-10-19soldstatus
-
2005-08-26soldstatus
-
2005-08-24soldstatus
-
2005-07-06$297,000
-
2005-07-03historical
-
2005-01-03$319,900
-
2004-12-19historical
-
2004-06-19$319,900
-
2002-02-19soldstatus
-
2000-03-31historical
-
1999-07-02$325,000
-
1996-09-09soldstatus
-
1995-08-28soldstatus
ⓘ Source: listings_history table (triggers on properties + properties_extension) + one-shot
backfill from property_details.listing_events for pre-trigger history.
Climate risk First Street
- Flood 1/10 Low FEMA zone X (unshaded) · 0% chance over 30 yrs
- Wildfire 3/10 Moderate
- Heat 4/10 Moderate 7 d/yr ≥94°F today · 19 d/yr by 30 yrs out
- Wind 1/10 Low
- Air quality 4/10 Moderate 5 unhealthy d/yr today · 7 by 30 yrs out
Nearby sold comps map
Loading sold comps map…
Walkable amenities ~0.75 mi
Loading nearby amenities…
Taxation est. · year 1
- Rental income
- $153,108
- − Mortgage interest
- −$79,822
- − Property taxes
- −$21,375
- − Insurance
- −$7,125
- − Repairs & maintenance
- −$12,249
- − Management
- −$12,249
- − Depreciation
- −$41,455
- Taxable loss
- −$21,166
- Est. tax savings @ 24.0%
- +$5,080
- After-tax cash flow
- $7,861/yr
For passive investors: Depreciation is non-cash, so a rental often shows a tax loss while cash-flowing — sheltering income. Rental losses are passive: they offset passive income freely, and up to $25,000/yr can offset ordinary (W-2) income if you actively participate and your MAGI is under $100k (phasing out to $0 by $150k); unused losses carry forward. On sale, claimed depreciation is recaptured at up to 25%, and gains may owe capital-gains tax (a 1031 exchange can defer both). Figures are a year-1 estimate at your 24.0% rate — not tax advice; consult a CPA.
Schools (NCES district)
- District
- Salt Lake District
- NCES district ID
- 4900870
- Math proficiency
- 30% ▼ -13.00%
- Reading proficiency
- 37% ▼ -6.00%
- Median HH income
- $47,550
- Composite
- 28.85/100
- National rank
- #6645
- State rank
- #65 of 80 in UT
Livability — Salt Lake City
- Score
- 75/100
- State rank
- #64
- US rank
- #3994
Category grades
Schools grade is shown separately in the Schools card above.
Census & demographics
- Census place
- Salt Lake City, UT
- County
- Salt Lake County · 1,195,750 people
- City population
- 172,615
- Metro
- Salt Lake City, UT
- Population (ZIP)
- 18,777
- Household income
- $52,199
- Rent vs Own
- Severe rent burden
- 2450.0
Population outlook (Salt Lake County) Hauer SSP2
- Today (2025)
- 1,305,860 people
- By 2030
- 1,402,611 · +7.4%
- By 2040
- 1,594,533 · +22.1%
- By 2050
- 1,787,244 · +36.9%
- By 2075
- 2,224,138 · +70.3%
- By 2100
- 2,551,390 · +95.4%
Race, ethnicity, and origin ACS 2023
- Neighborhood character
- Predominantly White (76%)
- Race & ethnicity
- White 76% Hispanic / Latino 9% Two or more races 8% Asian 7% Black 2%
- Hispanic origin (detail)
- Mexican 5% Puerto Rican 1%
- Common ancestry
- Italian 5% Slovak 4% Lithuanian 3%
- Foreign-born
- 11% · Canada, China
- Languages at home
- 85% English-only · Spanish 6% Chinese 3% Other Indo-European 2%
Political lean MEDSL · Salt Lake
- 2024 margin
- D (+10.2) · D 53.7% · R 43.5% · Other 2.8%
- 2008→2024 swing
- +10.1pp toward D · 2008: 0.1pp · 2024: 10.2pp
- All cycles
- 2024: D+10.2 2020: D+11.0 2016: D+10.2 2012: R+19.3 2008: D+0.1
Not yet ingested
- Civics
- —
Market trends
- HPI YoY
- ▼ -316.89%
- Current HPI
- 343.2303
- Rent YoY
- ▲ 2.02%
- Metro
- Salt Lake City, UT
- State GDP YoY
- ▲ 3.54%
- F500 in state
- 2
Industry mix (Fortune 500 HQ in UT)
| Industry | F500 HQs | Revenue |
|---|---|---|
| Financial Services | 1 | $3B |
|
||
Price history
+338.5% since first listed25 events — show timeline
- 2026-04-10 Price Changed $1,425,000 WFRMLS
- 2026-03-02 Listed $1,500,000 WFRMLS
- 2017-08-31 Sold (MLS) — WFRMLS
- 2017-07-17 Pending — WFRMLS
- 2017-06-30 Listed $750,000 WFRMLS
- 2012-09-24 Sold (MLS) — WFRMLS
- 2012-01-06 Listed $349,900 WFRMLS
- 2011-12-20 Listing Removed — WFRMLS
- 2011-06-20 Listed $364,900 WFRMLS
- 2005-12-07 Sold (MLS) — WFRMLS
- 2005-12-02 Sold (Public Records) — Public Records
- 2005-10-21 Listed $465,000 WFRMLS
- 2005-10-19 Sold (Public Records) — Public Records
- 2005-08-26 Sold (Public Records) — Public Records
- 2005-08-24 Sold (MLS) — WFRMLS
- 2005-07-06 Listed $297,000 WFRMLS
- 2005-07-03 Listing Removed — WFRMLS
- 2005-01-03 Listed $319,900 WFRMLS
- 2004-12-19 Listing Removed — WFRMLS
- 2004-06-19 Listed $319,900 WFRMLS
- 2002-02-19 Sold (Public Records) — Public Records
- 2000-03-31 Listing Removed — WFRMLS
- 1999-07-02 Listed $325,000 WFRMLS
- 1996-09-09 Sold (Public Records) — Public Records
- 1995-08-28 Sold (Public Records) — Public Records
Property tax history
-44.9%/yrLatest (2025): $6 · -98.8% YoY. Source: county tax records.
Cash-flow waterfall
monthlySold comps — $/sqft
last 12 mo · ≤1 miLoading sold comps…