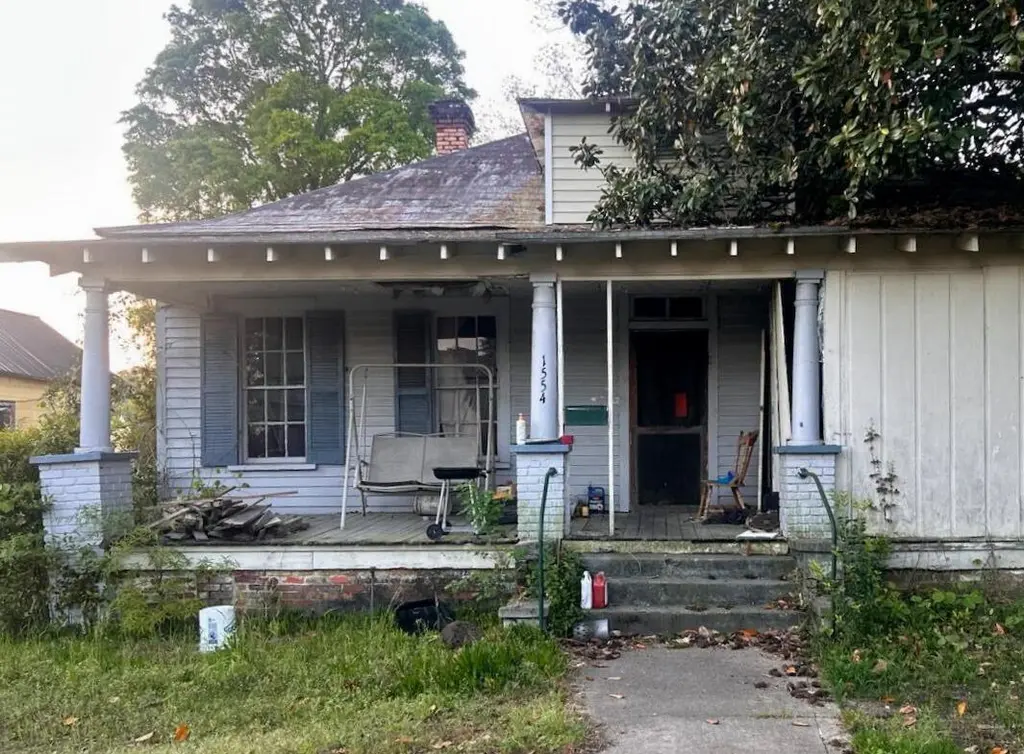
1554 Glover St · Orangeburg, SC
Flood risk 1/10 · Minimal
- FEMA flood zone
- X (unshaded)
- Chance of flooding over 30 yrs
- 0.0%
- Est. flood insurance / yr
- $507 – $1,088
Fire risk 4/10 · Minor
- Est. fire insurance / yr
- $783 – $1,453
Heat risk 7/10 · Major
- Hot days now (above 108°F)
- 7 days/yr
- Hot days in 30 yrs
- 17 days/yr
Wind risk 8/10 · Major
- Chance of severe wind over 30 yrs
- 80.0%
Air-quality risk 3/10 · Minor
- Unhealthy air days now
- 3 days/yr
- Unhealthy air days in 30 yrs
- 3 days/yr
Risk factors via First Street. Map © Google.
Why this score? — see what drove the B grade
The composite is a weighted blend of 9 inputs, each scored 0–100. Each bar is that input's sub-score; the figure is the points it added to the 100-point composite (weight × sub-score).
- Cash flow +30.0/30.0
- 1% rule +10.0/10.0
- DSCR +10.0/10.0
- ARV discount +7.5/15.0
- Schools +5.0/10.0
- Livability +2.7/5.0
- Rent growth +2.5/5.0
- Condition / age +2.5/5.0
- Appreciation +0.0/10.0
$35,000
🖨 Deal sheet 📄 Offer letter ✓ Due diligence
Listing remarks
Investor Special in Orangeburg! Conveniently located in Orangeburg near local amenities. This 3-bedroom, 1.5-bath home having 1,954 sq. ft. of living space and is a prime candidate for a full renovation. The property is in overall distressed condition and will require repairs and updates throughout. The home features a crawl/raised foundation and a fireplace, providing a solid starting point for a renovation project. The property will need improvements to bring it to full functionality and market standards. This is a value-add opportunity suited for investors or rehabbers looking for a project with upside. With the right scope of work and execution, the property has strong potential for res
Key facts
- Full renovation
- Fireplace
- 0.31 acre lot
Tags
Property features AI
Exterior
- Utilities: Public sewer
- Home design: Residential single-family detached
- Construction: No other structures
- Exterior features: Other exterior features
Interior
- Bedrooms: 3 bedrooms
- Bathrooms: 2 bathrooms
- Heating & cooling: Forced air heating; Heating: see remarks; Other cooling
- Interior features: Family room; Other interior features
Neighborhood map
What this means for you Summary
Snapshot
- This is a 3-bed/2.0-bath single-family listed at $35k.
Deal economics
- At list price, monthly cash flow is $838 ($10k/yr) — positive.
- The deal already cash-flows at list — no discount required.
- Meets the 1% rule at list price ($1k rent vs $35k).
- Recommended offer: $34k (3.0% below list) — sets the bar for market timing.
- Cap rate 35.0% vs local median 4.2% in Orangeburg — top-decile yield for the area; either an underpriced asset or a hidden risk that comps aren't pricing in. Stress-test before assuming the spread holds.
Location & tenants
- Location reads 54/100 on livability (#324 in SC) — a working-class tenant base; expect higher turnover. Strengths: cost of living A+, health & safety B; Watch: housing C-, crime F, amenities D-.
- Zoned schools: Mellichamp Elementary (math 34%, 204 students, 100% FRL); William J. Clark Middle (math 12%, 687 students, 100% FRL); Orangeburg Wilkinson High (math 22%, 1,073 students, 100% FRL).
- Market conditions: 226 active listings in the ZIP; 87 units permitted in Orangeburg County in 2024 (0 in 5+ unit buildings).
Forward outlook
- Local home prices are declining (-3.0%/yr); year-one equity from $242 of loan paydown is wiped out by about $1k of value loss. Plan a longer hold.
- Orangeburg County population projected at -27% by 2050 — secular population decline; favor cash flow + early exit over multi-decade hold.
- At projected returns (-3.0% appreciation + 3.0% rent growth), your $10k cash investment doubles in ~2 years — after that, you're playing with house money.
Negotiation context
- It's been on market 35 days — a 3% lower offer ($34k) is reasonable based on typical stale-listing flexibility.
Risks & watch-outs
- Watch-outs: built in 1920 — expect roof / HVAC / electrical / plumbing capex.
- Climate carrying-cost: severe wind risk, 80% chance of damaging wind over 30y; extreme-heat days projected 7→17/yr by 2055 (HVAC capex compounding) — expect insurance premiums to compound above CPI over the hold.
Questions for the listing agent
- It's been on market 35 days. Have you received any prior offers? Is the seller open to a 3% concession, seller financing, or rate buy-down credit?
- Built in 1920 — when were the roof, HVAC, electrical panel, plumbing, and water heater last replaced?
- Is there a deadline driving the sale (1031 exchange, divorce, estate, relocation)? That informs how much negotiation room exists.
- Schools are F-rated, which usually means shorter tenancies and higher turnover. Who's the typical renter profile here, and what's been the actual vacancy rate?
- Crime grade is F in this area — have there been break-ins, vandalism, or insurance claims at this property in the last 3 years? What carrier currently insures it and at what premium?
- What's the average days-on-market for RENTAL listings here right now (not sales)? A rising rental-DOM trend means longer vacancies and softer asking-rent achievability than the comps imply.
- What's the recent tenant-quality profile in this submarket — average credit score on applications, eviction rate, late-payment / NSF rate, and stable-employment percentage? A property-management company in the area should have these aggregated.
- How much new for-sale + rental construction is in the pipeline within 1–3 miles? Heavy new supply typically softens prices + rents 12–24 months out; constrained supply supports both.
Investment metrics
- 1% rule
- 3.91% ✓
- Cap rate
- 35.04%
- Cash-on-cash
- 102.67%
- DSCR
- 5.57
- GRM
- 2.1
CMA / ARV
- ARV (on-the-fly)
- $115,286
- Comps found
- 3
Show comp detail 3 sales within ~0.75 mi
| Address | Dist | Beds/Ba | Sqft | Sold | Price | $/sf | Match |
|---|---|---|---|---|---|---|---|
| 260 Green St | 0.53mi | 3/2.0 | 1,959 (+0%) | 10mo | $115,000 | $59 | 67 |
| 521 Bayne St | 0.43mi | 4/2.0 (+1) | 2,100 (+8%) | 1mo | $199,000 | $95 | 62 |
| 232 Treadwell St | 0.44mi | 3/2.0 | 1,706 (-13%) | 10mo | $89,000 | $52 | 50 |
Match score weights: distance 35% · size 25% · config 20% · recency 20%. Top-matched comps best support the ARV.
Projected returns pro-forma
-3.0% appreciation · 3.0% rent growth · sell at horizon
- IRR
- —
- Equity multiple
- 5.87×
- Total profit
- $47,750
- Equity at exit
- $5,219
- IRR
- —
- Equity multiple
- 12.27×
- Total profit
- $110,427
- Equity at exit
- $3,026
Cash invested: $9,800 (down + closing). Projections, not guarantees.
Landlord ↔ Tenant lean methodology
- Overall (STATE)
- 90 Strongly Landlord-Friendly
- State South Carolina
- 90 Strongly Landlord-Friendly · R+6
- County
- — inherits STATE
- City
- — inherits STATE
ZIP-level market 29115
- Home prices YoY
- -27.3%
- Active inventory
- 226
- Price-to-rent
- 2.1×
Monthly cashflow live
- Estimated rent
- $1,368 medium interval (Pro) →
- Mortgage (P&I)
- −$184
- Tax est. 1.5%
- −$44 /mo · $525/yr
- Insurance
- −$15
- HOA
- −$0
- Vacancy / Maint / Mgmt
- −$287
- Net cashflow
- $838
Break-even live
UW: 25.0% down · 7.5% · 30yr · 1.5% tax · 5.0% vac · 8.0% maint · 8.0% mgmt
Financing live
Cash to close
- Down payment
- $8,750
- Closing costs
- $1,050
- Reserves months
- —
- Total cash needed
- —
Loan-product check · same deal, 3 products live
Conventional
25% down · 7.5% · 30yr
- Down + closing
- —
- Monthly P&I
- —
- Monthly cashflow
- —
- DSCR
- —
- Eligible?
- —
Personal DTI + credit; lowest rate.
DSCR
20% down · 8.5% · 30yr
- Down + closing
- —
- Monthly P&I
- —
- Monthly cashflow
- —
- DSCR
- —
- Eligible?
- —
No personal income docs; deal must DSCR.
Hard money
10% down · 12.0% · 12mo
- Down + closing
- —
- Monthly P&I
- —
- Monthly cashflow
- —
- DSCR
- —
- Eligible?
- —
Short-term bridge; refi at stabilization.
Listing history 5 events
-
2026-05-18status Pending
-
2026-05-06price $35,000
-
2026-04-30price $39,900
-
2026-04-22price $44,900
-
2026-04-13$49,900 Active
ⓘ Source: listings_history table (triggers on properties + properties_extension) + one-shot
backfill from property_details.listing_events for pre-trigger history.
Climate risk First Street
- Flood 1/10 Low FEMA zone X (unshaded) · 0% chance over 30 yrs
- Wildfire 4/10 Moderate
- Heat 7/10 Severe 7 d/yr ≥108°F today · 17 d/yr by 30 yrs out
- Wind 8/10 Severe 80% chance of damaging wind over 30 yrs
- Air quality 3/10 Moderate 3 unhealthy d/yr today · 3 by 30 yrs out
Nearby sold comps map
Loading sold comps map…
Walkable amenities ~0.75 mi
Loading nearby amenities…
Taxation est. · year 1
- Rental income
- $16,410
- − Mortgage interest
- −$1,961
- − Property taxes
- −$525
- − Insurance
- −$175
- − Repairs & maintenance
- −$1,313
- − Management
- −$1,313
- − Depreciation
- −$1,018
- Taxable income
- $10,106
- Est. tax owed @ 24.0%
- −$2,425
- After-tax cash flow
- $7,636/yr
For passive investors: Depreciation is non-cash, so a rental often shows a tax loss while cash-flowing — sheltering income. Rental losses are passive: they offset passive income freely, and up to $25,000/yr can offset ordinary (W-2) income if you actively participate and your MAGI is under $100k (phasing out to $0 by $150k); unused losses carry forward. On sale, claimed depreciation is recaptured at up to 25%, and gains may owe capital-gains tax (a 1031 exchange can defer both). Figures are a year-1 estimate at your 24.0% rate — not tax advice; consult a CPA.
Schools (NCES district)
No district data.
Livability — Orangeburg
- Score
- 54/100
- State rank
- #324
- US rank
- #23942
Category grades
Schools grade is shown separately in the Schools card above.
Census & demographics
- Census place
- Orangeburg, SC
- City population
- 15,135
- Population (ZIP)
- 27,179
Population outlook (Orangeburg County) Hauer SSP2
- Today (2025)
- 82,698 people
- By 2030
- 78,615 · -4.9%
- By 2040
- 69,308 · -16.2%
- By 2050
- 60,629 · -26.7%
- By 2075
- 42,678 · -48.4%
- By 2100
- 28,136 · -66.0%
Race, ethnicity, and origin ACS 2023
- Neighborhood character
- Predominantly Black (76%)
- Race & ethnicity
- Black 76% White 20% Hispanic / Latino 2% Two or more races 2%
- Foreign-born
- 2% · Canada
- Languages at home
- 97% English-only · Spanish 2%
Political lean MEDSL · Orangeburg
- 2024 margin
- Strong D (+24.6) · D 61.8% · R 37.2% · Other 1.1%
- 2008→2024 swing
- -13.5pp toward R · 2008: 38.1pp · 2024: 24.6pp
- All cycles
- 2024: D+24.6 2020: D+33.2 2016: D+37.0 2012: D+43.5 2008: D+38.1
Not yet ingested
- Civics
- —
Market trends
- HPI YoY
- ▼ -56.65%
- Current HPI
- 150.823
- Rent YoY
- —
- Metro
- —
- State GDP YoY
- ▲ 4.51%
- F500 in state
- 2
Industry mix (Fortune 500 HQ in SC)
| Industry | F500 HQs | Revenue |
|---|---|---|
| Packaging | 1 | $7B |
|
||
Price history
-29.9% since first listed5 events — show timeline
- 2026-05-18 Pending — Charleston Trident MLS
- 2026-05-06 Price Changed $35,000 Charleston Trident MLS
- 2026-04-30 Price Changed $39,900 Charleston Trident MLS
- 2026-04-22 Price Changed $44,900 Charleston Trident MLS
- 2026-04-13 Listed $49,900 Charleston Trident MLS
Property tax history
+43.9%/yrLatest (2024): $2,177 · +13.1% YoY. Source: county tax records.
Cash-flow waterfall
monthlySold comps — $/sqft
last 12 mo · ≤1 miLoading sold comps…