11020 Iowa Plz · Omaha, NE
Flood risk 1/10 · Minimal
- FEMA flood zone
- X
- Chance of flooding over 30 yrs
- 0.0%
- Est. flood insurance / yr
- $435 – $905
Fire risk 1/10 · Minimal
- Est. fire insurance / yr
- $1,161 – $2,155
Heat risk 3/10 · Minor
- Hot days now (above threshold)
- 7 days/yr
- Hot days in 30 yrs
- 16 days/yr
Wind risk No data
- Chance of severe wind over 30 yrs
- —
Air-quality risk 2/10 · Minimal
- Unhealthy air days now
- 0 days/yr
- Unhealthy air days in 30 yrs
- 1 days/yr
Risk factors via First Street. Map © Google.
Why this score? — see what drove the B- grade
The composite is a weighted blend of 9 inputs, each scored 0–100. Each bar is that input's sub-score; the figure is the points it added to the 100-point composite (weight × sub-score).
- Cash flow +30.0/30.0
- 1% rule +10.0/10.0
- DSCR +10.0/10.0
- ARV discount +7.5/15.0
- Livability +4.2/5.0
- Rent growth +2.5/5.0
- Condition / age +2.2/5.0
- Schools +2.1/10.0
- Appreciation +0.0/10.0
$80,000
🖨 Deal sheet 📄 Offer letter ✓ Due diligence
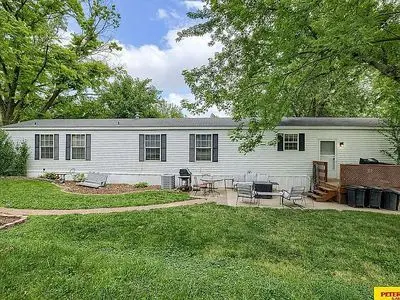
Listing remarks
Call today to see this 3 bedroom 2 bathroom home located in the Park Meadow trailer park. 605-354-5033
Key facts
- Built 2004
- Listed 29 days
Neighborhood map
What this means for you Summary
Snapshot
- This is a 3-bed/2.0-bath other listed at $80k. Condition is rated fair.
Deal economics
- At list price, monthly cash flow is $946 ($11k/yr) — positive.
- The deal already cash-flows at list — no discount required.
- Meets the 1% rule at list price ($2k rent vs $80k).
- Recommended offer: $79k (1.5% below list) — sets the bar for market timing.
- Cap rate 20.5% vs local median 3.6% in Omaha — top-decile yield for the area; either an underpriced asset or a hidden risk that comps aren't pricing in. Stress-test before assuming the spread holds.
Location & tenants
- Location reads 84/100 on livability (#7 in NE, #663 nationally) — a professional / high-income tenant draw. Strengths: amenities A+, commute A+, cost of living A+; Watch: crime F.
- Omaha Public Schools (urban): math 20% / reading 28% proficiency, ranked #110 of 111 in NE (top 99%) — low school quality limits family demand, transient renter base, plan for 1-2y turnover; 62% free/reduced lunch — lower-income household profile, screen leases tightly.
- Market conditions: 96 active listings in the ZIP; 12 comparable units currently listed for rent nearby; rentals leasing fast (median 3d on market — plan ~1-2 weeks tenant-placement turnaround); 4,539 units permitted in Douglas County in 2024 (2,583 in 5+ unit buildings).
Forward outlook
- Local home prices are declining (-3.0%/yr); year-one equity from $553 of loan paydown is wiped out by about $2k of value loss. Plan a longer hold.
- Douglas County population projected at +28% by 2050 — long-run rental-demand tailwind backs the buy-and-hold thesis.
- At projected returns (-3.0% appreciation + 3.0% rent growth), your $22k cash investment doubles in ~3 years — after that, you're playing with house money.
Negotiation context
- It's been on market 29 days — a 2% lower offer ($79k) is reasonable based on typical stale-listing flexibility.
Questions for the listing agent
- Have any recent inspections been done? Can we get a copy of the seller's disclosures and any deferred-maintenance estimates?
- Is there a deadline driving the sale (1031 exchange, divorce, estate, relocation)? That informs how much negotiation room exists.
- Crime grade is F in this area — have there been break-ins, vandalism, or insurance claims at this property in the last 3 years? What carrier currently insures it and at what premium?
- What's the average days-on-market for RENTAL listings here right now (not sales)? A rising rental-DOM trend means longer vacancies and softer asking-rent achievability than the comps imply.
- What's the recent tenant-quality profile in this submarket — average credit score on applications, eviction rate, late-payment / NSF rate, and stable-employment percentage? A property-management company in the area should have these aggregated.
- How much new for-sale + rental construction is in the pipeline within 1–3 miles? Heavy new supply typically softens prices + rents 12–24 months out; constrained supply supports both.
Investment metrics
- 1% rule
- 2.37% ✓
- Cap rate
- 20.49%
- Cash-on-cash
- 50.70%
- DSCR
- 3.26
- GRM
- 3.5
CMA / ARV
No comps found within radius.
Projected returns pro-forma
-3.0% appreciation · 3.0% rent growth · sell at horizon
- IRR
- 48.5%
- Equity multiple
- 3.11×
- Total profit
- $47,342
- Equity at exit
- $11,928
- IRR
- 54.1%
- Equity multiple
- 6.31×
- Total profit
- $118,958
- Equity at exit
- $6,917
Cash invested: $22,400 (down + closing). Projections, not guarantees.
Landlord ↔ Tenant lean methodology
- Overall (STATE)
- 83 Strongly Landlord-Friendly
- State Nebraska
- 83 Strongly Landlord-Friendly · R+13
- County
- — inherits STATE
- City
- — inherits STATE
ZIP-level market 68142
- Home prices YoY
- -7.4%
- Active inventory
- 96
- Price-to-rent
- 3.5×
Monthly cashflow live
- Estimated rent
- $1,898 high interval (Pro) →
- Mortgage (P&I)
- −$420
- Tax est. 1.5%
- −$100 /mo · $1,200/yr
- Insurance
- −$33
- HOA
- −$0
- Vacancy / Maint / Mgmt
- −$399
- Net cashflow
- $946
Break-even live
UW: 25.0% down · 7.5% · 30yr · 1.5% tax · 5.0% vac · 8.0% maint · 8.0% mgmt
Financing live
Cash to close
- Down payment
- $20,000
- Closing costs
- $2,400
- Reserves months
- —
- Total cash needed
- —
Loan-product check · same deal, 3 products live
Conventional
25% down · 7.5% · 30yr
- Down + closing
- —
- Monthly P&I
- —
- Monthly cashflow
- —
- DSCR
- —
- Eligible?
- —
Personal DTI + credit; lowest rate.
DSCR
20% down · 8.5% · 30yr
- Down + closing
- —
- Monthly P&I
- —
- Monthly cashflow
- —
- DSCR
- —
- Eligible?
- —
No personal income docs; deal must DSCR.
Hard money
10% down · 12.0% · 12mo
- Down + closing
- —
- Monthly P&I
- —
- Monthly cashflow
- —
- DSCR
- —
- Eligible?
- —
Short-term bridge; refi at stabilization.
Rent comps 12 comps
| Address | Beds | Baths | Sqft | Rent | $/sqft | DOM | Units | Dist |
|---|---|---|---|---|---|---|---|---|
| 7314 N 108th St Omaha, NE | 3.0 | 2.0 | 1225 | $2,150 | $1.76 | 23d | 1 | 0.17mi |
| 10872 Potter St Omaha, NE | 3.0 | 2.0 | 1239 | $2,150 | $1.74 | 10d | 1 | 0.30mi |
| 6510 N 107th Plz Omaha, NE | 2.0–4.0 | 2.0 | 1165 | $1,638 | $1.41 | 1d | 19 | 0.46mi |
| 10451 Liam CT Omaha, NE | 3.0 | 1.0–2.0 | 853 | $1,870 | $2.19 | 1d | 94 | 0.47mi |
| 11657 Bauman Ave Omaha, NE | 3.0 | 1.5 | 1457 | $2,140 | $1.47 | 14d | 1 | 0.73mi |
| 12070 Kimball Plz Omaha, NE | 2.0–3.0 | 2.5 | 1221 | $2,157 | $1.77 | 1d | 4 | 0.93mi |
| 10901 Jaynes Plz Omaha, NE | 1.0–3.0 | 1.0–2.0 | 948 | $1,585 | $1.67 | 3d | 22 | 1.04mi |
| 10535 Ellison Plz Omaha, NE | 1.0–3.0 | 1.0–2.0 | 991 | $1,200 | $1.21 | 12d | 9 | 1.13mi |
| 10526 Fort Plz Omaha, NE | 1.0–2.0 | 1.0 | 750 | $1,050 | $1.40 | 44d | 1 | 1.20mi |
| 5439 N 100th Plz Omaha, NE | 1.0–2.0 | 1.0–2.5 | 1025 | $1,450 | $1.41 | 2d | 28 | 1.22mi |
| 11724 Norwick Plz Omaha, NE | 2.0 | 2.0 | 924 | $1,350 | $1.46 | 2d | 6 | 1.23mi |
| 9451 Vernon Plz Omaha, NE | 2.0 | 2.0 | 890 | $990 | $1.11 | 1d | 3 | 1.35mi |
Listing history 14 events
-
2026-06-18days on market $80,000 Active 29 DOM
-
2026-06-17days on market $80,000 Active 28 DOM
-
2026-06-16days on market $80,000 Active 27 DOM
-
2026-06-15days on market $80,000 Active 26 DOM
-
2026-06-13days on market $80,000 Active 24 DOM
-
2026-06-10days on market $80,000 Active 21 DOM
-
2026-06-09days on market $80,000 Active 20 DOM
-
2026-06-08days on market $80,000 Active 19 DOM
-
2026-06-07days on market $80,000 Active 18 DOM
-
2026-06-03days on market $80,000 Active 14 DOM
-
2026-06-03days on market $80,000 Active 13 DOM
-
2026-06-01days on market $80,000 Active 12 DOM
-
2026-06-01days on market $80,000 Active 11 DOM
-
2026-05-21$80,000 Active
ⓘ Source: listings_history table (triggers on properties + properties_extension) + one-shot
backfill from property_details.listing_events for pre-trigger history.
Climate risk First Street
- Flood 1/10 Low FEMA zone X · 0% chance over 30 yrs
- Wildfire 1/10 Low
- Heat 3/10 Moderate
- Air quality 2/10 Low 0 unhealthy d/yr today · 1 by 30 yrs out
Nearby sold comps map
Loading sold comps map…
Walkable amenities ~0.75 mi
Loading nearby amenities…
Taxation est. · year 1
- Rental income
- $22,774
- − Mortgage interest
- −$4,481
- − Property taxes
- −$1,200
- − Insurance
- −$400
- − Repairs & maintenance
- −$1,822
- − Management
- −$1,822
- − Depreciation
- −$2,327
- Taxable income
- $10,721
- Est. tax owed @ 24.0%
- −$2,573
- After-tax cash flow
- $8,784/yr
For passive investors: Depreciation is non-cash, so a rental often shows a tax loss while cash-flowing — sheltering income. Rental losses are passive: they offset passive income freely, and up to $25,000/yr can offset ordinary (W-2) income if you actively participate and your MAGI is under $100k (phasing out to $0 by $150k); unused losses carry forward. On sale, claimed depreciation is recaptured at up to 25%, and gains may owe capital-gains tax (a 1031 exchange can defer both). Figures are a year-1 estimate at your 24.0% rate — not tax advice; consult a CPA.
Condition & rehab AI · 1 photo
This 3-bedroom 2-bathroom home in the Park Meadow trailer park is in fair condition with cosmetic repairs needed. Fresh paint and landscaping would significantly enhance its value.
Repairs flagged
- Minor exterior siding — Light wear
- Minor interior walls — Paint appears faded
Value-add opportunities
- Both paint interior walls — Fresh paint enhances curb appeal and interior aesthetics
- Both landscaping — Well-maintained landscaping improves curb appeal and property value
Renovation cost estimate screening
| Repair item | Severity | Est. cost |
|---|---|---|
| exterior siding · Light wear | Minor | $500–3,000 |
| interior walls · Paint appears faded | Minor | $500–3,000 |
| Total estimated repair cost · 2 items | $1,000–6,000 |
Value-add ROI direction
- Both paint interior walls — Fresh paint enhances curb appeal and interior aesthetics ↑
- Both landscaping — Well-maintained landscaping improves curb appeal and property value ↑
ⓘ Cost ranges are severity-bucket heuristics (US national rule-of-thumb). Get contractor quotes + a written scope before underwriting a rehab budget.
Schools (NCES district)
- District
- Omaha Public Schools
- NCES district ID
- 3174820
- Math proficiency
- 20% ▼ -10.00%
- Reading proficiency
- 28% ▼ -5.00%
- Median HH income
- $46,039
- Composite
- 20.83/100
- National rank
- #8502
- State rank
- #110 of 111 in NE
Livability — Omaha
- Score
- 84/100
- State rank
- #7
- US rank
- #663
Category grades
Schools grade is shown separately in the Schools card above.
Census & demographics
- City population
- 552,986
- Population (ZIP)
- 4,692
Population outlook (Douglas County) Hauer SSP2
- Today (2025)
- 625,245 people
- By 2030
- 661,613 · +5.8%
- By 2040
- 732,395 · +17.1%
- By 2050
- 801,988 · +28.3%
- By 2075
- 968,637 · +54.9%
- By 2100
- 1,101,871 · +76.2%
Race, ethnicity, and origin ACS 2023
- Neighborhood character
- Predominantly White (72%)
- Race & ethnicity
- White 72% Two or more races 8% Asian 8% Hispanic / Latino 7% Black 4%
- Hispanic origin (detail)
- Mexican 6% Puerto Rican 1%
- Common ancestry
- Lithuanian 5% Romanian 4% Italian 2%
- Foreign-born
- 8% · Canada, United Kingdom, India
- Languages at home
- 89% English-only · Spanish 5% Other Asian/Pacific 3% Other Indo-European 2%
Political lean MEDSL · Douglas
- 2024 margin
- D (+10.2) · D 54.4% · R 44.2% · Other 1.4%
- 2008→2024 swing
- +5.5pp toward D · 2008: 4.6pp · 2024: 10.2pp
- All cycles
- 2024: D+10.2 2020: D+11.3 2016: D+1.4 2012: R+4.3 2008: D+4.6
Not yet ingested
- Civics
- —
Market trends
- HPI YoY
- ▼ -18.23%
- Current HPI
- 228.995
- Rent YoY
- —
- Metro
- —
- State GDP YoY
- ▲ 0.68%
- F500 in state
- 2
Industry mix (Fortune 500 HQ in NE)
| Industry | F500 HQs | Revenue |
|---|---|---|
| Conglomerate | 1 | $371B |
|
||
Price history
1 event — show timeline
- 2026-05-21 Listed $80,000 FSBO.com
Cash-flow waterfall
monthlySold comps — $/sqft
last 12 mo · ≤1 miLoading sold comps…