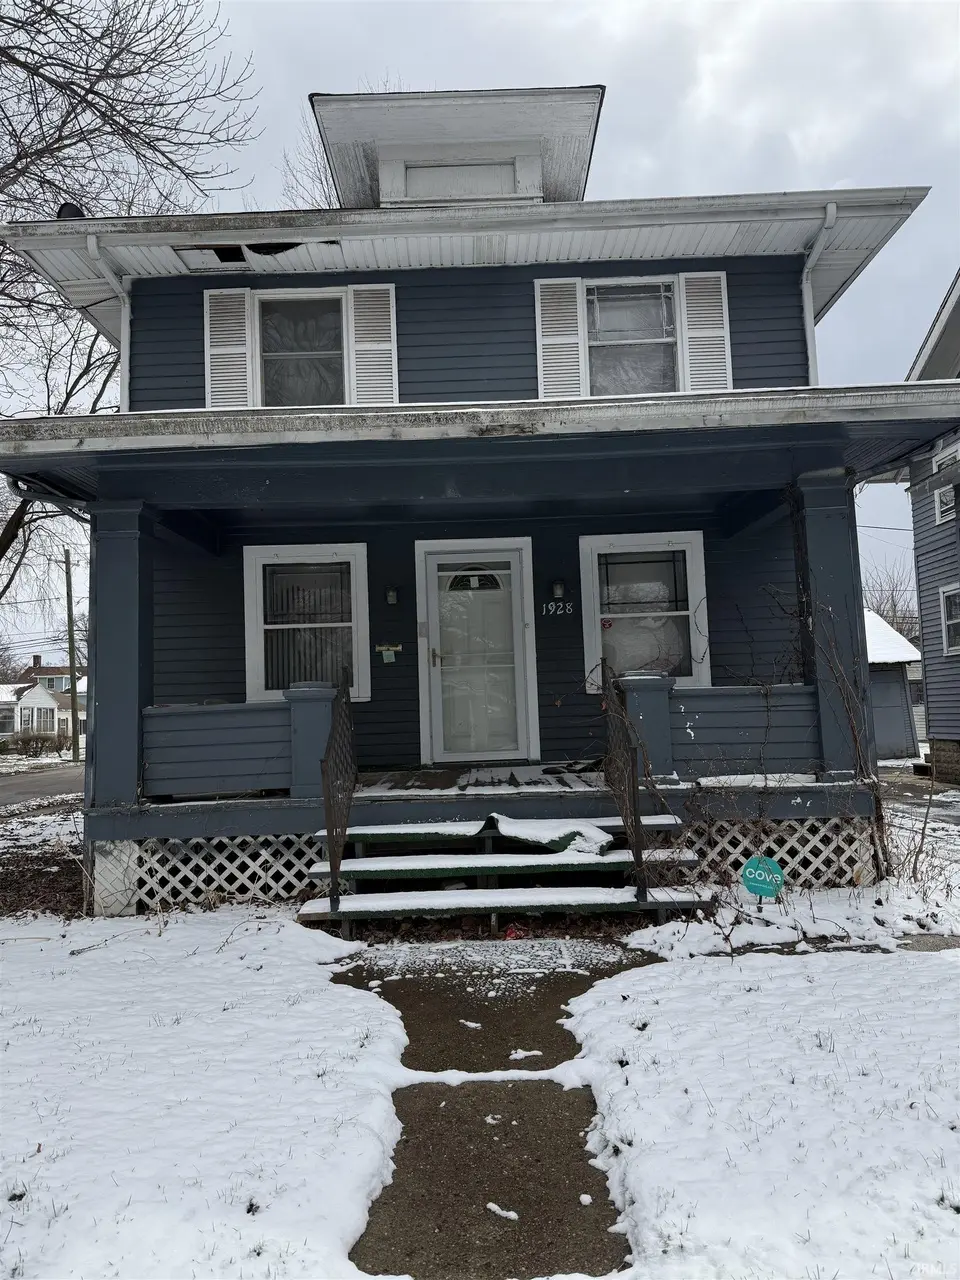
1928 Drexel Ave · Fort Wayne, IN
Flood risk 1/10 · Minimal
- FEMA flood zone
- X (unshaded)
- Chance of flooding over 30 yrs
- 0.0%
- Est. flood insurance / yr
- $473 – $860
Fire risk 1/10 · Minimal
- Est. fire insurance / yr
- $717 – $1,331
Heat risk 3/10 · Minor
- Hot days now (above 100°F)
- 7 days/yr
- Hot days in 30 yrs
- 17 days/yr
Wind risk 2/10 · Minimal
- Chance of severe wind over 30 yrs
- —
Air-quality risk 3/10 · Minor
- Unhealthy air days now
- 2 days/yr
- Unhealthy air days in 30 yrs
- 3 days/yr
Risk factors via First Street. Map © Google.
Why this score? — see what drove the B grade
The composite is a weighted blend of 9 inputs, each scored 0–100. Each bar is that input's sub-score; the figure is the points it added to the 100-point composite (weight × sub-score).
- Cash flow +30.0/30.0
- 1% rule +10.0/10.0
- DSCR +10.0/10.0
- ARV discount +7.5/15.0
- Livability +4.2/5.0
- Rent growth +3.7/5.0
- Condition / age +2.5/5.0
- Schools +2.2/10.0
- Appreciation +0.0/10.0
$55,000
🖨 Deal sheet 📄 Offer letter ✓ Due diligence
Listing remarks
Vintage three bedroom, one bath home at 1928 Drexel Avenue. This two story with a basement is full of potential but needs TLC perfect for buyers or investors. Home to be sold as is.
Key facts
- 3,680 sq ft lot
- 2 garage spots
- Built 1925
Neighborhood map
What this means for you Summary
Snapshot
- This is a 3-bed/1.0-bath single-family listed at $55k.
Deal economics
- At list price, monthly cash flow is $605 ($7k/yr) — positive.
- The deal already cash-flows at list — no discount required.
- Meets the 1% rule at list price ($1k rent vs $55k).
- Recommended offer: $54k (1.5% below list) — sets the bar for market timing.
- Cap rate 19.5% vs local median 4.8% in Fort Wayne — top-decile yield for the area; either an underpriced asset or a hidden risk that comps aren't pricing in. Stress-test before assuming the spread holds.
Location & tenants
- Location reads 84/100 on livability (#6 in IN, #676 nationally) — a professional / high-income tenant draw. Strengths: amenities A+, commute A+, cost of living A+; Watch: crime C-, employment D+.
- Fort Wayne Community Schools (urban): math 22% / reading 29% proficiency, ranked #263 of 301 in IN (top 87%) — low school quality limits family demand, transient renter base, plan for 1-2y turnover; 60% free/reduced lunch — lower-income household profile, screen leases tightly.
- Zoned schools: Maplewood Elementary School (math 23% / reading 19%, grade F, #807 of 994 statewide, top 81%, 507 students, 74% FRL); Miami Middle School (math 9% / reading 17%, grade F, #304 of 330 statewide, top 94%, 497 students, 80% FRL); Wayne High School (math 17% / reading 52%, grade F, #270 of 369 statewide, top 77%, 1,419 students, 68% FRL).
- Market conditions: Rents rising fast (+4.9%/yr); 129 active listings in the ZIP; 21 comparable units currently listed for rent nearby; rentals at typical pace (median 21d on market — plan ~3-4 weeks tenant-placement turnaround); 1,861 units permitted in Allen County in 2024 (576 in 5+ unit buildings).
- This rent runs 30% of the median local income ($48k/yr) — at the standard rent-burdened threshold; future hikes will face affordability resistance.
Forward outlook
- Local home prices are declining (-3.0%/yr); year-one equity from $380 of loan paydown is wiped out by about $2k of value loss. Plan a longer hold.
- Allen County population projected at +10% by 2050 — modest demand growth; plan on rents tracking national, not racing it.
- At projected returns (-3.0% appreciation + 4.9% rent growth), your $15k cash investment doubles in ~3 years — after that, you're playing with house money.
Negotiation context
- It's been on market 16 days — a 2% lower offer ($54k) is reasonable based on typical stale-listing flexibility.
- 3 sale attempts since 2y ago with the ask held roughly flat each time — persistent listings suggest the price (not the market) is what's stuck; bring a comps-based counter.
Risks & watch-outs
- Watch-outs: built in 1925 — expect roof / HVAC / electrical / plumbing capex.
Questions for the listing agent
- Built in 1925 — when were the roof, HVAC, electrical panel, plumbing, and water heater last replaced?
- Is there a deadline driving the sale (1031 exchange, divorce, estate, relocation)? That informs how much negotiation room exists.
- Schools are D-rated, which usually means shorter tenancies and higher turnover. Who's the typical renter profile here, and what's been the actual vacancy rate?
- What's the average days-on-market for RENTAL listings here right now (not sales)? A rising rental-DOM trend means longer vacancies and softer asking-rent achievability than the comps imply.
- What's the recent tenant-quality profile in this submarket — average credit score on applications, eviction rate, late-payment / NSF rate, and stable-employment percentage? A property-management company in the area should have these aggregated.
- How much new for-sale + rental construction is in the pipeline within 1–3 miles? Heavy new supply typically softens prices + rents 12–24 months out; constrained supply supports both.
Investment metrics
- 1% rule
- 2.19% ✓
- Cap rate
- 19.50%
- Cash-on-cash
- 47.18%
- DSCR
- 3.10
- GRM
- 3.8
CMA / ARV
- ARV (on-the-fly)
- $121,638
- Comps found
- 12
Show comp detail 12 sales within ~0.75 mi
| Address | Dist | Beds/Ba | Sqft | Sold | Price | $/sf | Match |
|---|---|---|---|---|---|---|---|
| 3110 Central Dr | 0.08mi | 3/1.0 | 1,224 (-2%) | 0mo | $123,000 | $100 | 92 |
| 3105 Central Dr | 0.10mi | 3/1.0 | 1,288 (+3%) | 1mo | $65,000 | $50 | 90 |
| 3034 Lillie St | 0.23mi | 3/1.0 | 1,350 (+8%) | 1mo | $90,000 | $67 | 76 |
| 3015 Holton Ave | 0.39mi | 3/1.0 | 1,185 (-6%) | 1mo | $80,000 | $68 | 72 |
| 3311 Reed St | 0.29mi | 3/1.0 | 1,380 (+10%) | 0mo | $81,000 | $59 | 69 |
| 3522 Oliver St | 0.55mi | 3/1.0 | 1,292 (+3%) | 4mo | $135,000 | $104 | 66 |
| 1515 E Rudisill Blvd | 0.42mi | 3/1.0 | 1,125 (-10%) | 2mo | $114,900 | $102 | 61 |
| 3317 Smith St | 0.57mi | 3/1.0 | 1,182 (-6%) | 4mo | $65,000 | $55 | 61 |
| 2747 Abbott St | 0.39mi | 3/1.0 | 1,080 (-14%) | 3mo | $105,000 | $97 | 57 |
| 1024 Eckart St | 0.62mi | 3/1.5 | 1,421 (+13%) | 2mo | $81,000 | $57 | 45 |
| 4126 Bowser Ave | 0.70mi | 3/1.0 | 1,096 (-13%) | 3mo | $130,000 | $119 | 44 |
| 933 E Rudisill Blvd | 0.72mi | 3/1.5 | 1,440 (+15%) | 3mo | $205,000 | $142 | 37 |
Match score weights: distance 35% · size 25% · config 20% · recency 20%. Top-matched comps best support the ARV.
Projected returns pro-forma
-3.0% appreciation · 4.93% rent growth · sell at horizon
- IRR
- 46.6%
- Equity multiple
- 3.08×
- Total profit
- $32,034
- Equity at exit
- $8,201
- IRR
- 53.2%
- Equity multiple
- 6.70×
- Total profit
- $87,734
- Equity at exit
- $4,755
Cash invested: $15,400 (down + closing). Projections, not guarantees.
Landlord ↔ Tenant lean methodology
- Overall (STATE)
- 90 Strongly Landlord-Friendly
- State Indiana
- 90 Strongly Landlord-Friendly · R+11
- County
- — inherits STATE
- City
- — inherits STATE
ZIP-level market 46806
- Home prices YoY
- -33.6%
- Rents YoY
- 4.9%
- Active inventory
- 129
- Price-to-rent
- 3.8×
Monthly cashflow live
- Estimated rent
- $1,207 high interval (Pro) →
- Mortgage (P&I)
- −$288
- Tax from tax record
- −$37 /mo · $439/yr
- Insurance
- −$23
- HOA
- −$0
- Vacancy / Maint / Mgmt
- −$253
- Net cashflow
- $605
Break-even live
UW: 25.0% down · 7.5% · 30yr · 1.5% tax · 5.0% vac · 8.0% maint · 8.0% mgmt
Financing live
Cash to close
- Down payment
- $13,750
- Closing costs
- $1,650
- Reserves months
- —
- Total cash needed
- —
Loan-product check · same deal, 3 products live
Conventional
25% down · 7.5% · 30yr
- Down + closing
- —
- Monthly P&I
- —
- Monthly cashflow
- —
- DSCR
- —
- Eligible?
- —
Personal DTI + credit; lowest rate.
DSCR
20% down · 8.5% · 30yr
- Down + closing
- —
- Monthly P&I
- —
- Monthly cashflow
- —
- DSCR
- —
- Eligible?
- —
No personal income docs; deal must DSCR.
Hard money
10% down · 12.0% · 12mo
- Down + closing
- —
- Monthly P&I
- —
- Monthly cashflow
- —
- DSCR
- —
- Eligible?
- —
Short-term bridge; refi at stabilization.
Rent comps 21 comps
| Address | Beds | Baths | Sqft | Rent | $/sqft | DOM | Units | Dist |
|---|---|---|---|---|---|---|---|---|
| 3410 S Anthony Blvd Fort Wayne, IN | 3.0 | 1.0 | 900 | $1,200 | $1.33 | 43d | 1 | 0.17mi |
| 2903 Queen St Fort Wayne, IN | 3.0 | 2.0 | 1460 | $1,200 | $0.82 | 43d | 1 | 0.40mi |
| 3009 Holton Ave Fort Wayne, IN | 3.0 | 1.0 | 1212 | $1,400 | $1.16 | 13d | 1 | 0.41mi |
| 2720 Queen St Fort Wayne, IN | 3.0 | 2.0 | 1316 | $1,395 | $1.06 | 13d | 1 | 0.45mi |
| 1023 Hamilton Ave Fort Wayne, IN | 3.0 | 1.0 | 1152 | $1,075 | $0.93 | 13d | 1 | 0.65mi |
| 1024 Colerick St Fort Wayne, IN | 4.0 | 1.0 | 1388 | $1,065 | $0.77 | 21d | 1 | 0.66mi |
| 4325 Werling Dr Fort Wayne, IN | 1.0–3.0 | 1.0–2.0 | 923 | $1,164 | $1.26 | 43d | 1 | 0.67mi |
| 4014 Oliver St Fort Wayne, IN | 3.0 | 1.0 | 936 | $1,050 | $1.12 | 13d | 1 | 0.69mi |
| 4705 S Anthony Blvd Fort Wayne, IN | 3.0 | 1.0 | 1110 | $1,050 | $0.95 | 13d | 1 | 0.91mi |
| 4405 S Park Dr Fort Wayne, IN | 2.0 | 1.0 | 1440 | $1,175 | $0.82 | 13d | 1 | 1.00mi |
| 2806 New Haven Ave Fort Wayne, IN | 3.0 | 1.0 | 1410 | $1,125 | $0.80 | 21d | 1 | 1.04mi |
| 2730 Chestnut St Fort Wayne, IN | 3.0 | 1.5 | 1312 | $950 | $0.72 | 21d | 1 | 1.10mi |
| 451 E Pontiac St Fort Wayne, IN | 3.0 | 1.0 | 1308 | $1,050 | $0.80 | 43d | 1 | 1.13mi |
| 3702 Trace Cir Fort Wayne, IN | 2.0–4.0 | 2.0 | 1571 | $1,903 | $1.21 | 43d | 6 | 1.14mi |
| 3801 Lafayette St Fort Wayne, IN | 2.0 | 1.0 | 1116 | $995 | $0.89 | 13d | 1 | 1.15mi |
| 859 Buchanan St Fort Wayne, IN | 1.0–4.0 | 1.0 | 887 | $1,074 | $1.21 | 21d | 1 | 1.19mi |
| 4133 Lafayette St Fort Wayne, IN | 4.0 | 2.0 | 1640 | $1,400 | $0.85 | 21d | 1 | 1.23mi |
| 2530 Lafayette St Fort Wayne, IN | 4.0 | 1.0 | 1816 | $1,500 | $0.83 | 43d | 1 | 1.25mi |
| 420 E Dewald St Fort Wayne, IN | 3.0 | 1.5 | 1472 | $1,300 | $0.88 | 43d | 1 | 1.32mi |
| 116 E Pontiac St Fort Wayne, IN | 3.0 | 1.5 | 1400 | $1,175 | $0.84 | 21d | 1 | 1.42mi |
| 3510 S Harrison St Fort Wayne, IN | 3.0 | 1.0 | 1248 | $975 | $0.78 | 13d | 1 | 1.47mi |
Listing history 7 events
-
2026-04-03status Pending
-
2026-03-18$55,000 Active
-
2024-09-13price $64,900
-
2024-08-30price $69,900
-
2024-08-06status Active
-
2024-06-04status Pending
-
2024-05-23$74,900 Active
ⓘ Source: listings_history table (triggers on properties + properties_extension) + one-shot
backfill from property_details.listing_events for pre-trigger history.
Tax reassessment forecast IN · Partial reset (capped growth)
- Current annual tax
- $439 · $37/mo
- Projected year-2 tax
- $453 · $38/mo
- Expected delta
- +$14/yr (+$1/mo · 3.3%)
ⓘ Screening estimate from a state-policy table — verify with the county assessor before closing.
Climate risk First Street
- Flood 1/10 Low FEMA zone X (unshaded) · 0% chance over 30 yrs
- Wildfire 1/10 Low
- Heat 3/10 Moderate 7 d/yr ≥100°F today · 17 d/yr by 30 yrs out
- Wind 2/10 Low
- Air quality 3/10 Moderate 2 unhealthy d/yr today · 3 by 30 yrs out
Nearby sold comps map
Loading sold comps map…
Walkable amenities ~0.75 mi
Loading nearby amenities…
Taxation est. · year 1
- Rental income
- $14,481
- − Mortgage interest
- −$3,081
- − Property taxes
- −$439
- − Insurance
- −$275
- − Repairs & maintenance
- −$1,158
- − Management
- −$1,158
- − Depreciation
- −$1,600
- Taxable income
- $6,769
- Est. tax owed @ 24.0%
- −$1,625
- After-tax cash flow
- $5,640/yr
For passive investors: Depreciation is non-cash, so a rental often shows a tax loss while cash-flowing — sheltering income. Rental losses are passive: they offset passive income freely, and up to $25,000/yr can offset ordinary (W-2) income if you actively participate and your MAGI is under $100k (phasing out to $0 by $150k); unused losses carry forward. On sale, claimed depreciation is recaptured at up to 25%, and gains may owe capital-gains tax (a 1031 exchange can defer both). Figures are a year-1 estimate at your 24.0% rate — not tax advice; consult a CPA.
Schools (NCES district)
- District
- Fort Wayne Community Schools
- NCES district ID
- 1803630
- Math proficiency
- 22% ▼ -11.00%
- Reading proficiency
- 29% ▼ -7.00%
- Median HH income
- $41,951
- Composite
- 21.68/100
- National rank
- #8275
- State rank
- #263 of 301 in IN
Livability — Fort Wayne
- Score
- 84/100
- State rank
- #6
- US rank
- #676
Category grades
Schools grade is shown separately in the Schools card above.
Census & demographics
- Census place
- Fort Wayne, IN
- County
- Allen County · 326,813 people
- City population
- 326,813
- Metro
- Fort Wayne, IN
- Population (ZIP)
- 26,425
- Household income
- $47,895
- Rent vs Own
- Severe rent burden
- 1184.0
Population outlook (Allen County) Hauer SSP2
- Today (2025)
- 394,020 people
- By 2030
- 405,128 · +2.8%
- By 2040
- 423,476 · +7.5%
- By 2050
- 435,137 · +10.4%
- By 2075
- 450,293 · +14.3%
- By 2100
- 424,101 · +7.6%
Race, ethnicity, and origin ACS 2023
- Neighborhood character
- Highly diverse neighborhood (Simpson 0.74)
- Race & ethnicity
- Black 37% Hispanic / Latino 26% White 21% Asian 12% Two or more races 11% Native American 2%
- Hispanic origin (detail)
- Mexican 18% Puerto Rican 1%
- Common ancestry
- Italian 1% Romanian 1% Lithuanian 1%
- Foreign-born
- 19% · Canada, Philippines, South Korea
- Languages at home
- 71% English-only · Spanish 19% Other Asian/Pacific 9%
Political lean MEDSL · Allen
- 2024 margin
- R (+12.5) · D 42.9% · R 55.4% · Other 1.7%
- 2008→2024 swing
- -8.1pp toward R · 2008: -4.3pp · 2024: -12.5pp
- All cycles
- 2024: R+12.5 2020: R+11.2 2016: R+19.6 2012: R+16.8 2008: R+4.3
Not yet ingested
- Civics
- —
Market trends
- HPI YoY
- ▼ -148.00%
- Current HPI
- 291.8198
- Rent YoY
- ▲ 4.93%
- Metro
- Fort Wayne, IN
- State GDP YoY
- ▲ 2.90%
- F500 in state
- 18
Industry mix (Fortune 500 HQ in IN)
| Industry | F500 HQs | Revenue |
|---|---|---|
| Industrial Machinery | 2 | $37B |
|
||
| Healthcare | 1 | $177B |
|
||
| Pharmaceuticals | 1 | $45B |
|
||
| Metals / Steel | 1 | $18B |
|
||
| Agriculture | 1 | $17B |
|
||
| Packaging | 1 | $12B |
|
||
Price history
-26.6% since first listed7 events — show timeline
- 2026-04-03 Pending — IRMLS
- 2026-03-18 Listed $55,000 IRMLS
- 2024-09-13 Price Changed $64,900 IRMLS
- 2024-08-30 Price Changed $69,900 IRMLS
- 2024-08-06 Relisted — IRMLS
- 2024-06-04 Pending — IRMLS
- 2024-05-23 Listed $74,900 IRMLS
Property tax history
+25.2%/yrLatest (2024): $439 · +14.6% YoY. Source: county tax records.
Cash-flow waterfall
monthlySold comps — $/sqft
last 12 mo · ≤1 miLoading sold comps…