 Multi-family
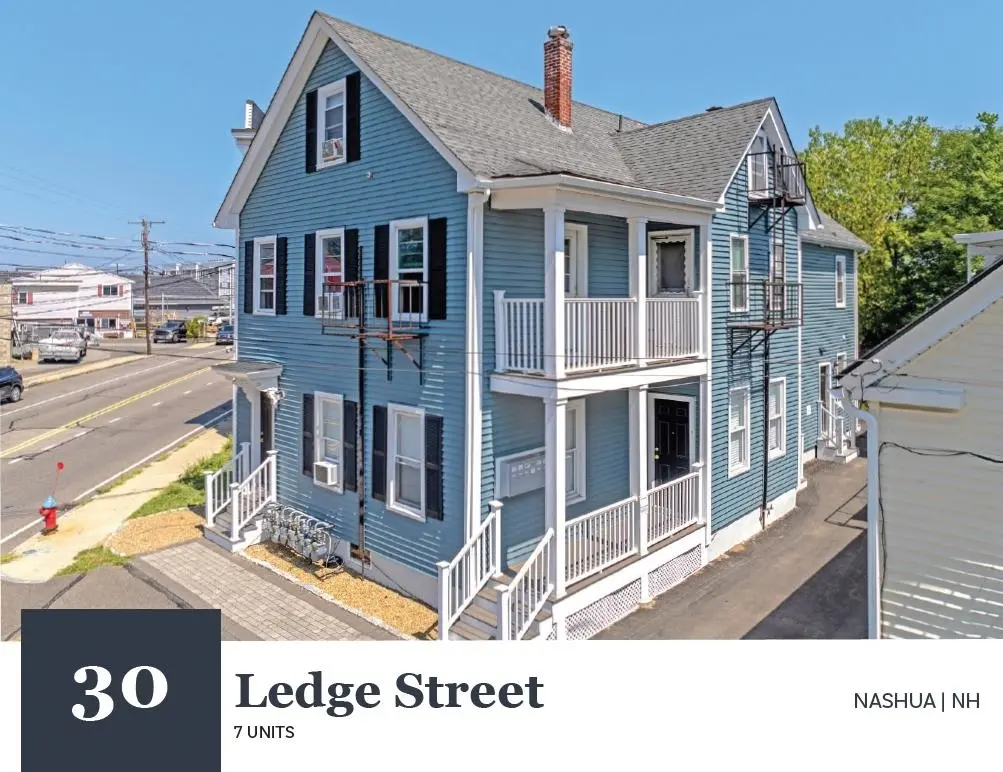
30 Ledge St · Nashua, NH
Flood risk 1/10 · Minimal
- FEMA flood zone
- X (unshaded)
- Chance of flooding over 30 yrs
- 0.0%
- Est. flood insurance / yr
- $473 – $860
Fire risk 1/10 · Minimal
- Est. fire insurance / yr
- $507 – $941
Heat risk 4/10 · Minor
- Hot days now (above 96°F)
- 7 days/yr
- Hot days in 30 yrs
- 15 days/yr
Wind risk 6/10 · Moderate
- Chance of severe wind over 30 yrs
- 27.0%
Air-quality risk 2/10 · Minimal
- Unhealthy air days now
- 1 days/yr
- Unhealthy air days in 30 yrs
- 2 days/yr
Risk factors via First Street. Map © Google.
Why this score? — see what drove the C+ grade
The composite is a weighted blend of 9 inputs, each scored 0–100. Each bar is that input's sub-score; the figure is the points it added to the 100-point composite (weight × sub-score).
- Cash flow +21.8/30.0
- ARV discount +15.0/15.0
- DSCR +7.0/10.0
- 1% rule +5.1/10.0
- Livability +4.2/5.0
- Rent growth +3.3/5.0
- Schools +3.1/10.0
- Condition / age +2.5/5.0
- Appreciation +0.0/10.0
$1,150,000
🖨 Deal sheet (PDF) 📄 Offer letter ✓ Due diligence
Multi-family units
County records classify this as Multi-Family (5+ Unit). Listing-text estimate: 1 unit. estimate disagrees with records
5+ unit building — per-unit beds/baths from public records are typically unavailable; the breakdown below (if shown) is an estimate from the listing text.
Listing remarks MLS
-Investors take notice. This 7 unit multi family is a potential money maker. City will only allow 6 units to be occupied. All vacant at the present time and most of the units need work. Tenants pay their own heat and hot water. Bank Owned.
Key facts
- Newly paved driveway
- New vinyl siding
- Five storage lockers
Tags
Property features AI
Finance
- Other: Assessment information not included per instructions
- Financial info: Net income: $99,813; Operating expenses include insurance, maintenance, snow removal, trash, water/sewer and other
Exterior
- Parking: Paved driveway
- Utilities: Public water; Public sewer; Electric: Other; Internet: Unknown; Other utilities present
- Home design: Multifamily building (7 units); Existing structure; Vinyl exterior; Shingle - Asphalt roof; Built in 1900
- Construction: Vinyl exterior construction; Shingle - Asphalt roof; Built in 1900; Unfinished basement
- Exterior features: Paved driveway; Road frontage on a paved public road (approx. 30 feet); Lot features: Other; Flood zone: Yes
Interior
- Kitchen: No kitchen appliance details provided
- Bedrooms: Six 1-bedroom units; One 2-bedroom unit
- Flooring: No flooring details provided
- Bathrooms: Seven full bathrooms
- Heating & cooling: Natural gas heating; Cooling: Other
- Interior features: Unfinished basement with interior access; Seven full bathrooms in the building
- Laundry & utility: No laundry details provided
Neighborhood map
What this means for you Summary
Snapshot
- This is a 3-bed/7.0-bath multifamily listed at $1.15M.
Deal economics
- At list price, monthly cash flow is $2k ($21k/yr) — positive.
- The deal already cash-flows at list — no discount required.
- Meets the 1% rule at list price ($12k rent vs $1.15M).
- Recommended offer: $1.13M (1.5% below list) — sets the bar for market timing.
- Cap rate 8.2% vs local median 3.0% in Nashua — top-decile yield for the area; either an underpriced asset or a hidden risk that comps aren't pricing in. Stress-test before assuming the spread holds.
Location & tenants
- Location reads 83/100 on livability (#11 in NH, #983 nationally) — a professional / high-income tenant draw. Strengths: commute A+, housing A+, health & safety A+; Watch: amenities D+.
- Nashua School District (urban): math 27% / reading 40% proficiency, ranked #77 of 98 in NH (top 79%) — families likely to look elsewhere, expect single-tenant / working-renter base with shorter leases.
- Market conditions: Rents rising (+3.1%/yr); 50 active listings in the ZIP; 2 comparable units currently listed for rent nearby; solid renter incomes; 981 units permitted in Hillsborough County in 2024 (381 in 5+ unit buildings).
- At $11,575/mo this rent would consume 174% of the median local household income ($80k/yr) (locally 1823% of renters already pay >50% of income on rent) — very limited rent-growth headroom before tenants either downsize or default.
Forward outlook
- Local home prices are declining (-3.0%/yr); year-one equity from $8k of loan paydown is wiped out by about $34k of value loss. Plan a longer hold.
- Hillsborough County population projected to shrink 8% by 2050 — rents likely to lag national; underwrite the cash flow, not the appreciation.
Negotiation context
- It's been on market 20 days — a 2% lower offer ($1.13M) is reasonable based on typical stale-listing flexibility.
- 4 sale attempts since 28y ago with the ask held roughly flat each time — persistent listings suggest the price (not the market) is what's stuck; bring a comps-based counter.
- Current owner paid $791k; 45% above their basis — modest negotiation headroom, anchor on the comps not their cost.
Risks & watch-outs
- Watch-outs: built in 1900 — expect roof / HVAC / electrical / plumbing capex.
- Climate carrying-cost: major wind risk, 27% chance of damaging wind over 30y — expect insurance premiums to compound above CPI over the hold.
Questions for the listing agent
- Built in 1900 — when were the roof, HVAC, electrical panel, plumbing, and water heater last replaced?
- Is there a deadline driving the sale (1031 exchange, divorce, estate, relocation)? That informs how much negotiation room exists.
- Schools are B-rated — typically a magnet for longer-tenancy family renters. What's the average tenant stay here, and is there a school-zone premium baked into asking?
- What's the average days-on-market for RENTAL listings here right now (not sales)? A rising rental-DOM trend means longer vacancies and softer asking-rent achievability than the comps imply.
- What's the recent tenant-quality profile in this submarket — average credit score on applications, eviction rate, late-payment / NSF rate, and stable-employment percentage? A property-management company in the area should have these aggregated.
- How much new apartment / multifamily construction is in the pipeline within 1–3 miles? Heavy new supply (>2% of stock underway) typically softens rents 12–24 months out; light construction supports rent growth.
Investment metrics
- 1% rule
- 1.01% ✓
- Cap rate
- 8.16%
- Cash-on-cash
- 6.67%
- DSCR
- 1.30
- GRM
- 8.3
CMA / ARV
- ARV (on-the-fly)
- $1,473,864
- Comps found
- 1
Show comp detail 1 sale within ~0.75 mi
| Address | Dist | Beds/Ba | Sqft | Sold | Price | $/sf | Match |
|---|---|---|---|---|---|---|---|
| 7 Mason St | 0.68mi | 3/10.0 | 3,225 (-5%) | 18mo | $1,400,000 | $434 | 33 |
Match score weights: distance 35% · size 25% · config 20% · recency 20%. Top-matched comps best support the ARV.
Projected returns pro-forma
-3.0% appreciation · 3.11% rent growth · sell at horizon
- IRR
- -6.0%
- Equity multiple
- 0.78×
- Total profit
- $-71,265
- Equity at exit
- $171,469
- IRR
- 3.8%
- Equity multiple
- 1.28×
- Total profit
- $89,230
- Equity at exit
- $99,431
Cash invested: $322,000 (down + closing). Projections, not guarantees.
Landlord ↔ Tenant lean methodology
- Overall (STATE)
- 56 Moderately Landlord-Leaning
- State New Hampshire
- 56 Moderately Landlord-Leaning · D+1
- County
- — inherits STATE
- City
- — inherits STATE
ZIP-level market 03060
- Home prices YoY
- -27.6%
- Rents YoY
- 3.1%
- Active inventory
- 50
- Price-to-rent
- 61.2×
Monthly cashflow live
- Estimated rent
- $11,575 medium interval (Pro) →
- Mortgage (P&I)
- −$6,031
- Tax from tax record
- −$845 /mo · $10,135/yr
- Insurance
- −$479
- HOA
- −$0
- Vacancy / Maint / Mgmt
- −$2,431
- Net cashflow
- $1,790
Break-even live
Sensitivity live
| Price | -10% $2,441 | -5% $2,115 | +0% $1,790 | +5% $1,464 | +10% $1,139 |
|---|---|---|---|---|---|
| Rent | -10% $875 | -5% $1,333 | +0% $1,790 | +5% $2,247 | +10% $2,704 |
| Rate | -1.0pp $2,369 | -0.5pp $2,082 | base $1,790 | +0.5pp $1,492 | +1.0pp $1,189 |
7-unit breakdown (identical units grouped — click to expand)
| Units | Beds | Baths | Est. rent |
|---|---|---|---|
| 5× units | 1 | 1 | $7,825 |
| #1 | 1 | 1 | $1,565 |
| #2 | 1 | 1 | $1,565 |
| #3 | 1 | 1 | $1,565 |
| #4 | 1 | 1 | $1,565 |
| #6 | 1 | 1 | $1,565 |
| 2× units | 2 | 1 | $3,752 |
| #5 | 2 | 1 | $1,876 |
| #7 | 2 | 1 | $1,876 |
| Total (7 units) | $11,575 | ||
UW: 25.0% down · 7.5% · 30yr · 1.5% tax · 5.0% vac · 8.0% maint · 8.0% mgmt
Financing live
Cash to close
- Down payment
- $287,500
- Closing costs
- $34,500
- Reserves months
- —
- Total cash needed
- —
Loan-product check · same deal, 3 products live
Conventional
25% down · 7.5% · 30yr
- Down + closing
- —
- Monthly P&I
- —
- Monthly cashflow
- —
- DSCR
- —
- Eligible?
- —
Personal DTI + credit; lowest rate.
DSCR
20% down · 8.5% · 30yr
- Down + closing
- —
- Monthly P&I
- —
- Monthly cashflow
- —
- DSCR
- —
- Eligible?
- —
No personal income docs; deal must DSCR.
Hard money
10% down · 12.0% · 12mo
- Down + closing
- —
- Monthly P&I
- —
- Monthly cashflow
- —
- DSCR
- —
- Eligible?
- —
Short-term bridge; refi at stabilization.
Rent comps 2 comps
| Address | Beds | Baths | Sqft | Rent | $/sqft | DOM | Units | Dist |
|---|---|---|---|---|---|---|---|---|
| 26 Ledge St Unit 26B Nashua, NH | 2.0 | 1.0 | 4000 | $1,650 | $0.41 | 22d | 1 | 0.03mi |
| 24 Ledge St Unit 24A Nashua, NH | 3.0 | 1.0 | 4500 | $2,600 | $0.58 | 22d | 1 | 0.03mi |
Listing history 13 events
-
2026-06-21days on market $1,150,000 Active 20 DOM
-
2026-06-18days on market $1,150,000 Active 17 DOM
-
2026-06-17days on market $1,150,000 Active 16 DOM
-
2026-06-16days on market $1,150,000 Active 15 DOM
-
2026-06-15days on market $1,150,000 Active 14 DOM
-
2026-06-14days on market $1,150,000 Active 12 DOM
-
2026-06-10days on market $1,150,000 Active 9 DOM
-
2026-06-09days on market $1,150,000 Active 8 DOM
-
2026-06-08days on market $1,150,000 Active 7 DOM
-
2026-06-07days on market $1,150,000 Active 6 DOM
-
2026-06-03days on market $1,150,000 Active 2 DOM
-
2026-06-01remarks 699-char remark
-
2026-06-01$1,150,000 Active 1 DOM
ⓘ Source: listings_history table (triggers on properties + properties_extension) + one-shot
backfill from property_details.listing_events for pre-trigger history.
Tax reassessment forecast NH · Partial reset (capped growth)
- Current annual tax
- $10,135 · $845/mo
- Projected year-2 tax
- $17,602 · $1,467/mo
- Expected delta
- +$7,468/yr (+$622/mo · 73.7%)
ⓘ Screening estimate from a state-policy table — verify with the county assessor before closing.
Climate risk First Street
- Flood 1/10 Low FEMA zone X (unshaded) · 0% chance over 30 yrs
- Wildfire 1/10 Low
- Heat 4/10 Moderate 7 d/yr ≥96°F today · 15 d/yr by 30 yrs out
- Wind 6/10 Major 27% chance of damaging wind over 30 yrs
- Air quality 2/10 Low 1 unhealthy d/yr today · 2 by 30 yrs out
Nearby sold comps map
Loading sold comps map…
Walkable amenities ~0.75 mi
Loading nearby amenities…
Taxation est. · year 1
- Rental income
- $138,900
- − Mortgage interest
- −$64,418
- − Property taxes
- −$10,135
- − Insurance
- −$5,750
- − Repairs & maintenance
- −$11,112
- − Management
- −$11,112
- − Depreciation
- −$33,455
- Taxable income
- $2,919
- Est. tax owed @ 24.0%
- −$700
- After-tax cash flow
- $20,777/yr
For passive investors: Depreciation is non-cash, so a rental often shows a tax loss while cash-flowing — sheltering income. Rental losses are passive: they offset passive income freely, and up to $25,000/yr can offset ordinary (W-2) income if you actively participate and your MAGI is under $100k (phasing out to $0 by $150k); unused losses carry forward. On sale, claimed depreciation is recaptured at up to 25%, and gains may owe capital-gains tax (a 1031 exchange can defer both). Figures are a year-1 estimate at your 24.0% rate — not tax advice; consult a CPA.
Schools (NCES district)
- District
- Nashua School District
- NCES district ID
- 3304980
- Math proficiency
- 27% ▼ -12.00%
- Reading proficiency
- 40% ▼ -6.00%
- Median HH income
- $66,393
- Composite
- 30.62/100
- National rank
- #6189
- State rank
- #77 of 98 in NH
Livability — Nashua
- Score
- 83/100
- State rank
- #11
- US rank
- #983
Category grades
Schools grade is shown separately in the Schools card above.
Census & demographics
- Census place
- Nashua, NH
- County
- Hillsborough County · 309,362 people
- City population
- 91,294
- Metro
- Manchester-Nashua, NH
- Population (ZIP)
- 31,657
- Household income
- $79,855
- Rent vs Own
- Severe rent burden
- 1823.0
Population outlook (Hillsborough County) Hauer SSP2
- Today (2025)
- 412,771 people
- By 2030
- 410,974 · -0.4%
- By 2040
- 399,959 · -3.1%
- By 2050
- 381,542 · -7.6%
- By 2075
- 339,855 · -17.7%
- By 2100
- 289,270 · -29.9%
Race, ethnicity, and origin ACS 2023
- Neighborhood character
- Predominantly White (65%)
- Race & ethnicity
- White 65% Hispanic / Latino 24% Two or more races 16% Asian 4% Black 2%
- Hispanic origin (detail)
- Mexican 6% Puerto Rican 7% Dominican 7%
- Common ancestry
- Lithuanian 8% Romanian 3% Russian 2%
- Foreign-born
- 19% · Canada, Jamaica, China
- Languages at home
- 73% English-only · Spanish 19% Other Indo-European 3% French/Haitian/Cajun 1%
Political lean MEDSL · Hillsborough
- 2024 margin
- Toss-up / Even · D 50.9% · R 48.0% · Other 1.0%
- 2008→2024 swing
- -0.9pp no change · 2008: 3.8pp · 2024: 2.9pp
- All cycles
- 2024: D+2.9 2020: D+7.7 2016: R+0.2 2012: D+1.7 2008: D+3.8
Not yet ingested
- Civics
- —
Market trends
- HPI YoY
- ▼ -130.94%
- Current HPI
- 342.7565
- Rent YoY
- ▲ 3.11%
- Metro
- Manchester-Nashua, NH
- State GDP YoY
- —
- F500 in state
- 0
Price history
+618.8% since first listed10 events — show timeline
- 2026-06-01 Listed $1,150,000 PrimeMLS
- 2025-08-27 Rental Removed $1,400 NEREN
- 2025-08-25 Listed for Rent $1,400 NEREN
- 2024-04-26 Sold (Public Records) $790,533 Public Records
- 2022-04-29 Sold (Public Records) $590,000 Public Records
- 2011-09-26 Sold (MLS) $90,000 PrimeMLS
- 2011-08-11 Listed $119,000 PrimeMLS
- 2007-03-21 Sold (Public Records) $385,000 Public Records
- 1998-11-16 Sold (MLS) $155,000 PrimeMLS
- 1998-04-30 Listed $160,000 PrimeMLS
Property tax history
+5.3%/yrLatest (2025): $10,135 · +5.8% YoY. Source: county tax records.
Cash-flow waterfall
monthlySold comps — $/sqft
last 12 mo · ≤1 miLoading sold comps…