 Multi-family
8 W Fourth St · Cincinnati, OH
Flood risk No data
- FEMA flood zone
- —
- Chance of flooding over 30 yrs
- —
- Est. flood insurance / yr
- —
Fire risk No data
- Est. fire insurance / yr
- —
Heat risk No data
- Hot days now (above threshold)
- —
- Hot days in 30 yrs
- —
Wind risk No data
- Chance of severe wind over 30 yrs
- —
Air-quality risk No data
- Unhealthy air days now
- —
- Unhealthy air days in 30 yrs
- —
Risk factors via First Street. Map © Google.
Why this score? — see what drove the B- grade
The composite is a weighted blend of 9 inputs, each scored 0–100. Each bar is that input's sub-score; the figure is the points it added to the 100-point composite (weight × sub-score).
- Cash flow +30.0/30.0
- 1% rule +10.0/10.0
- DSCR +10.0/10.0
- ARV discount +7.5/15.0
- Livability +4.0/5.0
- Rent growth +3.2/5.0
- Schools +2.5/10.0
- Condition / age +2.5/5.0
- Appreciation +0.0/10.0
$649,000
🖨 Deal sheet 📄 Offer letter ✓ Due diligence
Multi-family units
County records classify this as Multi-Family (5+ Unit). Listing-text estimate: 1 unit. estimate disagrees with records
5+ unit building — per-unit beds/baths from public records are typically unavailable; the breakdown below (if shown) is an estimate from the listing text.
Listing remarks MLS
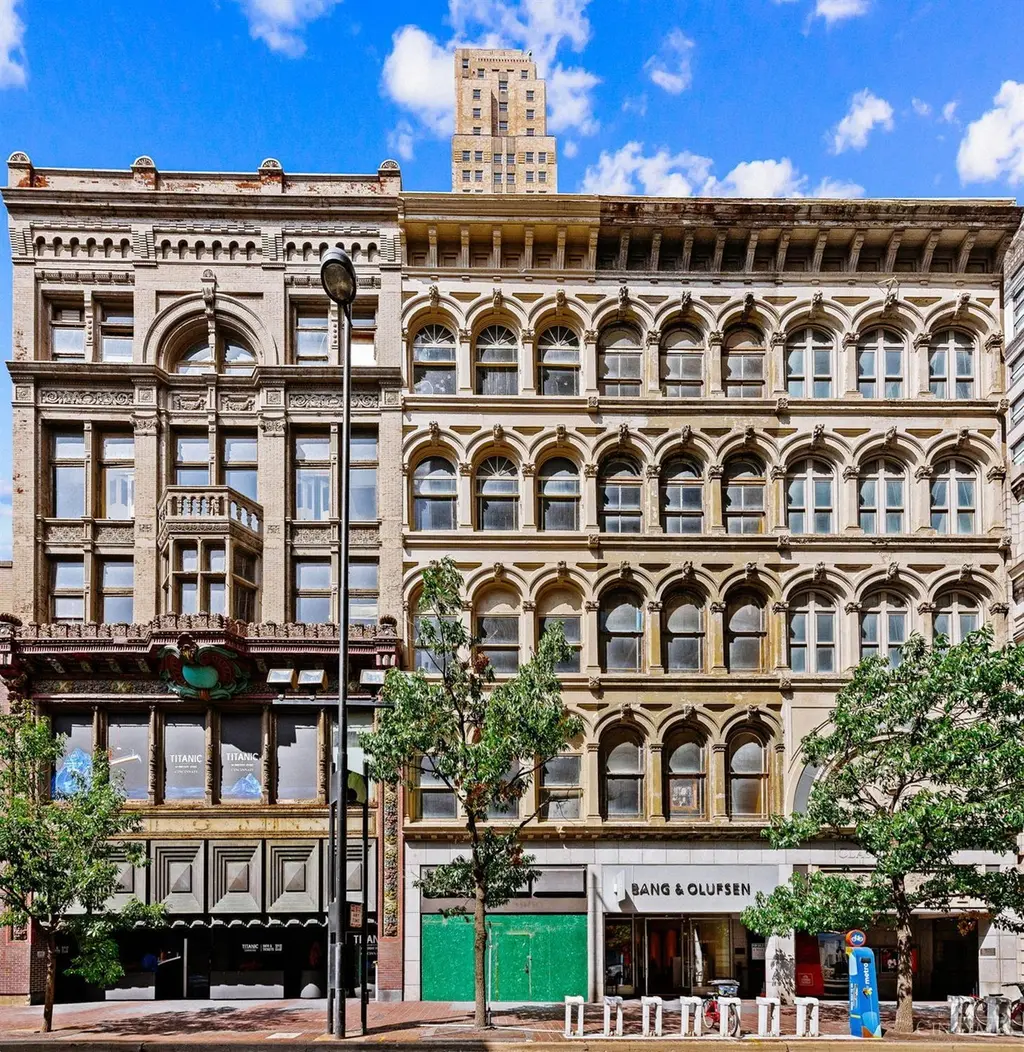
Renovation opportunity near Fountain Square, Stadiums & The Banks! 10,840sf five-story building is ready for your vision. Ornate stone facade with bracketed cornice and arched windows. 2100sf open span floorplates with high ceilings & skylight on 5th floor. Full construction plans are available. Best use is retail on the first floor and residential on the upper floors. Central elevator shaft & new roof. Located in the Downtown Opportunity Zone & zoned DD.
Key facts
- Bracketed cornice
- Ornate stone facade
- Arched windows
Tags
Property features AI
Exterior
- Parking: On-street parking
- Utilities: Public water; Public sewer; Natural gas
- Home design: Quad-level layout; Single building
- Construction: Stone foundation; Stone and brick construction
- Exterior features: Membrane roof; Wood windows
Interior
- Bedrooms: Five 3+ bedroom units (total of 5 units)
- Interior features: Elevator
Neighborhood map
What this means for you Summary
Snapshot
- This is a 15-bed/?-bath multifamily listed at $649k.
Deal economics
- At list price, monthly cash flow is $10k ($125k/yr) — positive.
- The deal already cash-flows at list — no discount required.
- Meets the 1% rule at list price ($19k rent vs $649k).
- Recommended offer: $630k (3.0% below list) — sets the bar for market timing.
- Cap rate 25.6% vs local median 3.9% in Cincinnati — top-decile yield for the area; either an underpriced asset or a hidden risk that comps aren't pricing in. Stress-test before assuming the spread holds.
Location & tenants
- Location reads 80/100 on livability (#130 in OH, #1,856 nationally) — a professional / high-income tenant draw. Strengths: amenities A+, commute A+, cost of living A+; Watch: employment D, crime F.
- Cincinnati Public Schools (urban): math 25% / reading 36% proficiency, ranked #581 of 656 in OH (top 89%) — families likely to look elsewhere, expect single-tenant / working-renter base with shorter leases; 70% free/reduced lunch — lower-income household profile, screen leases tightly.
- Market conditions: Rents rising (+2.7%/yr); 154 active listings in the ZIP; solid renter incomes; 801 units permitted in Hamilton County in 2024 (190 in 5+ unit buildings).
- At $18,900/mo this rent would consume 237% of the median local household income ($96k/yr) (locally 1514% of renters already pay >50% of income on rent) — very limited rent-growth headroom before tenants either downsize or default.
Forward outlook
- Local home prices are declining (-3.0%/yr); year-one equity from $4k of loan paydown is wiped out by about $19k of value loss. Plan a longer hold.
- At projected returns (-3.0% appreciation + 2.7% rent growth), your $182k cash investment doubles in ~2 years — after that, you're playing with house money.
Negotiation context
- It's been on market 38 days — a 3% lower offer ($630k) is reasonable based on typical stale-listing flexibility.
- 12 sale attempts since 7y ago with the ask held roughly flat each time — persistent listings suggest the price (not the market) is what's stuck; bring a comps-based counter.
Risks & watch-outs
- Watch-outs: built in 1850 — expect roof / HVAC / electrical / plumbing capex.
Questions for the listing agent
- It's been on market 38 days. Have you received any prior offers? Is the seller open to a 3% concession, seller financing, or rate buy-down credit?
- Built in 1850 — when were the roof, HVAC, electrical panel, plumbing, and water heater last replaced?
- Is there a deadline driving the sale (1031 exchange, divorce, estate, relocation)? That informs how much negotiation room exists.
- Schools are B-rated — typically a magnet for longer-tenancy family renters. What's the average tenant stay here, and is there a school-zone premium baked into asking?
- Crime grade is F in this area — have there been break-ins, vandalism, or insurance claims at this property in the last 3 years? What carrier currently insures it and at what premium?
- What's the average days-on-market for RENTAL listings here right now (not sales)? A rising rental-DOM trend means longer vacancies and softer asking-rent achievability than the comps imply.
- What's the recent tenant-quality profile in this submarket — average credit score on applications, eviction rate, late-payment / NSF rate, and stable-employment percentage? A property-management company in the area should have these aggregated.
- How much new apartment / multifamily construction is in the pipeline within 1–3 miles? Heavy new supply (>2% of stock underway) typically softens rents 12–24 months out; light construction supports rent growth.
Investment metrics
- 1% rule
- 2.91% ✓
- Cap rate
- 25.61%
- Cash-on-cash
- 68.98%
- DSCR
- 4.07
- GRM
- 2.9
CMA / ARV
No comps found within radius.
Projected returns pro-forma
-3.0% appreciation · 2.7% rent growth · sell at horizon
- IRR
- 68.1%
- Equity multiple
- 4.05×
- Total profit
- $554,736
- Equity at exit
- $96,768
- IRR
- 72.2%
- Equity multiple
- 8.25×
- Total profit
- $1,317,700
- Equity at exit
- $56,114
Cash invested: $181,720 (down + closing). Projections, not guarantees.
Landlord ↔ Tenant lean methodology
- Overall (STATE)
- 73 Landlord-Friendly
- State Ohio
- 73 Landlord-Friendly · R+6
- County
- — inherits STATE
- City
- — inherits STATE
ZIP-level market 45202
- Rents YoY
- 2.7%
- Active inventory
- 154
- Price-to-rent
- 28.6×
Monthly cashflow live
- Estimated rent
- $18,900 high interval (Pro) →
- Mortgage (P&I)
- −$3,403
- Tax est. 1.5%
- −$811 /mo · $9,735/yr
- Insurance
- −$270
- HOA
- −$0
- Vacancy / Maint / Mgmt
- −$3,969
- Net cashflow
- $10,446
Break-even live
10-unit breakdown (identical units grouped — click to expand)
| Units | Beds | Baths | Est. rent |
|---|---|---|---|
| 10× units | 1 | 1 | $18,900 |
| #1 | 1 | 1 | $1,890 |
| #2 | 1 | 1 | $1,890 |
| #3 | 1 | 1 | $1,890 |
| #4 | 1 | 1 | $1,890 |
| #5 | 1 | 1 | $1,890 |
| #6 | 1 | 1 | $1,890 |
| #7 | 1 | 1 | $1,890 |
| #8 | 1 | 1 | $1,890 |
| #9 | 1 | 1 | $1,890 |
| #10 | 1 | 1 | $1,890 |
| Total (10 units) | $18,900 | ||
UW: 25.0% down · 7.5% · 30yr · 1.5% tax · 5.0% vac · 8.0% maint · 8.0% mgmt
Financing live
Cash to close
- Down payment
- $162,250
- Closing costs
- $19,470
- Reserves months
- —
- Total cash needed
- —
Loan-product check · same deal, 3 products live
Conventional
25% down · 7.5% · 30yr
- Down + closing
- —
- Monthly P&I
- —
- Monthly cashflow
- —
- DSCR
- —
- Eligible?
- —
Personal DTI + credit; lowest rate.
DSCR
20% down · 8.5% · 30yr
- Down + closing
- —
- Monthly P&I
- —
- Monthly cashflow
- —
- DSCR
- —
- Eligible?
- —
No personal income docs; deal must DSCR.
Hard money
10% down · 12.0% · 12mo
- Down + closing
- —
- Monthly P&I
- —
- Monthly cashflow
- —
- DSCR
- —
- Eligible?
- —
Short-term bridge; refi at stabilization.
Listing history 43 events
-
2026-06-18days on market $649,000 Active 38 DOM
-
2026-06-17days on market $649,000 Active 37 DOM
-
2026-06-16days on market $649,000 Active 36 DOM
-
2026-06-15days on market $649,000 Active 35 DOM
-
2026-06-13days on market $649,000 Active 33 DOM
-
2026-06-13days on market $649,000 Active 32 DOM
-
2026-06-09days on market $649,000 Active 29 DOM
-
2026-06-08days on market $649,000 Active 28 DOM
-
2026-06-07days on market $649,000 Active 27 DOM
-
2026-06-03days on market $649,000 Active 23 DOM
-
2026-06-02days on market $649,000 Active 22 DOM
-
2026-06-01days on market $649,000 Active 21 DOM
-
2026-05-31days on market $649,000 Active 20 DOM
-
2026-05-11$649,000 Active
-
2026-04-15historical 475-char remark
Show marketing remark (475 chars)
Renovation opportunity near Fountain Square, Stadiums & The Banks! 10,840sf five-story building is ready for your vision. Ornate stone facade with bracketed cornice and arched windows. 2100sf open span floorplates with high ceilings & skylight on 5th floor. Full construction plans are available. Best use is retail on the first floor and residential on the upper floors. Central elevator shaft & new roof. Located in the Downtown Opportunity Zone & zoned DD.
-
2026-03-06price $699,000 475-char remark
Show marketing remark (475 chars)
Renovation opportunity near Fountain Square, Stadiums & The Banks! 10,840sf five-story building is ready for your vision. Ornate stone facade with bracketed cornice and arched windows. 2100sf open span floorplates with high ceilings & skylight on 5th floor. Full construction plans are available. Best use is retail on the first floor and residential on the upper floors. Central elevator shaft & new roof. Located in the Downtown Opportunity Zone & zoned DD.
-
2026-01-27price $749,000 475-char remark
Show marketing remark (475 chars)
Renovation opportunity near Fountain Square, Stadiums & The Banks! 10,840sf five-story building is ready for your vision. Ornate stone facade with bracketed cornice and arched windows. 2100sf open span floorplates with high ceilings & skylight on 5th floor. Full construction plans are available. Best use is retail on the first floor and residential on the upper floors. Central elevator shaft & new roof. Located in the Downtown Opportunity Zone & zoned DD.
-
2025-12-16$779,000 Active 475-char remark
Show marketing remark (475 chars)
Renovation opportunity near Fountain Square, Stadiums & The Banks! 10,840sf five-story building is ready for your vision. Ornate stone facade with bracketed cornice and arched windows. 2100sf open span floorplates with high ceilings & skylight on 5th floor. Full construction plans are available. Best use is retail on the first floor and residential on the upper floors. Central elevator shaft & new roof. Located in the Downtown Opportunity Zone & zoned DD.
-
2025-12-08historical 475-char remark
Show marketing remark (475 chars)
Renovation opportunity near Fountain Square, Stadiums & The Banks! 10,840sf five-story building is ready for your vision. Ornate stone facade with bracketed cornice and arched windows. 2100sf open span floorplates with high ceilings & skylight on 5th floor. Full construction plans are available. Best use is retail on the first floor and residential on the upper floors. Central elevator shaft & new roof. Located in the Downtown Opportunity Zone & zoned DD.
-
2025-12-01status Active 475-char remark
Show marketing remark (475 chars)
Renovation opportunity near Fountain Square, Stadiums & The Banks! 10,840sf five-story building is ready for your vision. Ornate stone facade with bracketed cornice and arched windows. 2100sf open span floorplates with high ceilings & skylight on 5th floor. Full construction plans are available. Best use is retail on the first floor and residential on the upper floors. Central elevator shaft & new roof. Located in the Downtown Opportunity Zone & zoned DD.
-
2025-09-22historical Contingency Pending 475-char remark
Show marketing remark (475 chars)
Renovation opportunity near Fountain Square, Stadiums & The Banks! 10,840sf five-story building is ready for your vision. Ornate stone facade with bracketed cornice and arched windows. 2100sf open span floorplates with high ceilings & skylight on 5th floor. Full construction plans are available. Best use is retail on the first floor and residential on the upper floors. Central elevator shaft & new roof. Located in the Downtown Opportunity Zone & zoned DD.
-
2025-09-08$779,000 Active 475-char remark
Show marketing remark (475 chars)
Renovation opportunity near Fountain Square, Stadiums & The Banks! 10,840sf five-story building is ready for your vision. Ornate stone facade with bracketed cornice and arched windows. 2100sf open span floorplates with high ceilings & skylight on 5th floor. Full construction plans are available. Best use is retail on the first floor and residential on the upper floors. Central elevator shaft & new roof. Located in the Downtown Opportunity Zone & zoned DD.
-
2025-01-31historical
-
2025-01-15$799,900 Active
-
2025-01-15historical
-
2024-11-15price $799,900
-
2024-02-25$859,000 Active
-
2022-07-11soldstatus $600,000 Sold
-
2022-05-06historical Contingency Pending
-
2022-02-06$595,000 Active
-
2022-01-26historical
-
2021-01-16$575,000 Active
-
2021-01-04historical
-
2020-09-23price $560,000
-
2020-07-02$595,000 Active
-
2020-01-13historical
-
2019-10-03status Active
-
2019-09-21historical Contingency Pending
-
2019-07-09price $550,000
-
2019-06-06status Active
-
2019-05-02historical Accept Backup Offers
-
2019-05-01price $600,000
-
2019-03-25$550,000 Active
ⓘ Source: listings_history table (triggers on properties + properties_extension) + one-shot
backfill from property_details.listing_events for pre-trigger history.
Nearby sold comps map
Loading sold comps map…
Walkable amenities ~0.75 mi
Loading nearby amenities…
Taxation est. · year 1
- Rental income
- $226,800
- − Mortgage interest
- −$36,354
- − Property taxes
- −$9,735
- − Insurance
- −$3,245
- − Repairs & maintenance
- −$18,144
- − Management
- −$18,144
- − Depreciation
- −$18,880
- Taxable income
- $122,298
- Est. tax owed @ 24.0%
- −$29,351
- After-tax cash flow
- $95,999/yr
For passive investors: Depreciation is non-cash, so a rental often shows a tax loss while cash-flowing — sheltering income. Rental losses are passive: they offset passive income freely, and up to $25,000/yr can offset ordinary (W-2) income if you actively participate and your MAGI is under $100k (phasing out to $0 by $150k); unused losses carry forward. On sale, claimed depreciation is recaptured at up to 25%, and gains may owe capital-gains tax (a 1031 exchange can defer both). Figures are a year-1 estimate at your 24.0% rate — not tax advice; consult a CPA.
Schools (NCES district)
- District
- Cincinnati Public Schools
- NCES district ID
- 3904375
- Math proficiency
- 25% ▼ -19.00%
- Reading proficiency
- 36% ▼ -14.00%
- Median HH income
- $35,743
- Composite
- 25.21/100
- National rank
- #7508
- State rank
- #581 of 656 in OH
Livability — Cincinnati
- Score
- 80/100
- State rank
- #130
- US rank
- #1856
Category grades
Schools grade is shown separately in the Schools card above.
Census & demographics
- Census place
- Cincinnati, OH
- County
- Hamilton County · 701,295 people
- City population
- 505,555
- Metro
- Cincinnati, OH-KY-IN
- Population (ZIP)
- 17,869
- Household income
- $95,633
- Rent vs Own
- Severe rent burden
- 1514.0
Population outlook (Hamilton County) Hauer SSP2
- Today (2025)
- 826,054 people
- By 2030
- 830,947 · +0.6%
- By 2040
- 832,319 · +0.8%
- By 2050
- 822,428 · -0.4%
- By 2075
- 788,688 · -4.5%
- By 2100
- 710,674 · -14.0%
Race, ethnicity, and origin ACS 2023
- Neighborhood character
- Majority White (64%)
- Race & ethnicity
- White 64% Black 23% Two or more races 6% Asian 4% Hispanic / Latino 2%
- Common ancestry
- Italian 2% Lithuanian 2% Romanian 2%
- Foreign-born
- 7% · Canada, China, South Korea
- Languages at home
- 91% English-only · Other Indo-European 2% Spanish 2% Other Asian/Pacific 1%
Political lean MEDSL · Hamilton
- 2024 margin
- D (+14.9) · D 57.0% · R 42.1%
- 2008→2024 swing
- +7.9pp toward D · 2008: 7.0pp · 2024: 14.9pp
- All cycles
- 2024: D+14.9 2020: D+15.9 2016: D+9.5 2012: D+4.9 2008: D+7.0
Not yet ingested
- Civics
- —
Market trends
- HPI YoY
- ▼ -219.24%
- Current HPI
- 233.4526
- Rent YoY
- ▲ 2.70%
- Metro
- Cincinnati, OH-KY-IN
- State GDP YoY
- ▲ 1.98%
- F500 in state
- 48
Industry mix (Fortune 500 HQ in OH)
| Industry | F500 HQs | Revenue |
|---|---|---|
| Insurance | 3 | $145B |
|
||
| Industrial Machinery | 3 | $49B |
|
||
| Financial Services | 3 | $24B |
|
||
| Consumer Goods | 2 | $93B |
|
||
| Aerospace / Defense | 2 | $47B |
|
||
| Utilities | 2 | $33B |
|
||
Price history
+18.0% since first listed30 events — show timeline
- 2026-05-11 Listed $649,000 Cincy MLS
- 2026-04-15 Listing Removed — Cincy MLS
- 2026-03-06 Price Changed $699,000 Cincy MLS
- 2026-01-27 Price Changed $749,000 Cincy MLS
- 2025-12-16 Listed $779,000 Cincy MLS
- 2025-12-08 Listing Removed — Cincy MLS
- 2025-12-01 Relisted — Cincy MLS
- 2025-09-22 Contingent — Cincy MLS
- 2025-09-08 Listed $779,000 Cincy MLS
- 2025-01-31 Listing Removed — Cincy MLS
- 2025-01-15 Listing Removed — Cincy MLS
- 2025-01-15 Listed $799,900 Cincy MLS
- 2024-11-15 Price Changed $799,900 Cincy MLS
- 2024-02-25 Listed $859,000 Cincy MLS
- 2022-07-11 Sold (MLS) $600,000 Cincy MLS
- 2022-05-06 Contingent — Cincy MLS
- 2022-02-06 Listed $595,000 Cincy MLS
- 2022-01-26 Listing Removed — Cincy MLS
- 2021-01-16 Listed $575,000 Cincy MLS
- 2021-01-04 Listing Removed — Cincy MLS
- 2020-09-23 Price Changed $560,000 Cincy MLS
- 2020-07-02 Listed $595,000 Cincy MLS
- 2020-01-13 Listing Removed — Cincy MLS
- 2019-10-03 Relisted — Cincy MLS
- 2019-09-21 Contingent — Cincy MLS
- 2019-07-09 Price Changed $550,000 Cincy MLS
- 2019-06-06 Relisted — Cincy MLS
- 2019-05-02 Contingent — Cincy MLS
- 2019-05-01 Price Changed $600,000 Cincy MLS
- 2019-03-25 Listed $550,000 Cincy MLS
Cash-flow waterfall
monthlySold comps — $/sqft
last 12 mo · ≤1 miLoading sold comps…