 Duplex
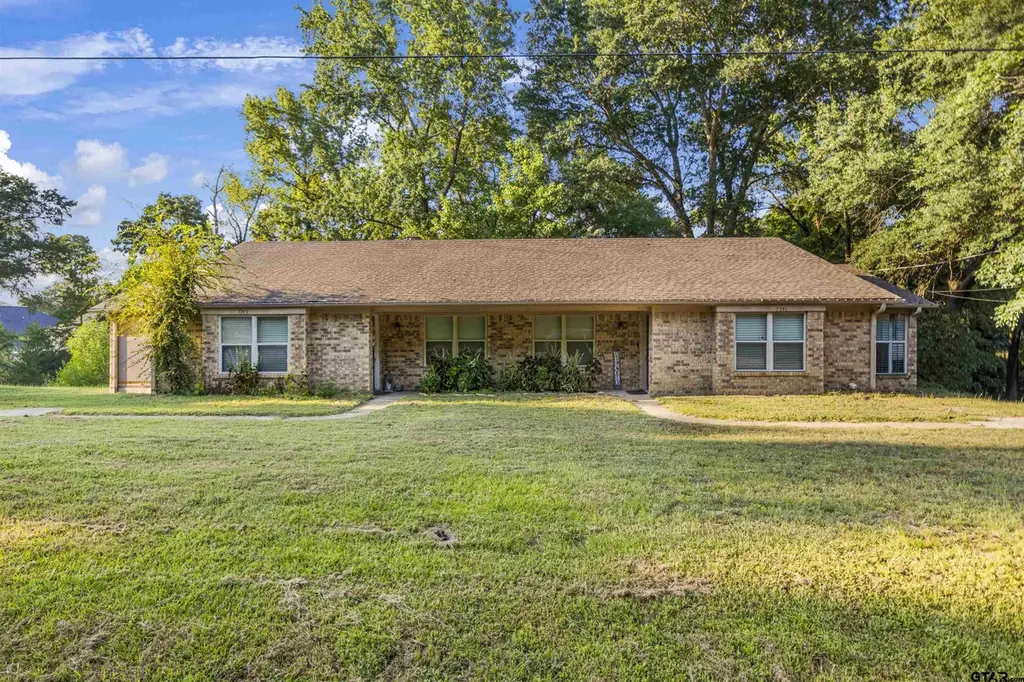
7741 & 7743 Cr 2307 · Tyler, TX
Flood risk 1/10 · Minimal
- FEMA flood zone
- X (unshaded)
- Chance of flooding over 30 yrs
- 0.0%
- Est. flood insurance / yr
- $507 – $1,088
Fire risk 4/10 · Minor
- Est. fire insurance / yr
- $1,222 – $2,270
Heat risk 6/10 · Moderate
- Hot days now (above 109°F)
- 7 days/yr
- Hot days in 30 yrs
- 26 days/yr
Wind risk 6/10 · Moderate
- Chance of severe wind over 30 yrs
- 67.0%
Air-quality risk 2/10 · Minimal
- Unhealthy air days now
- 0 days/yr
- Unhealthy air days in 30 yrs
- 1 days/yr
Risk factors via First Street. Map © Google.
Why this score? — see what drove the C+ grade
The composite is a weighted blend of 9 inputs, each scored 0–100. Each bar is that input's sub-score; the figure is the points it added to the 100-point composite (weight × sub-score).
- Cash flow +26.2/30.0
- DSCR +8.9/10.0
- ARV discount +7.5/15.0
- 1% rule +6.6/10.0
- Schools +5.5/10.0
- Livability +3.8/5.0
- Rent growth +3.2/5.0
- Condition / age +2.5/5.0
- Appreciation +0.0/10.0
$299,000
🖨 Deal sheet 📄 Offer letter ✓ Due diligence
Multi-family units
County records classify this as Multi-Family (2-4 Unit). Listing-text estimate: 2 units. confirmed
Listing remarks MLS
This fully occupied duplex located in Whitehouse, TX is just waiting to be added to your investment portfolio! With both leases already secured through mid-2026 and early 2027, this is an amazing opportunity for both seasoned investors looking to expand or those just starting out in the rental industry. Each side features its own single car garage, private entrance, 2 bedrooms, 2 bathrooms, a living room and kitchen. It is conveniently located just minutes from all the amenities Tyler has to offer and is less than 5 miles from the middle of Whitehouse. The street behind this property is home to Guinn Farms which is an established subdivision with a history of renters. This is a fantastic opportunity; take advantage while you can!
Key facts
- 0.47 acre lot
- Garage
- Built 1984
Neighborhood map
What this means for you Summary
Snapshot
- This is a 2 × 2-bed/2.0-bath units multifamily listed at $299k.
Deal economics
- At list price, monthly cash flow is $763 ($9k/yr) — positive. Per door: $382/mo.
- The deal already cash-flows at list — no discount required.
- Meets the 1% rule at list price ($3k rent vs $299k).
- Recommended offer: $281k (6.0% below list) — sets the bar for market timing.
- Cap rate 9.4% vs local median 3.6% in Tyler — top-decile yield for the area; either an underpriced asset or a hidden risk that comps aren't pricing in. Stress-test before assuming the spread holds.
Location & tenants
- Location reads 75/100 on livability (#147 in TX, #4,181 nationally) — a middle-class / working-renter tenant base. Strengths: cost of living A+, housing A+, health & safety A+; Watch: employment C-, schools D+, crime D+.
- Whitehouse ISD (suburban): math 68% / reading 59% proficiency, ranked #38 of 826 in TX (top 5%) — acceptable for families but not a draw, mixed tenant base, ~2y average lease.
- Market conditions: Rents rising (+2.9%/yr); 196 active listings in the ZIP; 17 comparable units currently listed for rent nearby; rentals lingering (median 44d on market — plan ~5-8 weeks vacancy on turnover, expect pricing pressure); 59% of comp listings sitting > 30 days — soft ceiling on asking rent; solid renter incomes; 595 units permitted in Smith County in 2024 (45 in 5+ unit buildings).
- At $3,461/mo this rent would consume 45% of the median local household income ($92k/yr) (locally 313% of renters already pay >50% of income on rent) — very limited rent-growth headroom before tenants either downsize or default.
Forward outlook
- Local home prices are declining (-3.0%/yr); year-one equity from $2k of loan paydown is wiped out by about $9k of value loss. Plan a longer hold.
- Smith County population projected at +24% by 2050 — long-run rental-demand tailwind backs the buy-and-hold thesis.
- At projected returns (-3.0% appreciation + 2.9% rent growth), your $84k cash investment doubles in ~10 years — after that, you're playing with house money.
Negotiation context
- It's been on market 66 days — a 6% lower offer ($281k) is reasonable based on typical stale-listing flexibility.
- 3 sale attempts since 11y ago with the ask held roughly flat each time — persistent listings suggest the price (not the market) is what's stuck; bring a comps-based counter.
Risks & watch-outs
- Climate carrying-cost: major wind risk, 67% chance of damaging wind over 30y; extreme-heat days projected 7→26/yr by 2055 (HVAC capex compounding) — expect insurance premiums to compound above CPI over the hold.
Questions for the listing agent
- It's been on market 66 days. Have you received any prior offers? Is the seller open to a 6% concession, seller financing, or rate buy-down credit?
- Can we see the unit-by-unit rent roll, current vacancy, and any below-market leases? What's the average tenancy length?
- What capital expenditures (roof, boiler, parking lot, exteriors) have been made in the last 5 years, and what's planned in the next 2?
- Why hasn't it sold? Are there any deal-killer items the seller is aware of (foundation, flood, title, zoning, code violations)?
- Is there a deadline driving the sale (1031 exchange, divorce, estate, relocation)? That informs how much negotiation room exists.
- Schools are D-rated, which usually means shorter tenancies and higher turnover. Who's the typical renter profile here, and what's been the actual vacancy rate?
- Crime grade is D in this area — have there been break-ins, vandalism, or insurance claims at this property in the last 3 years? What carrier currently insures it and at what premium?
- What's the average days-on-market for RENTAL listings here right now (not sales)? A rising rental-DOM trend means longer vacancies and softer asking-rent achievability than the comps imply.
- What's the recent tenant-quality profile in this submarket — average credit score on applications, eviction rate, late-payment / NSF rate, and stable-employment percentage? A property-management company in the area should have these aggregated.
- How much new apartment / multifamily construction is in the pipeline within 1–3 miles? Heavy new supply (>2% of stock underway) typically softens rents 12–24 months out; light construction supports rent growth.
Investment metrics
- 1% rule
- 1.16% ✓
- Cap rate
- 9.36%
- Cash-on-cash
- 10.94%
- DSCR
- 1.49
- GRM
- 7.2
CMA / ARV
No comps found within radius.
Projected returns pro-forma
-3.0% appreciation · 2.94% rent growth · sell at horizon
- IRR
- -0.0%
- Equity multiple
- 1.00×
- Total profit
- $-52
- Equity at exit
- $44,582
- IRR
- 9.6%
- Equity multiple
- 1.74×
- Total profit
- $61,672
- Equity at exit
- $25,852
Cash invested: $83,720 (down + closing). Projections, not guarantees.
Landlord ↔ Tenant lean methodology
- Overall (STATE)
- 87 Strongly Landlord-Friendly
- State Texas
- 87 Strongly Landlord-Friendly · R+5
- County
- — inherits STATE
- City
- — inherits STATE
ZIP-level market 75791
- Home prices YoY
- -29.0%
- Rents YoY
- 2.9%
- Active inventory
- 196
- Price-to-rent
- 14.4×
Monthly cashflow live
- Estimated rent
- $3,461 high interval (Pro) →
- Mortgage (P&I)
- −$1,568
- Tax from tax record
- −$278 /mo · $3,340/yr
- Insurance
- −$125
- HOA
- −$0
- Vacancy / Maint / Mgmt
- −$727
- Net cashflow
- $763
Break-even live
2-unit breakdown (identical units grouped — click to expand)
| Units | Beds | Baths | Est. rent |
|---|---|---|---|
| 2× units | 2 | 2 | $3,462 |
| #1 | 2 | 2 | $1,731 |
| #2 | 2 | 2 | $1,731 |
| Total (2 units) | $3,461 | ||
UW: 25.0% down · 7.5% · 30yr · 1.5% tax · 5.0% vac · 8.0% maint · 8.0% mgmt
Financing live
Cash to close
- Down payment
- $74,750
- Closing costs
- $8,970
- Reserves months
- —
- Total cash needed
- —
Loan-product check · same deal, 3 products live
Conventional
25% down · 7.5% · 30yr
- Down + closing
- —
- Monthly P&I
- —
- Monthly cashflow
- —
- DSCR
- —
- Eligible?
- —
Personal DTI + credit; lowest rate.
DSCR
20% down · 8.5% · 30yr
- Down + closing
- —
- Monthly P&I
- —
- Monthly cashflow
- —
- DSCR
- —
- Eligible?
- —
No personal income docs; deal must DSCR.
Hard money
10% down · 12.0% · 12mo
- Down + closing
- —
- Monthly P&I
- —
- Monthly cashflow
- —
- DSCR
- —
- Eligible?
- —
Short-term bridge; refi at stabilization.
Rent comps 17 comps
| Address | Beds | Baths | Sqft | Rent | $/sqft | DOM | Units | Dist |
|---|---|---|---|---|---|---|---|---|
| 6036 Villa Rosa Way Unit 6036 Tyler, TX | 3.0 | 2.0 | 1498 | $1,850 | $1.23 | 43d | 1 | 0.18mi |
| 6215 Villa Rosa Way Unit 6215 Tyler, TX | 3.0 | 2.5 | 1556 | $1,850 | $1.19 | 21d | 1 | 0.19mi |
| 6219 Villa Rosa Way Tyler, TX | 3.0 | 2.5 | 1556 | $1,795 | $1.15 | 13d | 1 | 0.21mi |
| 6218 Villa Rosa Way Unit 6218 Tyler, TX | 3.0 | 2.0 | 1498 | $1,895 | $1.27 | 43d | 1 | 0.21mi |
| 6225 Villa Rosa Way Unit 6225 Tyler, TX | 3.0 | 2.5 | 1556 | $1,795 | $1.15 | 13d | 1 | 0.22mi |
| 6017 Villa Rosa Way Unit 6017 Tyler, TX | 3.0 | 2.0 | 1498 | $1,895 | $1.27 | 21d | 1 | 0.23mi |
| 7069 Hillside Ave Tyler, TX | 3.0 | 2.5 | 1882 | $2,695 | $1.43 | 43d | 1 | 0.23mi |
| 6228 Villa Rosa Way Unit 6228 Tyler, TX | 3.0 | 2.0 | 1498 | $1,895 | $1.27 | 43d | 1 | 0.23mi |
| 6015 Villa Rosa Way Tyler, TX | 3.0 | 2.0 | 1498 | $1,895 | $1.27 | 43d | 1 | 0.24mi |
| 14659 County Road 2191 Whitehouse, TX | 2.0–3.0 | 2.0–2.5 | 1325 | $1,995 | $1.51 | 13d | 3 | 0.25mi |
| 6331 Villa Rosa Way Unit 6331 Tyler, TX | 3.0 | 2.0 | 1498 | $1,895 | $1.27 | 21d | 1 | 0.30mi |
| 6505 Rhones Quarter Rd Tyler, TX | 2.0–3.0 | 2.5 | 1331 | $1,995 | $1.50 | 43d | 3 | 0.54mi |
| 3021 Naomi Dr Tyler, TX | 3.0 | 3.0 | 1412 | $1,950 | $1.38 | 43d | 1 | 0.55mi |
| 8856 Pleasant Hill Cir Tyler, TX | 3.0 | 2.0 | 2000 | $3,200 | $1.60 | 13d | 1 | 0.79mi |
| 13370 State Highway 110 S Tyler, TX | 3.0 | 2.0 | 2281 | $1,950 | $0.85 | 43d | 1 | 1.16mi |
| 5716 Thomas Nelson Dr Tyler, TX | 3.0 | 2.0 | 1855 | $2,300 | $1.24 | 43d | 1 | 1.21mi |
| 5603 Thomas Nelson Dr Tyler, TX | 3.0 | 2.0 | 1880 | $2,500 | $1.33 | 43d | 1 | 1.37mi |
Listing history 24 events
-
2026-06-19days on market $299,000 Active 66 DOM
-
2026-06-18days on market $299,000 Active 65 DOM
-
2026-06-17days on market $299,000 Active 64 DOM
-
2026-06-16days on market $299,000 Active 63 DOM
-
2026-06-15days on market $299,000 Active 62 DOM
-
2026-06-14days on market $299,000 Active 60 DOM
-
2026-06-13days on market $299,000 Active 59 DOM
-
2026-06-10days on market $299,000 Active 57 DOM
-
2026-06-09days on market $299,000 Active 56 DOM
-
2026-06-08days on market $299,000 Active 55 DOM
-
2026-06-07days on market $299,000 Active 54 DOM
-
2026-06-05days on market $299,000 Active 51 DOM
-
2026-06-02days on market $299,000 Active 49 DOM
-
2026-06-01days on market $299,000 Active 48 DOM
-
2026-05-31days on market $299,000 Active 47 DOM
-
2026-05-30days on market $299,000 Active 46 DOM
-
2026-04-14$299,000 Active 739-char remark
Show marketing remark (739 chars)
This fully occupied duplex located in Whitehouse, TX is just waiting to be added to your investment portfolio! With both leases already secured through mid-2026 and early 2027, this is an amazing opportunity for both seasoned investors looking to expand or those just starting out in the rental industry. Each side features its own single car garage, private entrance, 2 bedrooms, 2 bathrooms, a living room and kitchen. It is conveniently located just minutes from all the amenities Tyler has to offer and is less than 5 miles from the middle of Whitehouse. The street behind this property is home to Guinn Farms which is an established subdivision with a history of renters. This is a fantastic opportunity; take advantage while you can!
-
2023-09-12historical 82-char remark
Show marketing remark (82 chars)
THIS PROPERTY IS LOCATED SOUTH OF ROY ROAD AND OFF RHONES QUARTER ROAD ON CR 2307.
-
2023-09-12historical
Show marketing remark (82 chars)
THIS PROPERTY IS LOCATED SOUTH OF ROY ROAD AND OFF RHONES QUARTER ROAD ON CR 2307.
-
2018-09-24soldstatus
-
2018-08-22$179,000
-
2015-08-14$145,000 82-char remark
Show marketing remark (82 chars)
THIS PROPERTY IS LOCATED SOUTH OF ROY ROAD AND OFF RHONES QUARTER ROAD ON CR 2307.
-
2009-09-16soldstatus
-
1999-07-19soldstatus
ⓘ Source: listings_history table (triggers on properties + properties_extension) + one-shot
backfill from property_details.listing_events for pre-trigger history.
Tax reassessment forecast TX · Resets to sale price
- Current annual tax
- $3,340 · $278/mo
- Projected year-2 tax
- $5,472 · $456/mo
- Expected delta
- +$2,132/yr (+$178/mo · 63.8%)
ⓘ Screening estimate from a state-policy table — verify with the county assessor before closing.
Climate risk First Street
- Flood 1/10 Low FEMA zone X (unshaded) · 0% chance over 30 yrs
- Wildfire 4/10 Moderate
- Heat 6/10 Major 7 d/yr ≥109°F today · 26 d/yr by 30 yrs out
- Wind 6/10 Major 67% chance of damaging wind over 30 yrs
- Air quality 2/10 Low 0 unhealthy d/yr today · 1 by 30 yrs out
Nearby sold comps map
Loading sold comps map…
Walkable amenities ~0.75 mi
Loading nearby amenities…
Taxation est. · year 1
- Rental income
- $41,532
- − Mortgage interest
- −$16,749
- − Property taxes
- −$3,340
- − Insurance
- −$1,495
- − Repairs & maintenance
- −$3,323
- − Management
- −$3,323
- − Depreciation
- −$8,698
- Taxable income
- $4,605
- Est. tax owed @ 24.0%
- −$1,105
- After-tax cash flow
- $8,054/yr
For passive investors: Depreciation is non-cash, so a rental often shows a tax loss while cash-flowing — sheltering income. Rental losses are passive: they offset passive income freely, and up to $25,000/yr can offset ordinary (W-2) income if you actively participate and your MAGI is under $100k (phasing out to $0 by $150k); unused losses carry forward. On sale, claimed depreciation is recaptured at up to 25%, and gains may owe capital-gains tax (a 1031 exchange can defer both). Figures are a year-1 estimate at your 24.0% rate — not tax advice; consult a CPA.
Schools (NCES district)
- District
- Whitehouse ISD
- NCES district ID
- 4845600
- Math proficiency
- 68% ▼ -4.00%
- Reading proficiency
- 59% ▼ -1.00%
- Median HH income
- $62,060
- Composite
- 55.18/100
- National rank
- #1274
- State rank
- #38 of 826 in TX
Livability — Tyler
- Score
- 75/100
- State rank
- #147
- US rank
- #4181
Category grades
Schools grade is shown separately in the Schools card above.
Census & demographics
- County
- Smith County · 180,570 people
- City population
- 127,842
- Metro
- Tyler, TX
- Population (ZIP)
- 15,786
- Household income
- $92,107
- Rent vs Own
- Severe rent burden
- 313.0
Population outlook (Smith County) Hauer SSP2
- Today (2025)
- 248,890 people
- By 2030
- 261,665 · +5.1%
- By 2040
- 286,114 · +15.0%
- By 2050
- 308,006 · +23.8%
- By 2075
- 354,171 · +42.3%
- By 2100
- 372,828 · +49.8%
Race, ethnicity, and origin ACS 2023
- Neighborhood character
- Predominantly White (81%)
- Race & ethnicity
- White 81% Hispanic / Latino 8% Two or more races 8% Black 6%
- Hispanic origin (detail)
- Mexican 7% Salvadoran 1%
- Common ancestry
- Lithuanian 2% Italian 2% Iranian 2%
- Foreign-born
- 3% · Canada, Dominican Republic
- Languages at home
- 93% English-only · Spanish 6% Chinese 1%
Political lean MEDSL · Smith
- 2024 margin
- Solid R (+45.1) · D 27.0% · R 72.1%
- 2008→2024 swing
- -5.6pp toward R · 2008: -39.5pp · 2024: -45.1pp
- All cycles
- 2024: R+45.1 2020: R+39.4 2016: R+43.9 2012: R+46.9 2008: R+39.5
Not yet ingested
- Civics
- —
Market trends
- HPI YoY
- ▼ -82.16%
- Current HPI
- 201.297
- Rent YoY
- ▲ 2.94%
- Metro
- Tyler, TX
- State GDP YoY
- ▲ 3.95%
- F500 in state
- 110
Industry mix (Fortune 500 HQ in TX)
| Industry | F500 HQs | Revenue |
|---|---|---|
| Energy | 16 | $1,198B |
|
||
| Technology | 5 | $198B |
|
||
| Engineering / Construction | 4 | $72B |
|
||
| Energy Services | 3 | $60B |
|
||
| Utilities | 3 | $41B |
|
||
| Healthcare | 2 | $330B |
|
||
Price history
+106.2% since first listed8 events — show timeline
- 2026-04-14 Listed $299,000 GTAR
- 2023-09-12 Delisted — GTAR
- 2023-09-12 Delisted — GTAR
- 2018-09-24 Sold (Public Records) — Public Records
- 2018-08-22 Listed $179,000 GTAR
- 2015-08-14 Listed $145,000 GTAR
- 2009-09-16 Sold (Public Records) — Public Records
- 1999-07-19 Sold (Public Records) — Public Records
Property tax history
+6.3%/yrLatest (2024): $3,340 · +8.4% YoY. Source: county tax records.
Cash-flow waterfall
monthlySold comps — $/sqft
last 12 mo · ≤1 miLoading sold comps…