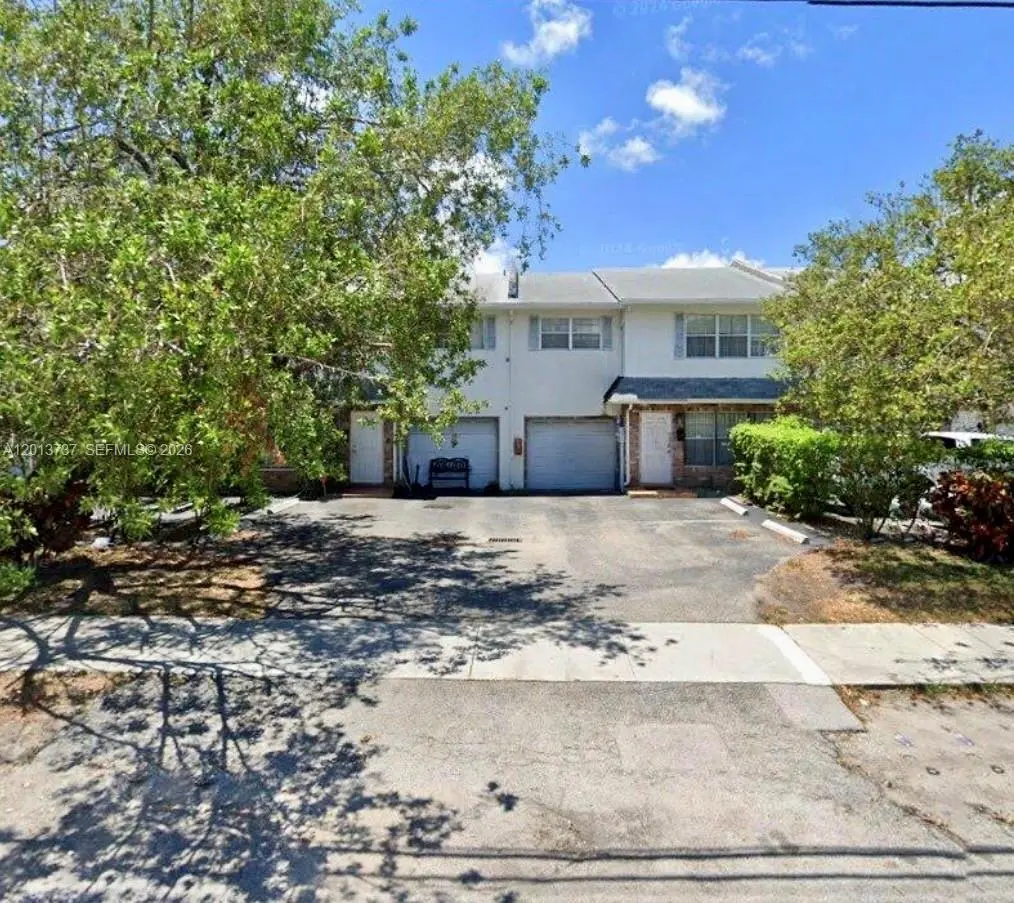
3965 NW 9th Ave #3 · Deerfield Beach, FL
Flood risk 3/10 · Minor
- FEMA flood zone
- AH
- Chance of flooding over 30 yrs
- 0.2%
- Est. flood insurance / yr
- $1,142 – $2,507
Fire risk 1/10 · Minimal
- Est. fire insurance / yr
- $947 – $1,759
Heat risk 9/10 · Severe
- Hot days now (above 107°F)
- 7 days/yr
- Hot days in 30 yrs
- 25 days/yr
Wind risk 10/10 · Severe
- Chance of severe wind over 30 yrs
- 99.0%
Air-quality risk 2/10 · Minimal
- Unhealthy air days now
- 1 days/yr
- Unhealthy air days in 30 yrs
- 3 days/yr
Risk factors via First Street. Map © Google.
Why this score? — see what drove the D grade
The composite is a weighted blend of 9 inputs, each scored 0–100. Each bar is that input's sub-score; the figure is the points it added to the 100-point composite (weight × sub-score).
- Cash flow +12.9/30.0
- ARV discount +7.5/15.0
- 1% rule +6.4/10.0
- Schools +4.1/10.0
- DSCR +3.9/10.0
- Livability +3.8/5.0
- Rent growth +2.9/5.0
- Condition / age +2.5/5.0
- Appreciation +0.0/10.0
$314,875
🖨 Deal sheet 📄 Offer letter ✓ Due diligence
Listing remarks
Seller offering credit towards closing costs! Welcome to this beautifully maintained home in Deerfield Beach, where comfort, style, and value come together. Featuring a generous, light-filled layout with an updated kitchen that flows into the dining area, perfect for everyday living and entertaining. The expansive family room and formal dining area offer space to gather for any occasion. Step outside to your private courtyard, a serene retreat ideal for relaxing or entertaining under the Florida sky. Upstairs, spacious bedrooms with generous closet space are complemented by two full bathrooms. Major updates include a roof approximately 5 years old, A/C only 2.5 years old, and updated bathro
Key facts
- Updated bathrooms
- Formal dining area
- Large open kitchen
Tags
Property features AI
Finance
- Financial info: Pets allowed with restrictions
- HOA & community: Monthly association fee of $600; HOA covers grounds and structure maintenance, trash, and water
Exterior
- Parking: 3-car garage; Garage door opener; Two or more parking spaces
- Utilities: Electric service with fuses
- Home design: 2 stories; Entry at level 1
- Construction: Block construction; Resale property
- Exterior features: Property attached (townhome/attached unit)
Interior
- Kitchen: Dishwasher; Electric range; Microwave; Disposal; Refrigerator
- Flooring: Carpet; Ceramic tile
- Bathrooms: 2 full bathrooms; 1 half bathroom
- Heating & cooling: Central heating (electric); Central air conditioning (electric); Ceiling fans
- Interior features: First-floor entry; Primary bedroom on upper level
- Laundry & utility: Washer hookup; Dryer hookup; Washer; Dryer; Electric water heater
Neighborhood map
What this means for you Summary
Snapshot
- This is a 4-bed/3.0-bath condo listed at $315k.
Deal economics
- At list price, monthly cash flow is $-175 ($-2k/yr) — negative.
- To cash-flow at today's rent, offer at most $284k (9.8% below list).
- Meets the 1% rule at list price ($4k rent vs $315k).
- Recommended offer: $284k (9.8% below list) — sets the bar for cash-flow.
- Cap rate 6.2% vs local median 4.2% in Deerfield Beach — top-decile yield for the area; either an underpriced asset or a hidden risk that comps aren't pricing in. Stress-test before assuming the spread holds.
Location & tenants
- Location reads 75/100 on livability (#250 in FL, #3,970 nationally) — a middle-class / working-renter tenant base. Strengths: housing A+, health & safety A+, cost of living A; Watch: schools D-, amenities D-, employment D-.
- Broward (suburban): math 42% / reading 53% proficiency, ranked #46 of 73 in FL (top 63%) — families likely to look elsewhere, expect single-tenant / working-renter base with shorter leases.
- Market conditions: Rents rising (+1.8%/yr); 591 active listings in the ZIP; 28 comparable units currently listed for rent nearby; rentals at typical pace (median 24d on market — plan ~3-4 weeks tenant-placement turnaround); 2,111 units permitted in Broward County in 2024 (1,265 in 5+ unit buildings).
- At $3,586/mo this rent would consume 60% of the median local household income ($71k/yr) (locally 2907% of renters already pay >50% of income on rent) — very limited rent-growth headroom before tenants either downsize or default.
Forward outlook
- Local home prices are declining (-3.0%/yr); year-one equity from $2k of loan paydown is wiped out by about $9k of value loss. Plan a longer hold.
- Broward County population projected at +34% by 2050 — long-run rental-demand tailwind backs the buy-and-hold thesis.
Negotiation context
- It's been on market 44 days — a 3% lower offer ($305k) is reasonable based on typical stale-listing flexibility.
- Current owner paid $175k; list at $315k implies a 80% gain — meaningful room to come down on a strong offer.
Risks & watch-outs
- Watch-outs: flood insurance adds $152/mo.
- Climate carrying-cost: in FEMA flood zone AH (mandatory federal flood insurance); severe wind risk, 99% chance of damaging wind over 30y; extreme-heat days projected 7→25/yr by 2055 (HVAC capex compounding) — expect insurance premiums to compound above CPI over the hold.
Questions for the listing agent
- What do current leases actually rent for vs. the listed asking? Can we see a recent rent roll and the last 12 months of T-12 income?
- It's been on market 44 days. Have you received any prior offers? Is the seller open to a 10% concession, seller financing, or rate buy-down credit?
- Built in 1978 — when were the roof, HVAC, electrical panel, plumbing, and water heater last replaced?
- What's the actual annual flood-insurance premium (NFIP or private), and is the property in a SFHA with mandatory coverage?
- What does the HOA fee cover, when was the last increase, and are there any pending special assessments or reserve-fund shortfalls?
- Any open or pending special assessments — roof, HVAC, plumbing, elevator, façade? What's the per-unit balance and payoff schedule, and is the seller paying it off at close or rolling it to the buyer?
- Is there a deadline driving the sale (1031 exchange, divorce, estate, relocation)? That informs how much negotiation room exists.
- Schools are D-rated, which usually means shorter tenancies and higher turnover. Who's the typical renter profile here, and what's been the actual vacancy rate?
- The area grade is low — what's the realistic commute time and amenity access for the typical tenant pool here? Any planned neighborhood developments (good or bad) we should know about?
- What's the average days-on-market for RENTAL listings here right now (not sales)? A rising rental-DOM trend means longer vacancies and softer asking-rent achievability than the comps imply.
- What's the recent tenant-quality profile in this submarket — average credit score on applications, eviction rate, late-payment / NSF rate, and stable-employment percentage? A property-management company in the area should have these aggregated.
- How much new apartment / multifamily construction is in the pipeline within 1–3 miles? Heavy new supply (>2% of stock underway) typically softens rents 12–24 months out; light construction supports rent growth.
Investment metrics
- 1% rule
- 1.14% ✓
- Cap rate
- 6.21%
- Cash-on-cash
- -0.31%
- DSCR
- 0.99
- GRM
- 7.3
CMA / ARV
No comps found within radius.
Projected returns pro-forma
-3.0% appreciation · 1.75% rent growth · sell at horizon
- IRR
- -22.0%
- Equity multiple
- 0.25×
- Total profit
- $-66,038
- Equity at exit
- $46,949
- IRR
- -20.2%
- Equity multiple
- 0.01×
- Total profit
- $-87,361
- Equity at exit
- $27,225
Cash invested: $88,165 (down + closing). Projections, not guarantees.
Landlord ↔ Tenant lean methodology
- Overall (STATE)
- 87 Strongly Landlord-Friendly
- State Florida
- 87 Strongly Landlord-Friendly · R+3
- County
- — inherits STATE
- City
- — inherits STATE
ZIP-level market 33064
- Home prices YoY
- -18.7%
- Rents YoY
- 1.8%
- Active inventory
- 591
- Price-to-rent
- 7.3×
Monthly cashflow live
- Estimated rent
- $3,586 high interval (Pro) →
- Mortgage (P&I)
- −$1,651
- Tax from tax record
- −$473 /mo · $5,682/yr
- Insurance
- −$131
- Flood insurance flood zone
- −$152 /mo · $1,824/yr
- HOA
- −$600
- Vacancy / Maint / Mgmt
- −$753
- Net cashflow
- $-175
Break-even live
UW: 25.0% down · 7.5% · 30yr · 1.5% tax · 5.0% vac · 8.0% maint · 8.0% mgmt
Financing live
Cash to close
- Down payment
- $78,719
- Closing costs
- $9,446
- Reserves months
- —
- Total cash needed
- —
Loan-product check · same deal, 3 products live
Conventional
25% down · 7.5% · 30yr
- Down + closing
- —
- Monthly P&I
- —
- Monthly cashflow
- —
- DSCR
- —
- Eligible?
- —
Personal DTI + credit; lowest rate.
DSCR
20% down · 8.5% · 30yr
- Down + closing
- —
- Monthly P&I
- —
- Monthly cashflow
- —
- DSCR
- —
- Eligible?
- —
No personal income docs; deal must DSCR.
Hard money
10% down · 12.0% · 12mo
- Down + closing
- —
- Monthly P&I
- —
- Monthly cashflow
- —
- DSCR
- —
- Eligible?
- —
Short-term bridge; refi at stabilization.
Rent comps 28 comps
| Address | Beds | Baths | Sqft | Rent | $/sqft | DOM | Units | Dist |
|---|---|---|---|---|---|---|---|---|
| 4053 Eastridge Dr Deerfield Beach, FL | 3.0 | 2.5 | 1478 | $3,300 | $2.23 | 24d | 1 | 0.06mi |
| 4329 Veleiros Ave Pompano Beach, FL | 3.0 | 2.5 | 1479 | $3,499 | $2.37 | 24d | 1 | 0.23mi |
| 4091 Pelicano Way Unit 4091 Lighthouse Point, FL | 4.0 | 2.5 | 2322 | $4,000 | $1.72 | 1d | 1 | 0.23mi |
| 1067 Rio Ct Unit 1067 Lighthouse Point, FL | 3.0 | 2.5 | 1622 | $3,800 | $2.34 | 24d | 1 | 0.24mi |
| 3990 Pelicano Way Pompano Beach, FL | 5.0 | 3.0 | 2622 | $5,200 | $1.98 | 14d | 1 | 0.24mi |
| 4317 Lago Dr Unit 4317 Lighthouse Point, FL | 3.0 | 2.5 | 1830 | $3,750 | $2.05 | 24d | 1 | 0.26mi |
| 4362 Veleiros Ave Pompano Beach, FL | 3.0 | 2.5 | 1628 | $3,700 | $2.27 | 24d | 1 | 0.29mi |
| 1221 NW 44th St Deerfield Beach, FL | 3.0 | 2.0 | 1624 | $3,100 | $1.91 | 7d | 1 | 0.41mi |
| 4161 Marina Way Pompano Beach, FL | 4.0 | 3.0 | 2179 | $5,500 | $2.52 | 24d | 1 | 0.41mi |
| 4120 NW 3rd Way Deerfield Beach, FL | 4.0 | 2.0 | 1401 | $3,600 | $2.57 | 17d | 1 | 0.47mi |
| 4305 Marina Way Unit 4305 Lighthouse Point, FL | 3.0 | 2.0 | 1590 | $3,400 | $2.14 | 24d | 1 | 0.53mi |
| 1087 NW 33rd Mnr Pompano Beach, FL | 3.0 | 2.5 | 1495 | $2,675 | $1.79 | 24d | 1 | 0.54mi |
| 3345 NW 11th Ave Unit 3345 Pompano Beach, FL | 3.0 | 2.5 | 1538 | $2,850 | $1.85 | 24d | 1 | 0.55mi |
| 3329 NW 11th Ave Unit 3329 Pompano Beach, FL | 3.0 | 2.5 | 1420 | $2,800 | $1.97 | 24d | 1 | 0.58mi |
| 220 NW 43rd St Deerfield Beach, FL | 3.0 | 2.0 | 1458 | $2,800 | $1.92 | 24d | 1 | 0.59mi |
| 1500 NW 45th St Deerfield Beach, FL | 3.0 | 2.0 | 2064 | $4,300 | $2.08 | 24d | 1 | 0.61mi |
| 220 NW 43rd Ct Deerfield Beach, FL | 3.0 | 2.0 | 1458 | $2,700 | $1.85 | 14d | 1 | 0.62mi |
| 3313 Quail Close #3313 Pompano Beach, FL | 3.0 | 2.5 | 1420 | $2,500 | $1.76 | 24d | 1 | 0.71mi |
| 1307 Partridge Close Pompano Beach, FL | 4.0 | 2.5 | 1500 | $2,500 | $1.67 | 7d | 1 | 0.72mi |
| 1307 Partridge Close #67 Pompano Beach, FL | 4.0 | 2.5 | 1500 | $2,500 | $1.67 | 13d | 1 | 0.72mi |
| 1280 NW 49th St Deerfield Beach, FL | 3.0 | 2.0 | 1575 | $2,700 | $1.71 | 24d | 1 | 0.81mi |
| 4030 NE 2nd Ter Deerfield Beach, FL | 3.0 | 2.0 | 1740 | $3,650 | $2.10 | 14d | 1 | 0.86mi |
| 4030 NE 2nd Ter Deerfield Beach, FL | 3.0 | 2.0 | 1740 | $3,650 | $2.10 | 11d | 1 | 0.86mi |
| 5161 NW 11th Ln Deerfield Beach, FL | 3.0 | 2.0 | 1486 | $2,925 | $1.97 | 24d | 1 | 1.00mi |
| 110 NE 30th St Pompano Beach, FL | 3.0 | 2.0 | 1418 | $4,400 | $3.10 | 24d | 1 | 1.21mi |
| 378 NE 47th Pl #378 Pompano Beach, FL | 3.0 | 2.5 | 1457 | $3,000 | $2.06 | 24d | 1 | 1.28mi |
| 1398 SW 24th Ter Deerfield Beach, FL | 3.0 | 2.0 | 1865 | $5,000 | $2.68 | 24d | 1 | 1.30mi |
| 1361 SW 26th Ave Deerfield Beach, FL | 3.0 | 2.0 | 1932 | $3,850 | $1.99 | 16d | 1 | 1.44mi |
HOA detail condo
- Monthly dues
- $600 · $7,200/yr
- Assessments
- None detected in remarks — confirm with the listing agent.
Listing history 19 events
-
2026-06-18days on market $314,875 Active 44 DOM
-
2026-06-17days on market $314,875 Active 43 DOM
-
2026-06-16days on market $314,875 Active 42 DOM
-
2026-06-15days on market $314,875 Active 41 DOM
-
2026-06-13days on market $314,875 Active 39 DOM
-
2026-06-09days on market $314,875 Active 35 DOM
-
2026-06-08days on market $314,875 Active 34 DOM
-
2026-06-07days on market $314,875 Active 33 DOM
-
2026-06-04days on market $314,875 Active 30 DOM
-
2026-06-03days on market $314,875 Active 29 DOM
-
2026-06-02days on market $314,875 Active 28 DOM
-
2026-06-01days on market $314,875 Active 27 DOM
-
2026-05-31days on market $314,875 Active 26 DOM
-
2026-05-22price $314,875
-
2026-05-05$317,000 Active
-
2017-12-11soldstatus $175,000
-
1987-02-19soldstatus $70,000
-
1986-12-01soldstatus $70,000
-
1978-12-01soldstatus $55,500
ⓘ Source: listings_history table (triggers on properties + properties_extension) + one-shot
backfill from property_details.listing_events for pre-trigger history.
Tax reassessment forecast FL · Resets to sale price
- Current annual tax
- $5,682 · $473/mo
- Projected year-2 tax
- $5,682 · $473/mo
- Expected delta
- $0/yr ($0/mo · 0.0%)
ⓘ Screening estimate from a state-policy table — verify with the county assessor before closing.
Climate risk First Street
- Flood 3/10 Moderate FEMA zone AH · 20% chance over 30 yrs
- Wildfire 1/10 Low
- Heat 9/10 Extreme 7 d/yr ≥107°F today · 25 d/yr by 30 yrs out
- Wind 10/10 Extreme 99% chance of damaging wind over 30 yrs
- Air quality 2/10 Low 1 unhealthy d/yr today · 3 by 30 yrs out
Nearby sold comps map
Loading sold comps map…
Walkable amenities ~0.75 mi
Loading nearby amenities…
Taxation est. · year 1
- Rental income
- $43,037
- − Mortgage interest
- −$17,638
- − Property taxes
- −$5,682
- − Insurance
- −$3,399
- − Repairs & maintenance
- −$3,443
- − Management
- −$3,443
- − HOA
- −$7,200
- − Depreciation
- −$9,160
- Taxable loss
- −$6,927
- Est. tax savings @ 24.0%
- +$1,663
- After-tax cash flow
- $-433/yr
For passive investors: Depreciation is non-cash, so a rental often shows a tax loss while cash-flowing — sheltering income. Rental losses are passive: they offset passive income freely, and up to $25,000/yr can offset ordinary (W-2) income if you actively participate and your MAGI is under $100k (phasing out to $0 by $150k); unused losses carry forward. On sale, claimed depreciation is recaptured at up to 25%, and gains may owe capital-gains tax (a 1031 exchange can defer both). Figures are a year-1 estimate at your 24.0% rate — not tax advice; consult a CPA.
Schools (NCES district)
- District
- Broward
- NCES district ID
- 1200180
- Math proficiency
- 42% ▼ -18.00%
- Reading proficiency
- 53% ▼ -5.00%
- Median HH income
- $52,139
- Composite
- 40.88/100
- National rank
- #3621
- State rank
- #46 of 73 in FL
Livability — Deerfield Beach
- Score
- 75/100
- State rank
- #250
- US rank
- #3970
Category grades
Schools grade is shown separately in the Schools card above.
Census & demographics
- Census place
- Deerfield Beach, FL
- County
- Broward County · 1,963,430 people
- City population
- 155,861
- Metro
- Miami-Fort Lauderdale-Pompano Beach, FL
- Population (ZIP)
- 64,563
- Household income
- $71,301
- Rent vs Own
- Severe rent burden
- 2907.0
Population outlook (Broward County) Hauer SSP2
- Today (2025)
- 2,207,033 people
- By 2030
- 2,360,704 · +7.0%
- By 2040
- 2,661,208 · +20.6%
- By 2050
- 2,946,698 · +33.5%
- By 2075
- 3,602,273 · +63.2%
- By 2100
- 3,970,984 · +79.9%
Race, ethnicity, and origin ACS 2023
- Neighborhood character
- Highly diverse neighborhood (Simpson 0.75)
- Race & ethnicity
- White 34% Hispanic / Latino 27% Black 25% Two or more races 24% Asian 2%
- Hispanic origin (detail)
- Mexican 4% Puerto Rican 4% Cuban 4% Dominican 2%
- Common ancestry
- Hispanic 13% Estonian 10% Romanian 1%
- Foreign-born
- 43% · Canada, Jamaica, Dominican Republic
- Languages at home
- 45% English-only · Spanish 23% French/Haitian/Cajun 16% Other Indo-European 13%
Political lean MEDSL · Broward
- 2024 margin
- D (+17.0) · D 58.0% · R 41.0%
- 2008→2024 swing
- -17.8pp toward R · 2008: 34.7pp · 2024: 17.0pp
- All cycles
- 2024: D+17.0 2020: D+29.8 2016: D+35.0 2012: D+34.9 2008: D+34.7
Not yet ingested
- Civics
- —
Market trends
- HPI YoY
- ▼ -109.09%
- Current HPI
- 474.7007
- Rent YoY
- ▲ 1.75%
- Metro
- Miami-Fort Lauderdale-Pompano Beach, FL
- State GDP YoY
- ▲ 3.28%
- F500 in state
- 36
Industry mix (Fortune 500 HQ in FL)
| Industry | F500 HQs | Revenue |
|---|---|---|
| Industrial Technology | 2 | $29B |
|
||
| Insurance | 2 | $17B |
|
||
| Retail | 1 | $60B |
|
||
| Technology Distribution | 1 | $58B |
|
||
| Homebuilding | 1 | $35B |
|
||
| Technology Manufacturing | 1 | $35B |
|
||
Price history
+467.3% since first listed6 events — show timeline
- 2026-05-22 Price Changed $314,875 MARMLS
- 2026-05-05 Listed $317,000 MARMLS
- 2017-12-11 Sold (Public Records) $175,000 Public Records
- 1987-02-19 Sold (Public Records) $70,000 Public Records
- 1986-12-01 Sold (Public Records) $70,000 Public Records
- 1978-12-01 Sold (Public Records) $55,500 Public Records
Property tax history
+15.2%/yrLatest (2025): $5,682 · +7.0% YoY. Source: county tax records.
Cash-flow waterfall
monthlySold comps — $/sqft
last 12 mo · ≤1 miLoading sold comps…