 Multi-family
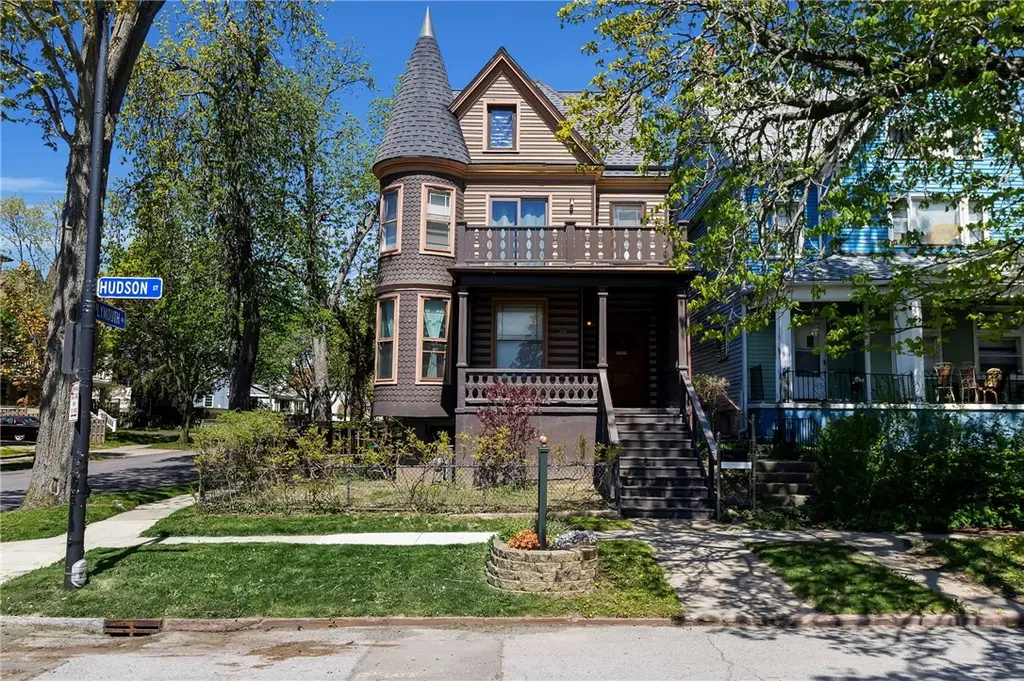
314 Hudson St · Buffalo, NY
Flood risk 1/10 · Minimal
- FEMA flood zone
- X (unshaded)
- Chance of flooding over 30 yrs
- 0.0%
- Est. flood insurance / yr
- $507 – $1,088
Fire risk 1/10 · Minimal
- Est. fire insurance / yr
- $691 – $1,283
Heat risk 3/10 · Minor
- Hot days now (above 91°F)
- 7 days/yr
- Hot days in 30 yrs
- 15 days/yr
Wind risk 1/10 · Minimal
- Chance of severe wind over 30 yrs
- —
Air-quality risk 4/10 · Minor
- Unhealthy air days now
- 4 days/yr
- Unhealthy air days in 30 yrs
- 9 days/yr
Risk factors via First Street. Map © Google.
Why this score? — see what drove the C+ grade
The composite is a weighted blend of 9 inputs, each scored 0–100. Each bar is that input's sub-score; the figure is the points it added to the 100-point composite (weight × sub-score).
- Cash flow +22.4/30.0
- ARV discount +15.0/15.0
- DSCR +7.2/10.0
- 1% rule +4.5/10.0
- Livability +3.9/5.0
- Rent growth +3.6/5.0
- Schools +3.3/10.0
- Condition / age +2.5/5.0
- Appreciation +0.0/10.0
$369,900
🖨 Deal sheet 📄 Offer letter ✓ Due diligence
Multi-family units
County records classify this as Multi-Family (2-4 Unit). Listing-text estimate: 1 unit. estimate disagrees with records
Listing remarks
LOCATED JUST OUTSIDE THE BUSTLE OF ALLENTOWN, THIS STRIKING DOUBLE WAS TOTALLY RENOVATED STARTING IN 2005. CONSEQUENTLY, THE PROPERTY HAS ALL FULLY UPDATED MECHANICAL SYSTEMS. THE FIRST FLOOR APARTMENT IS ACCESSED BY PRIVATE ENTRANCE, BUT CAN ALSO BE OPENED UP TO THE FRONT HALL IF AN OWNER EVER WANTED TO USE THE WHOLE HOUSE. THE APARTMENT IS GENEROUSLY SIZED WITH AN EAT-IN KITHEN, FORMAL DINING ROOM AND LIVING ROOM. THE UPPER UNIT HAS BEEN COMPLETELY RECONFIGURED INTO OPEN PLAN LIVING WITH A SECOND FLOOR PORCH LOOKING OVER THE TREES TO DOWNTOWN. THE SECOND FLOOR APARTMENT HAS THE ONLY ACCESS TO THE THIRD FLOOR WHICH IS INCLUDED IN CITY RECORDS, AND THE SQUARE FOOTAGE OF THE ATTIC IS INCLUDE
Key facts
- Totally renovated
- Open plan living
- Private entrance
Tags
Property features AI
Finance
- Other: Property has two separate electric meters and two separate gas meters; Two total units
- Financial info: Gross rental income listed at $9,600; One unit currently reporting $800 monthly rent; Operating expenses listed at $1,090 (includes trash and water/sewer); Owner pays trash collection and water; rent includes trash collection and water
Exterior
- Parking: Concrete parking; One parking space
- Utilities: Public water connected; Sewer connected; Electric service with circuit breakers
- Home design: Two-story multi-family property; Resale condition
- Construction: Frame construction with wood siding; Foam insulation; Copper and PEX plumbing; Architectural shingle roof; Stone foundation; Built (existing)
- Exterior features: Fully fenced yard; Covered and open porch areas; Porch
Interior
- Kitchen: Each unit includes a range/oven, refrigerator, and dishwasher; One unit has an eat-in kitchen; the other features a dining area combined with the living room
- Bedrooms: Two 1-bedroom units (each unit located on its respective level)
- Flooring: Ceramic tile; Hardwood; Varies by area
- Bathrooms: Two full bathrooms (one in each unit)
- Heating & cooling: Gas forced-air heating
- Interior features: Full basement; Ceramic tile and hardwood flooring; varying floor materials throughout; Gas water heater
- Laundry & utility: Washer and dryer included in each unit
Neighborhood map
What this means for you Summary
Snapshot
- This is a 6-bed/2.0-bath multifamily listed at $370k.
Deal economics
- At list price, monthly cash flow is $615 ($7k/yr) — positive.
- The deal already cash-flows at list — no discount required.
- To meet the 1% rule (rent ≥ 1% of price), the offer needs to be $352k (4.7% below list).
- Recommended offer: $352k (4.7% below list) — sets the bar for 1% rule.
Location & tenants
- Location reads 77/100 on livability (#195 in NY, #3,011 nationally) — a middle-class / working-renter tenant base. Strengths: commute A+, housing A+, health & safety A+; Watch: crime F, employment D-.
- Buffalo City School District (urban): math 41% / reading 40% proficiency, ranked #535 of 590 in NY (top 91%) — families likely to look elsewhere, expect single-tenant / working-renter base with shorter leases; 75% free/reduced lunch — lower-income household profile, screen leases tightly.
- Market conditions: Rents rising fast (+4.3%/yr); 56 active listings in the ZIP; lower-income renter base — watch delinquency; 1,244 units permitted in Erie County in 2024 (563 in 5+ unit buildings).
- At $3,524/mo this rent would consume 104% of the median local household income ($41k/yr) (locally 1213% of renters already pay >50% of income on rent) — very limited rent-growth headroom before tenants either downsize or default.
Forward outlook
- Local home prices are declining (-3.0%/yr); year-one equity from $3k of loan paydown is wiped out by about $11k of value loss. Plan a longer hold.
Negotiation context
- It's been on market 16 days — a 2% lower offer ($364k) is reasonable based on typical stale-listing flexibility.
- Current owner paid $36k; list at $370k implies a 925% gain — meaningful room to come down on a strong offer.
Risks & watch-outs
- Watch-outs: built in 1870 — expect roof / HVAC / electrical / plumbing capex.
Questions for the listing agent
- Built in 1870 — when were the roof, HVAC, electrical panel, plumbing, and water heater last replaced?
- Is there a deadline driving the sale (1031 exchange, divorce, estate, relocation)? That informs how much negotiation room exists.
- Crime grade is F in this area — have there been break-ins, vandalism, or insurance claims at this property in the last 3 years? What carrier currently insures it and at what premium?
- What's the average days-on-market for RENTAL listings here right now (not sales)? A rising rental-DOM trend means longer vacancies and softer asking-rent achievability than the comps imply.
- What's the recent tenant-quality profile in this submarket — average credit score on applications, eviction rate, late-payment / NSF rate, and stable-employment percentage? A property-management company in the area should have these aggregated.
- How much new apartment / multifamily construction is in the pipeline within 1–3 miles? Heavy new supply (>2% of stock underway) typically softens rents 12–24 months out; light construction supports rent growth.
Investment metrics
- 1% rule
- 0.95% ✗
- Cap rate
- 8.29%
- Cash-on-cash
- 7.13%
- DSCR
- 1.32
- GRM
- 8.7
CMA / ARV
- ARV (median comp)
- $493,269
- List price
- $369,900
- Delta
- -25.01%
- Verdict
- UNDERPRICED
- Comps
- 20 within 1.0 mi
Show comp detail 12 sales within ~0.75 mi
| Address | Dist | Beds/Ba | Sqft | Sold | Price | $/sf | Match |
|---|---|---|---|---|---|---|---|
| 258 Hudson St | 0.11mi | 6/2.0 | 3,359 (+8%) | 1mo | $150,000 | $45 | 80 |
| 58 Mariner St | 0.25mi | 6/2.0 | 3,017 (-3%) | 10mo | $314,150 | $104 | 75 |
| 286 Hudson St | 0.06mi | 6/2.0 | 2,860 (-8%) | 16mo | $307,000 | $107 | 71 |
| 108 Plymouth Ave | 0.20mi | 5/2.0 (-1) | 3,240 (+4%) | 10mo | $280,000 | $86 | 70 |
| 348 Virginia St | 0.27mi | 6/4.0 | 2,882 (-7%) | 2mo | $328,000 | $114 | 66 |
| 324 West Ave | 0.24mi | 6/2.0 | 2,652 (-15%) | 5mo | $312,500 | $118 | 60 |
| 422 Busti Ave | 0.46mi | 6/3.0 | 3,020 (-3%) | 21mo | $335,000 | $111 | 53 |
| 300 Busti Ave | 0.48mi | 6/3.0 | 2,816 (-9%) | 18mo | $88,000 | $31 | 43 |
| 157 Park St | 0.40mi | 5/3.0 (-1) | 2,644 (-15%) | 11mo | $661,000 | $250 | 38 |
| 304 14th St | 0.72mi | 6/2.0 | 2,854 (-8%) | 21mo | $107,000 | $37 | 35 |
| 574 West Ave | 0.72mi | 7/3.0 (+1) | 3,360 (+8%) | 11mo | $425,000 | $126 | 34 |
| 49 Trinity Pl | 0.40mi | 5/2.0 (-1) | 2,648 (-15%) | 24mo | $239,000 | $90 | 32 |
Match score weights: distance 35% · size 25% · config 20% · recency 20%. Top-matched comps best support the ARV.
Projected returns pro-forma
-3.0% appreciation · 4.28% rent growth · sell at horizon
- IRR
- -4.2%
- Equity multiple
- 0.84×
- Total profit
- $-16,347
- Equity at exit
- $55,153
- IRR
- 6.7%
- Equity multiple
- 1.53×
- Total profit
- $54,826
- Equity at exit
- $31,982
Cash invested: $103,572 (down + closing). Projections, not guarantees.
Landlord ↔ Tenant lean methodology
- Overall (STATE)
- 15 Strongly Tenant-Friendly
- State New York
- 15 Strongly Tenant-Friendly · D+10
- County
- — inherits STATE
- City
- — inherits STATE
ZIP-level market 14201
- Home prices YoY
- -19.1%
- Rents YoY
- 4.3%
- Active inventory
- 56
- Price-to-rent
- 17.5×
Monthly cashflow live
- Estimated rent
- $3,524 high interval (Pro) →
- Mortgage (P&I)
- −$1,940
- Tax from tax record
- −$75 /mo · $898/yr
- Insurance
- −$154
- HOA
- −$0
- Vacancy / Maint / Mgmt
- −$740
- Net cashflow
- $615
Break-even live
2-unit breakdown (identical units grouped — click to expand)
| Units | Beds | Baths | Est. rent |
|---|---|---|---|
| 2× units | 2 | 1 | $3,524 |
| #1 | 2 | 1 | $1,762 |
| #2 | 2 | 1 | $1,762 |
| Total (2 units) | $3,524 | ||
UW: 25.0% down · 7.5% · 30yr · 1.5% tax · 5.0% vac · 8.0% maint · 8.0% mgmt
Financing live
Cash to close
- Down payment
- $92,475
- Closing costs
- $11,097
- Reserves months
- —
- Total cash needed
- —
Loan-product check · same deal, 3 products live
Conventional
25% down · 7.5% · 30yr
- Down + closing
- —
- Monthly P&I
- —
- Monthly cashflow
- —
- DSCR
- —
- Eligible?
- —
Personal DTI + credit; lowest rate.
DSCR
20% down · 8.5% · 30yr
- Down + closing
- —
- Monthly P&I
- —
- Monthly cashflow
- —
- DSCR
- —
- Eligible?
- —
No personal income docs; deal must DSCR.
Hard money
10% down · 12.0% · 12mo
- Down + closing
- —
- Monthly P&I
- —
- Monthly cashflow
- —
- DSCR
- —
- Eligible?
- —
Short-term bridge; refi at stabilization.
Listing history 4 events
-
2026-06-01status $369,900 Pending 16 DOM
-
2026-05-31days on market $369,900 Active 16 DOM
-
2026-05-14$369,900 Active 912-char remark
-
2005-03-15soldstatus $36,100
ⓘ Source: listings_history table (triggers on properties + properties_extension) + one-shot
backfill from property_details.listing_events for pre-trigger history.
Tax reassessment forecast NY · Partial reset (capped growth)
- Current annual tax
- $898 · $75/mo
- Projected year-2 tax
- $3,575 · $298/mo
- Expected delta
- +$2,677/yr (+$223/mo · 298.0%)
ⓘ Screening estimate from a state-policy table — verify with the county assessor before closing.
Climate risk First Street
- Flood 1/10 Low FEMA zone X (unshaded) · 0% chance over 30 yrs
- Wildfire 1/10 Low
- Heat 3/10 Moderate 7 d/yr ≥91°F today · 15 d/yr by 30 yrs out
- Wind 1/10 Low
- Air quality 4/10 Moderate 4 unhealthy d/yr today · 9 by 30 yrs out
Nearby sold comps map
Loading sold comps map…
Walkable amenities ~0.75 mi
Loading nearby amenities…
Taxation est. · year 1
- Rental income
- $42,288
- − Mortgage interest
- −$20,720
- − Property taxes
- −$898
- − Insurance
- −$1,850
- − Repairs & maintenance
- −$3,383
- − Management
- −$3,383
- − Depreciation
- −$10,761
- Taxable income
- $1,293
- Est. tax owed @ 24.0%
- −$310
- After-tax cash flow
- $7,072/yr
For passive investors: Depreciation is non-cash, so a rental often shows a tax loss while cash-flowing — sheltering income. Rental losses are passive: they offset passive income freely, and up to $25,000/yr can offset ordinary (W-2) income if you actively participate and your MAGI is under $100k (phasing out to $0 by $150k); unused losses carry forward. On sale, claimed depreciation is recaptured at up to 25%, and gains may owe capital-gains tax (a 1031 exchange can defer both). Figures are a year-1 estimate at your 24.0% rate — not tax advice; consult a CPA.
Schools (NCES district)
- District
- Buffalo City School District
- NCES district ID
- 3605850
- Math proficiency
- 41% ▲ 11.00%
- Reading proficiency
- 40% ▲ 7.00%
- Median HH income
- $31,665
- Composite
- 33.17/100
- National rank
- #5544
- State rank
- #535 of 590 in NY
Livability — Buffalo
- Score
- 77/100
- State rank
- #195
- US rank
- #3011
Category grades
Schools grade is shown separately in the Schools card above.
Census & demographics
- Census place
- Buffalo, NY
- County
- Erie County · 714,559 people
- City population
- 440,021
- Metro
- Buffalo-Cheektowaga, NY
- Population (ZIP)
- 12,369
- Household income
- $40,512
- Rent vs Own
- Severe rent burden
- 1213.0
Population outlook (Erie County) Hauer SSP2
- Today (2025)
- 933,037 people
- By 2030
- 935,181 · +0.2%
- By 2040
- 928,531 · -0.5%
- By 2050
- 905,725 · -2.9%
- By 2075
- 834,037 · -10.6%
- By 2100
- 708,033 · -24.1%
Race, ethnicity, and origin ACS 2023
- Neighborhood character
- Diverse neighborhood (Simpson 0.66)
- Race & ethnicity
- White 42% Hispanic / Latino 36% Black 16% Two or more races 12% Asian 2% Native American 1%
- Hispanic origin (detail)
- Mexican 4% Puerto Rican 30% Dominican 1%
- Common ancestry
- Romanian 7% Subsaharan African 2% Slovak 1%
- Foreign-born
- 8% · Canada, China
- Languages at home
- 69% English-only · Spanish 24% Arabic 2% Other Indo-European 1%
Political lean MEDSL · Erie
- 2024 margin
- Lean D (+9.7) · D 54.8% · R 45.2%
- 2008→2024 swing
- -7.9pp toward R · 2008: 17.5pp · 2024: 9.7pp
- All cycles
- 2024: D+9.7 2020: D+14.7 2016: D+4.8 2012: D+15.6 2008: D+17.5
Not yet ingested
- Civics
- —
Market trends
- HPI YoY
- ▼ -68.73%
- Current HPI
- 290.2643
- Rent YoY
- ▲ 4.28%
- Metro
- Buffalo-Cheektowaga, NY
- State GDP YoY
- ▲ 2.60%
- F500 in state
- 92
Industry mix (Fortune 500 HQ in NY)
| Industry | F500 HQs | Revenue |
|---|---|---|
| Financial Services | 10 | $950B |
|
||
| Consumer Goods | 9 | $162B |
|
||
| Insurance | 4 | $225B |
|
||
| Telecommunications | 2 | $144B |
|
||
| Pharmaceuticals | 2 | $112B |
|
||
| Media / Entertainment | 2 | $69B |
|
||
Price history
+924.7% since first listed3 events — show timeline
- 2026-05-31 Pending — UNYREIS
- 2026-05-14 Listed $369,900 UNYREIS
- 2005-03-15 Sold (Public Records) $36,100 Public Records
Property tax history
+12.4%/yrLatest (2025): $898 · -15.2% YoY. Source: county tax records.
Cash-flow waterfall
monthlySold comps — $/sqft
last 12 mo · ≤1 miLoading sold comps…