 Multi-family
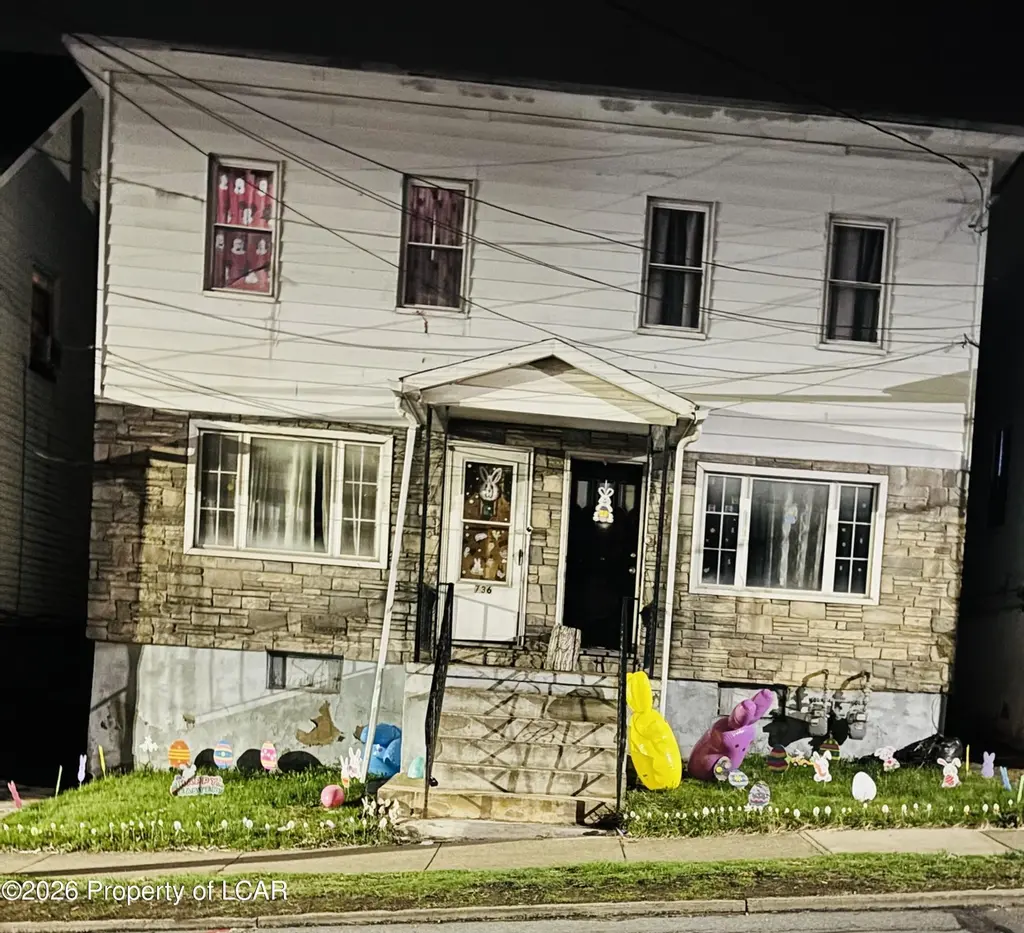
736 738 Main St · Edwardsville, PA
Flood risk 1/10 · Minimal
- FEMA flood zone
- X (unshaded)
- Chance of flooding over 30 yrs
- 0.0%
- Est. flood insurance / yr
- $507 – $1,088
Fire risk 1/10 · Minimal
- Est. fire insurance / yr
- $511 – $949
Heat risk 4/10 · Minor
- Hot days now (above 97°F)
- 7 days/yr
- Hot days in 30 yrs
- 16 days/yr
Wind risk 3/10 · Minor
- Chance of severe wind over 30 yrs
- 5.0%
Air-quality risk 3/10 · Minor
- Unhealthy air days now
- 2 days/yr
- Unhealthy air days in 30 yrs
- 4 days/yr
Risk factors via First Street. Map © Google.
Why this score? — see what drove the D- grade
The composite is a weighted blend of 9 inputs, each scored 0–100. Each bar is that input's sub-score; the figure is the points it added to the 100-point composite (weight × sub-score).
- Cash flow +14.9/30.0
- DSCR +4.5/10.0
- 1% rule +4.2/10.0
- Livability +3.8/5.0
- Rent growth +3.7/5.0
- ARV discount +3.0/15.0
- Schools +2.5/10.0
- Condition / age +2.5/5.0
- Appreciation +0.0/10.0
$185,000
🖨 Deal sheet 📄 Offer letter ✓ Due diligence
Multi-family units
County records classify this as Multi-Family (2-4 Unit). Listing-text estimate: 1 unit. estimate disagrees with records
Listing remarks MLS
Sat and Sun 12pm to 2pm only24-hour notice to schedule. Great investment property or a perfect starter home. Agent related to sellerSold as-is
Key facts
- Listed 87 days
Neighborhood map
What this means for you Summary
Snapshot
- This is a 4-bed/2.0-bath multifamily listed at $185k.
Deal economics
- At list price, monthly cash flow is $53 ($636/yr) — positive.
- The deal already cash-flows at list — no discount required.
- To meet the 1% rule (rent ≥ 1% of price), the offer needs to be $170k (8.0% below list).
- Recommended offer: $170k (8.0% below list) — sets the bar for 1% rule.
Location & tenants
- Location reads 75/100 on livability (#458 in PA, #4,179 nationally) — a middle-class / working-renter tenant base. Strengths: cost of living A+, housing A+, health & safety A+; Watch: schools D-, commute F, employment F.
- Wyoming Valley West SD (suburban): math 18% / reading 42% proficiency, ranked #445 of 539 in PA (top 83%) — families likely to look elsewhere, expect single-tenant / working-renter base with shorter leases.
- Market conditions: Rents rising fast (+4.7%/yr); 132 active listings in the ZIP; 10 comparable units currently listed for rent nearby; rentals at typical pace (median 21d on market — plan ~3-4 weeks tenant-placement turnaround); 349 units permitted in Luzerne County in 2024 (16 in 5+ unit buildings).
- This rent runs 32% of the median local income ($64k/yr) — at the standard rent-burdened threshold; future hikes will face affordability resistance.
Forward outlook
- Local home prices are declining (-3.0%/yr); year-one equity from $1k of loan paydown is wiped out by about $6k of value loss. Plan a longer hold.
- Luzerne County population projected at +4% by 2050 — modest demand growth; plan on rents tracking national, not racing it.
Negotiation context
- It's been on market 87 days — a 6% lower offer ($174k) is reasonable based on typical stale-listing flexibility.
- 2 sale attempts with the ask held roughly flat each time — persistent listings suggest the price (not the market) is what's stuck; bring a comps-based counter.
Risks & watch-outs
- Watch-outs: built in 1900 — expect roof / HVAC / electrical / plumbing capex.
Questions for the listing agent
- It's been on market 87 days. Have you received any prior offers? Is the seller open to a 8% concession, seller financing, or rate buy-down credit?
- Built in 1900 — when were the roof, HVAC, electrical panel, plumbing, and water heater last replaced?
- Why hasn't it sold? Are there any deal-killer items the seller is aware of (foundation, flood, title, zoning, code violations)?
- Is there a deadline driving the sale (1031 exchange, divorce, estate, relocation)? That informs how much negotiation room exists.
- Schools are D-rated, which usually means shorter tenancies and higher turnover. Who's the typical renter profile here, and what's been the actual vacancy rate?
- The area grade is low — what's the realistic commute time and amenity access for the typical tenant pool here? Any planned neighborhood developments (good or bad) we should know about?
- What's the average days-on-market for RENTAL listings here right now (not sales)? A rising rental-DOM trend means longer vacancies and softer asking-rent achievability than the comps imply.
- What's the recent tenant-quality profile in this submarket — average credit score on applications, eviction rate, late-payment / NSF rate, and stable-employment percentage? A property-management company in the area should have these aggregated.
- How much new apartment / multifamily construction is in the pipeline within 1–3 miles? Heavy new supply (>2% of stock underway) typically softens rents 12–24 months out; light construction supports rent growth.
Investment metrics
- 1% rule
- 0.92% ✗
- Cap rate
- 6.64%
- Cash-on-cash
- 1.23%
- DSCR
- 1.05
- GRM
- 9.1
CMA / ARV
- ARV (median comp)
- $168,336
- List price
- $185,000
- Delta
- 9.90%
- Verdict
- FAIR
- Comps
- 20 within 1.0 mi
Show comp detail 11 sales within ~0.75 mi
| Address | Dist | Beds/Ba | Sqft | Sold | Price | $/sf | Match |
|---|---|---|---|---|---|---|---|
| 45 47 Grove St | 0.09mi | 4/2.0 | 2,100 (-1%) | 18mo | $120,000 | $57 | 79 |
| 5-7 Williams St | 0.10mi | 4/2.0 | 2,050 (-3%) | 15mo | $80,000 | $39 | 78 |
| 54-56 Church St | 0.16mi | 4/2.0 | 2,422 (+14%) | 8mo | $101,000 | $42 | 63 |
| 314-316 Roosevelt St | 0.26mi | 4/2.0 | 2,380 (+12%) | 6mo | $275,000 | $116 | 62 |
| 10-12 Cook St | 0.28mi | 5/3.0 (+1) | 2,116 (-0%) | 21mo | $185,000 | $87 | 60 |
| 56-58 Payne Ave | 0.44mi | 4/2.0 | 1,864 (-12%) | 1mo | $215,000 | $115 | 59 |
| 223 225 Green St | 0.40mi | 4/2.0 | 2,400 (+13%) | 5mo | $186,000 | $78 | 55 |
| 9 Atlantic Ave | 0.36mi | 5/2.0 (+1) | 1,990 (-6%) | 22mo | $191,000 | $96 | 50 |
| 26 28 Grove St | 0.71mi | 4/2.0 | 2,100 (-1%) | 21mo | $180,000 | $86 | 48 |
| 149 Jackson St | 0.25mi | 5/3.0 (+1) | 1,903 (-10%) | 18mo | $245,000 | $129 | 47 |
| 54 56 Hillside Ave | 0.33mi | 5/4.0 (+1) | 2,400 (+13%) | 6mo | $255,000 | $106 | 45 |
Match score weights: distance 35% · size 25% · config 20% · recency 20%. Top-matched comps best support the ARV.
Projected returns pro-forma
-3.0% appreciation · 4.65% rent growth · sell at horizon
- IRR
- -12.5%
- Equity multiple
- 0.54×
- Total profit
- $-23,693
- Equity at exit
- $27,584
- IRR
- -1.0%
- Equity multiple
- 0.92×
- Total profit
- $-3,951
- Equity at exit
- $15,995
Cash invested: $51,800 (down + closing). Projections, not guarantees.
Landlord ↔ Tenant lean methodology
- Overall (STATE)
- 62 Landlord-Friendly
- State Pennsylvania
- 62 Landlord-Friendly · EVEN
- County
- — inherits STATE
- City
- — inherits STATE
ZIP-level market 18704
- Rents YoY
- 4.7%
- Active inventory
- 132
- Price-to-rent
- 9.1×
Monthly cashflow live
- Estimated rent
- $1,703 high interval (Pro) →
- Mortgage (P&I)
- −$970
- Tax from tax record
- −$245 /mo · $2,937/yr
- Insurance
- −$77
- HOA
- −$0
- Vacancy / Maint / Mgmt
- −$358
- Net cashflow
- $53
Break-even live
UW: 25.0% down · 7.5% · 30yr · 1.5% tax · 5.0% vac · 8.0% maint · 8.0% mgmt
Financing live
Cash to close
- Down payment
- $46,250
- Closing costs
- $5,550
- Reserves months
- —
- Total cash needed
- —
Loan-product check · same deal, 3 products live
Conventional
25% down · 7.5% · 30yr
- Down + closing
- —
- Monthly P&I
- —
- Monthly cashflow
- —
- DSCR
- —
- Eligible?
- —
Personal DTI + credit; lowest rate.
DSCR
20% down · 8.5% · 30yr
- Down + closing
- —
- Monthly P&I
- —
- Monthly cashflow
- —
- DSCR
- —
- Eligible?
- —
No personal income docs; deal must DSCR.
Hard money
10% down · 12.0% · 12mo
- Down + closing
- —
- Monthly P&I
- —
- Monthly cashflow
- —
- DSCR
- —
- Eligible?
- —
Short-term bridge; refi at stabilization.
Rent comps 10 comps
| Address | Beds | Baths | Sqft | Rent | $/sqft | DOM | Units | Dist |
|---|---|---|---|---|---|---|---|---|
| 56 E Grove St Kingston, PA | 3.0 | 2.0 | 2296 | $1,250 | $0.54 | 21d | 1 | 0.10mi |
| 58 Jackson St Kingston, PA | 4.0 | 2.0 | 1600 | $2,000 | $1.25 | 43d | 1 | 0.13mi |
| 36 Pulaski St Kingston, PA | 3.0 | 2.0 | 1432 | $1,600 | $1.12 | 13d | 1 | 0.42mi |
| 79 Washington St Kingston, PA | 4.0 | 1.5 | 1800 | $1,750 | $0.97 | 13d | 1 | 0.44mi |
| 255 Zerby Ave Kingston, PA | 3.0 | 1.0 | 2380 | $1,350 | $0.57 | 21d | 1 | 0.54mi |
| 365 N Maple Ave Kingston, PA | 3.0 | 1.0 | 1600 | $1,400 | $0.88 | 21d | 1 | 0.84mi |
| 143 W Dorrance St Kingston, PA | 5.0 | 1.5 | 2200 | $2,500 | $1.14 | 21d | 1 | 1.07mi |
| 147 W Dorrance St Kingston, PA | 3.0 | 1.5 | 2000 | $1,900 | $0.95 | 21d | 1 | 1.07mi |
| 54 Butler St Kingston, PA | 4.0 | 2.5 | 2174 | $2,000 | $0.92 | 43d | 1 | 1.12mi |
| 20 N Loveland Ave Kingston, PA | 3.0 | 2.0 | 1400 | $1,775 | $1.27 | 13d | 1 | 1.12mi |
Listing history 21 events
-
2026-06-18days on market $185,000 Active 87 DOM
-
2026-06-17days on market $185,000 Active 86 DOM
-
2026-06-16days on market $185,000 Active 85 DOM
-
2026-06-15days on market $185,000 Active 84 DOM
-
2026-06-14days on market $185,000 Active 82 DOM
-
2026-06-13days on market $185,000 Active 81 DOM
-
2026-06-10days on market $185,000 Active 79 DOM
-
2026-06-09days on market $185,000 Active 78 DOM
-
2026-06-08days on market $185,000 Active 77 DOM
-
2026-06-07days on market $185,000 Active 76 DOM
-
2026-06-05days on market $185,000 Active 73 DOM
-
2026-06-02days on market $185,000 Active 71 DOM
-
2026-06-01days on market $185,000 Active 70 DOM
-
2026-05-31days on market $185,000 Active 69 DOM
-
2026-05-30days on market $185,000 Active 68 DOM
-
2026-05-17price $185,000 142-char remark
Show marketing remark (142 chars)
Sat and Sun 12pm to 2pm only24-hour notice to schedule. Great investment property or a perfect starter home. Agent related to sellerSold as-is
-
2026-05-08status Active 142-char remark
Show marketing remark (142 chars)
Sat and Sun 12pm to 2pm only24-hour notice to schedule. Great investment property or a perfect starter home. Agent related to sellerSold as-is
-
2026-04-27status Pending 142-char remark
Show marketing remark (142 chars)
Sat and Sun 12pm to 2pm only24-hour notice to schedule. Great investment property or a perfect starter home. Agent related to sellerSold as-is
-
2026-03-12$190,000 Active 142-char remark
Show marketing remark (142 chars)
Sat and Sun 12pm to 2pm only24-hour notice to schedule. Great investment property or a perfect starter home. Agent related to sellerSold as-is
-
2025-05-29soldstatus $208,000
-
2022-04-12soldstatus $160,000
ⓘ Source: listings_history table (triggers on properties + properties_extension) + one-shot
backfill from property_details.listing_events for pre-trigger history.
Tax reassessment forecast PA · Partial reset (capped growth)
- Current annual tax
- $2,937 · $245/mo
- Projected year-2 tax
- $2,937 · $245/mo
- Expected delta
- $0/yr ($0/mo · 0.0%)
ⓘ Screening estimate from a state-policy table — verify with the county assessor before closing.
Climate risk First Street
- Flood 1/10 Low FEMA zone X (unshaded) · 0% chance over 30 yrs
- Wildfire 1/10 Low
- Heat 4/10 Moderate 7 d/yr ≥97°F today · 16 d/yr by 30 yrs out
- Wind 3/10 Moderate 5% chance of damaging wind over 30 yrs
- Air quality 3/10 Moderate 2 unhealthy d/yr today · 4 by 30 yrs out
Nearby sold comps map
Loading sold comps map…
Walkable amenities ~0.75 mi
Loading nearby amenities…
Taxation est. · year 1
- Rental income
- $20,430
- − Mortgage interest
- −$10,363
- − Property taxes
- −$2,937
- − Insurance
- −$925
- − Repairs & maintenance
- −$1,634
- − Management
- −$1,634
- − Depreciation
- −$5,382
- Taxable loss
- −$2,445
- Est. tax savings @ 24.0%
- +$587
- After-tax cash flow
- $1,223/yr
For passive investors: Depreciation is non-cash, so a rental often shows a tax loss while cash-flowing — sheltering income. Rental losses are passive: they offset passive income freely, and up to $25,000/yr can offset ordinary (W-2) income if you actively participate and your MAGI is under $100k (phasing out to $0 by $150k); unused losses carry forward. On sale, claimed depreciation is recaptured at up to 25%, and gains may owe capital-gains tax (a 1031 exchange can defer both). Figures are a year-1 estimate at your 24.0% rate — not tax advice; consult a CPA.
Schools (NCES district)
- District
- Wyoming Valley West SD
- NCES district ID
- 4225950
- Math proficiency
- 18% ▼ -11.00%
- Reading proficiency
- 42% ▼ -12.00%
- Median HH income
- $42,437
- Composite
- 25.38/100
- National rank
- #7470
- State rank
- #445 of 539 in PA
Livability — Edwardsville
- Score
- 75/100
- State rank
- #458
- US rank
- #4179
Category grades
Schools grade is shown separately in the Schools card above.
Census & demographics
- Census place
- Edwardsville, PA
- County
- Luzerne County · 118,885 people
- Metro
- Scranton--Wilkes-Barre, PA
- Population (ZIP)
- 31,149
- Household income
- $64,444
- Rent vs Own
- Severe rent burden
- 1454.0
Population outlook (Luzerne County) Hauer SSP2
- Today (2025)
- 319,505 people
- By 2030
- 319,943 · +0.1%
- By 2040
- 322,643 · +1.0%
- By 2050
- 330,817 · +3.5%
- By 2075
- 379,145 · +18.7%
- By 2100
- 431,908 · +35.2%
Race, ethnicity, and origin ACS 2023
- Neighborhood character
- Predominantly White (82%)
- Race & ethnicity
- White 82% Hispanic / Latino 8% Black 6% Two or more races 6%
- Hispanic origin (detail)
- Mexican 1% Puerto Rican 4% Dominican 1%
- Common ancestry
- Romanian 18% Scotch-Irish 4% Italian 2%
- Foreign-born
- 3% · Canada
- Languages at home
- 93% English-only · Spanish 4% Russian/Polish/Slavic 1%
Political lean MEDSL · Luzerne
- 2024 margin
- R (+19.2) · D 40.0% · R 59.2%
- 2008→2024 swing
- -27.6pp toward R · 2008: 8.4pp · 2024: -19.2pp
- All cycles
- 2024: R+19.2 2020: R+14.4 2016: R+19.6 2012: D+4.8 2008: D+8.4
Not yet ingested
- Civics
- —
Market trends
- HPI YoY
- ▼ -154.72%
- Current HPI
- 255.5375
- Rent YoY
- ▲ 4.65%
- Metro
- Scranton--Wilkes-Barre, PA
- State GDP YoY
- ▲ 1.68%
- F500 in state
- 34
Industry mix (Fortune 500 HQ in PA)
| Industry | F500 HQs | Revenue |
|---|---|---|
| Healthcare | 2 | $309B |
|
||
| Insurance | 2 | $27B |
|
||
| Telecommunications / Media | 1 | $124B |
|
||
| Industrial Distribution | 1 | $22B |
|
||
| Financial Services | 1 | $20B |
|
||
| Chemicals / Materials | 1 | $18B |
|
||
Price history
+15.6% since first listed6 events — show timeline
- 2026-05-17 Price Changed $185,000 LCAR
- 2026-05-08 Relisted — LCAR
- 2026-04-27 Pending — LCAR
- 2026-03-12 Listed $190,000 LCAR
- 2025-05-29 Sold (Public Records) $208,000 Public Records
- 2022-04-12 Sold (Public Records) $160,000 Public Records
Property tax history
+2.3%/yrLatest (2026): $2,937 · +5.4% YoY. Source: county tax records.
Cash-flow waterfall
monthlySold comps — $/sqft
last 12 mo · ≤1 miLoading sold comps…