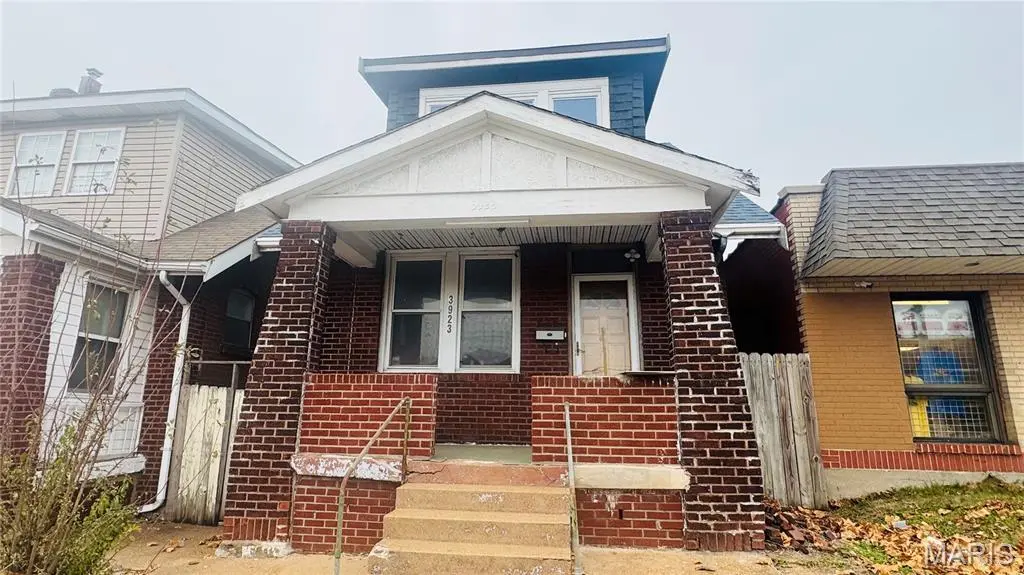
3923 Gravois Ave · St. Louis, MO
Flood risk 1/10 · Minimal
- FEMA flood zone
- X (unshaded)
- Chance of flooding over 30 yrs
- 0.0%
- Est. flood insurance / yr
- $473 – $860
Fire risk 1/10 · Minimal
- Est. fire insurance / yr
- $1,054 – $1,958
Heat risk 5/10 · Moderate
- Hot days now (above 108°F)
- 7 days/yr
- Hot days in 30 yrs
- 21 days/yr
Wind risk 2/10 · Minimal
- Chance of severe wind over 30 yrs
- 1.0%
Air-quality risk 3/10 · Minor
- Unhealthy air days now
- 3 days/yr
- Unhealthy air days in 30 yrs
- 4 days/yr
Risk factors via First Street. Map © Google.
Why this score? — see what drove the D grade
The composite is a weighted blend of 9 inputs, each scored 0–100. Each bar is that input's sub-score; the figure is the points it added to the 100-point composite (weight × sub-score).
- ARV discount +15.0/15.0
- Cash flow +11.3/30.0
- 1% rule +3.3/10.0
- DSCR +3.3/10.0
- Rent growth +3.2/5.0
- Livability +2.5/5.0
- Condition / age +2.5/5.0
- Schools +1.2/10.0
- Appreciation +0.0/10.0
$110,000
🖨 Deal sheet 📄 Offer letter ✓ Due diligence
Listing remarks MLS
Welcome to this charming all-brick 1.5-story home featuring 2 bedrooms and 2.5 baths, ideally located in the highly sought-after Tower Grove South neighborhood. Just minutes from vibrant shopping and dining options and the beautiful Tower Grove Park, this home offers the perfect blend of convenience, character, and city living. Step inside to discover classic architectural details, hardwood floors, a warm and inviting living space, and a functional floor plan that offers flexibility for everyday living or entertaining. The solid brick construction adds timeless appeal and lasting value. Property is being sold as-is. Seller to provide no inspections or repairs. Schedule your appointment today.
Key facts
- 3,123 sq ft lot
- Built 1921
- Listed 166 days
Neighborhood map
What this means for you Summary
Snapshot
- This is a 2-bed/1.0-bath single-family listed at $110k.
Deal economics
- At list price, monthly cash flow is $-41 ($-492/yr) — negative.
- To cash-flow at today's rent, offer at most $103k (6.6% below list).
- To meet the 1% rule (rent ≥ 1% of price), the offer needs to be $91k (17.4% below list).
- Recommended offer: $91k (17.4% below list) — sets the bar for 1% rule.
Location & tenants
- Location reads: area grade D — affects rentability + tenant quality, not the cash-flow math above.
- St. Louis City (urban): math 10% / reading 18% proficiency, ranked #312 of 324 in MO (top 96%) — low school quality limits family demand, transient renter base, plan for 1-2y turnover; 80% free/reduced lunch — lower-income household profile, screen leases tightly.
- Market conditions: Rents rising (+2.6%/yr); 255 active listings in the ZIP; 40 comparable units currently listed for rent nearby; rentals at typical pace (median 24d on market — plan ~3-4 weeks tenant-placement turnaround); 294 units permitted in St. Louis city in 2024 (227 in 5+ unit buildings).
- This rent is only 18% of the median local income ($61k/yr) — well below the 30% rent-burden line; pricing power to push rent on renewal without tenant pushback.
Forward outlook
- Local home prices are declining (-3.0%/yr); year-one equity from $761 of loan paydown is wiped out by about $3k of value loss. Plan a longer hold.
- St. Louis County population projected to shrink 6% by 2050 — rents likely to lag national; underwrite the cash flow, not the appreciation.
Negotiation context
- It's been on market 167 days — a 12% lower offer ($97k) is reasonable based on typical stale-listing flexibility.
- 2 sale attempts; this cycle's ask has dropped $15k (12%) from the opening price — seller is motivated, your offer sets the floor, not the list.
Risks & watch-outs
- Watch-outs: built in 1921 — expect roof / HVAC / electrical / plumbing capex.
- Climate carrying-cost: extreme-heat days projected 7→21/yr by 2055 (HVAC capex compounding) — expect insurance premiums to compound above CPI over the hold.
Questions for the listing agent
- What do current leases actually rent for vs. the listed asking? Can we see a recent rent roll and the last 12 months of T-12 income?
- It's been on market 167 days. Have you received any prior offers? Is the seller open to a 17% concession, seller financing, or rate buy-down credit?
- Built in 1921 — when were the roof, HVAC, electrical panel, plumbing, and water heater last replaced?
- Why hasn't it sold? Are there any deal-killer items the seller is aware of (foundation, flood, title, zoning, code violations)?
- Is there a deadline driving the sale (1031 exchange, divorce, estate, relocation)? That informs how much negotiation room exists.
- The area grade is low — what's the realistic commute time and amenity access for the typical tenant pool here? Any planned neighborhood developments (good or bad) we should know about?
- What's the average days-on-market for RENTAL listings here right now (not sales)? A rising rental-DOM trend means longer vacancies and softer asking-rent achievability than the comps imply.
- What's the recent tenant-quality profile in this submarket — average credit score on applications, eviction rate, late-payment / NSF rate, and stable-employment percentage? A property-management company in the area should have these aggregated.
- How much new for-sale + rental construction is in the pipeline within 1–3 miles? Heavy new supply typically softens prices + rents 12–24 months out; constrained supply supports both.
Investment metrics
- 1% rule
- 0.83% ✗
- Cap rate
- 5.85%
- Cash-on-cash
- -1.60%
- DSCR
- 0.93
- GRM
- 10.1
CMA / ARV
- ARV (median comp)
- $172,703
- List price
- $110,000
- Delta
- -36.31%
- Verdict
- UNDERPRICED
- Comps
- 20 within 1.0 mi
Show comp detail 12 sales within ~0.75 mi
| Address | Dist | Beds/Ba | Sqft | Sold | Price | $/sf | Match |
|---|---|---|---|---|---|---|---|
| 4132 Miami St | 0.35mi | 2/1.0 | 690 (-3%) | 1mo | $189,000 | $274 | 78 |
| 3959 Parker Ave | 0.36mi | 2/2.0 | 792 (+11%) | 3mo | $129,900 | $164 | 58 |
| 4327 Jessica Ave | 0.64mi | 2/1.0 | 656 (-8%) | 3mo | $100,000 | $152 | 55 |
| 4025 Tholozan Ave | 0.18mi | 2/2.0 | 816 (+15%) | 10mo | $189,900 | $233 | 55 |
| 4032 Winnebago St | 0.23mi | 2/1.0 | 802 (+13%) | 20mo | $134,900 | $168 | 52 |
| 4136 Miami St | 0.35mi | 1/1.0 (-1) | 641 (-10%) | 14mo | $164,900 | $257 | 50 |
| 4351 Potomac St | 0.74mi | 2/1.0 | 672 (-6%) | 9mo | $110,000 | $164 | 49 |
| 4046 Phillips Ave | 0.24mi | 2/1.0 | 814 (+14%) | 22mo | $189,900 | $233 | 47 |
| 4327 Chippewa St | 0.70mi | 1/1.0 (-1) | 680 (-4%) | 11mo | $55,000 | $81 | 46 |
| 3534 Lucy St | 0.65mi | 1/1.0 (-1) | 637 (-10%) | 4mo | $115,000 | $181 | 44 |
| 3720 Virginia Ave | 0.73mi | 1/1.0 (-1) | 814 (+14%) | 15mo | $25,000 | $31 | 25 |
| 4430 S Spring Ave | 0.75mi | 2/1.0 | 816 (+15%) | 20mo | $149,900 | $184 | 24 |
Match score weights: distance 35% · size 25% · config 20% · recency 20%. Top-matched comps best support the ARV.
Projected returns pro-forma
-3.0% appreciation · 2.62% rent growth · sell at horizon
- IRR
- -19.3%
- Equity multiple
- 0.33×
- Total profit
- $-20,770
- Equity at exit
- $16,401
- IRR
- -12.8%
- Equity multiple
- 0.26×
- Total profit
- $-22,806
- Equity at exit
- $9,511
Cash invested: $30,800 (down + closing). Projections, not guarantees.
Landlord ↔ Tenant lean methodology
- Overall (STATE)
- 81 Strongly Landlord-Friendly
- State Missouri
- 81 Strongly Landlord-Friendly · R+10
- County
- — inherits STATE
- City
- — inherits STATE
ZIP-level market 63116
- Rents YoY
- 2.6%
- Active inventory
- 255
- Price-to-rent
- 10.1×
Monthly cashflow live
- Estimated rent
- $908 high interval (Pro) →
- Mortgage (P&I)
- −$577
- Tax from tax record
- −$136 /mo · $1,631/yr
- Insurance
- −$46
- HOA
- −$0
- Vacancy / Maint / Mgmt
- −$191
- Net cashflow
- $-41
Break-even live
UW: 25.0% down · 7.5% · 30yr · 1.5% tax · 5.0% vac · 8.0% maint · 8.0% mgmt
Financing live
Cash to close
- Down payment
- $27,500
- Closing costs
- $3,300
- Reserves months
- —
- Total cash needed
- —
Loan-product check · same deal, 3 products live
Conventional
25% down · 7.5% · 30yr
- Down + closing
- —
- Monthly P&I
- —
- Monthly cashflow
- —
- DSCR
- —
- Eligible?
- —
Personal DTI + credit; lowest rate.
DSCR
20% down · 8.5% · 30yr
- Down + closing
- —
- Monthly P&I
- —
- Monthly cashflow
- —
- DSCR
- —
- Eligible?
- —
No personal income docs; deal must DSCR.
Hard money
10% down · 12.0% · 12mo
- Down + closing
- —
- Monthly P&I
- —
- Monthly cashflow
- —
- DSCR
- —
- Eligible?
- —
Short-term bridge; refi at stabilization.
Rent comps 40 comps
| Address | Beds | Baths | Sqft | Rent | $/sqft | DOM | Units | Dist |
|---|---|---|---|---|---|---|---|---|
| 3910 Chippewa St Unit 1f St. Louis, MO | 1.0 | 1.0 | 750 | $770 | $1.03 | 16d | 1 | 0.14mi |
| 3535 Roger Pl Unit LLW St. Louis, MO | 1.0 | 1.0 | 650 | $845 | $1.30 | 23d | 1 | 0.22mi |
| 3860 Bamberger Ave Unit 3N St. Louis, MO | 2.0 | 1.0 | 700 | $799 | $1.14 | 17d | 1 | 0.30mi |
| 3862 S Spring Ave Apt 3E St. Louis, MO | 1.0 | 1.0 | 700 | $695 | $0.99 | 10d | 1 | 0.34mi |
| 3653 S Grand Blvd Saint Louis, MO | 1.0 | 1.0 | 2050 | $1,350 | $0.66 | 1d | 4 | 0.41mi |
| 4192 Meramec St Unit 101 St. Louis, MO | 1.0 | 1.0 | 700 | $850 | $1.21 | 20d | 1 | 0.51mi |
| 4192 Meramec St Unit 104 St. Louis, MO | 1.0 | 1.0 | 675 | $850 | $1.26 | 43d | 1 | 0.51mi |
| 4192 Meramec St Unit 105 St. Louis, MO | 1.0 | 1.0 | 700 | $815 | $1.16 | 43d | 1 | 0.51mi |
| 4048 Giles Ave Apt 1S St. Louis, MO | 1.0 | 1.0 | 650 | $795 | $1.22 | 14d | 1 | 0.54mi |
| 3954 S Grand Blvd Apt 3N St. Louis, MO | 1.0 | 1.0 | 650 | $625 | $0.96 | 43d | 1 | 0.57mi |
| 3534 Morgan Ford Rd Unit 3534-C St. Louis, MO | 2.0 | 1.0 | 650 | $1,150 | $1.77 | 43d | 1 | 0.59mi |
| 3625 Morgan Ford Rd Unit 6 St. Louis, MO | 1.0 | 1.0 | 650 | $799 | $1.23 | 43d | 1 | 0.62mi |
| 4101 Dewey Ave Unit 2F St. Louis, MO | 1.0 | 1.0 | 650 | $775 | $1.19 | 23d | 1 | 0.63mi |
| 3402 Dunnica Ave Unit 3400 1f St. Louis, MO | 1.0 | 1.0 | 695 | $775 | $1.12 | 23d | 1 | 0.66mi |
| 4301 S 38th St Unit 1s St. Louis, MO | 1.0 | 1.0 | 686 | $900 | $1.31 | 23d | 1 | 0.67mi |
| 3406 Keokuk St Unit 3406 St. Louis, MO | 1.0 | 1.0 | 700 | $800 | $1.14 | 43d | 1 | 0.67mi |
| 3702 Meramec St Unit 1e St. Louis, MO | 2.0 | 1.0 | 725 | $950 | $1.31 | 7d | 1 | 0.71mi |
| 4341 Morgan Ford Rd Unit F St. Louis, MO | 1.0 | 1.0 | 750 | $749 | $1.00 | 4d | 1 | 0.72mi |
| 4341 Morganford Rd Saint Louis, MO | 1.0 | 1.0 | 750 | $799 | $1.07 | 43d | 1 | 0.73mi |
| 3611 Wyoming St Unit 3E St. Louis, MO | 2.0 | 1.0 | 750 | $1,199 | $1.60 | 4d | 1 | 0.74mi |
| 4205 Ellenwood Ave Unit 102 St. Louis, MO | 1.0 | 1.0 | 750 | $899 | $1.20 | 43d | 1 | 0.75mi |
| 4205 Ellenwood Ave Unit 202 St. Louis, MO | 1.0 | 1.0 | 750 | $899 | $1.20 | 23d | 1 | 0.76mi |
| 4227 Ellenwood Ave Saint Louis, MO | 1.0 | 1.0 | 650 | $825 | $1.27 | 16d | 1 | 0.76mi |
| 4231-4233 Ellenwood Ave St. Louis, MO | 1.0 | 1.0 | 650 | $825 | $1.27 | 14d | 1 | 0.76mi |
| 3179 S Grand Blvd Saint Louis, MO | 3.0 | 1.0 | 650 | $1,328 | $2.04 | 2d | 3 | 0.78mi |
| 4377 Chippewa St Unit G St. Louis, MO | 1.0 | 1.0 | 400 | $600 | $1.50 | 43d | 1 | 0.79mi |
| 4381 Chippewa St Unit B St. Louis, MO | 1.0 | 1.0 | 400 | $600 | $1.50 | 43d | 1 | 0.80mi |
| 4215 Neosho St Unit 101 St. Louis, MO | 2.0 | 1.0 | 750 | $825 | $1.10 | 43d | 1 | 0.81mi |
| 4407 Chippewa St Unit C St. Louis, MO | 1.0 | 1.0 | 400 | $795 | $1.99 | 23d | 1 | 0.82mi |
| 3201 Morganford Rd Saint Louis, MO | 1.0 | 1.0 | 746 | $1,725 | $2.31 | 1d | 4 | 0.86mi |
| 4448 Oleatha Ave St. Louis, MO | 1.0 | 1.0 | 720 | $950 | $1.32 | 20d | 1 | 0.87mi |
| 4329 S Grand Blvd Saint Louis, MO | 1.0 | 1.0 | 600 | $750 | $1.25 | 43d | 1 | 0.89mi |
| 3172 Morganford Rd Saint Louis, MO | 1.0 | 1.0 | 779 | $1,650 | $2.12 | 10d | 3 | 0.90mi |
| 4451 Grace Ave Saint Louis, MO | 2.0 | 1.0 | 700 | $750 | $1.07 | 17d | 1 | 0.92mi |
| 4316 Connecticut St Unit 2F St. Louis, MO | 1.0 | 1.0 | 700 | $799 | $1.14 | 17d | 1 | 0.92mi |
| 3839 Pennsylvania Ave Saint Louis, MO | 2.0 | 1.0 | 725 | $1,000 | $1.38 | 20d | 1 | 0.97mi |
| 3664 Neosho St Saint Louis, MO | 1.0 | 1.0 | 700 | $750 | $1.07 | 43d | 1 | 0.99mi |
| 4255 Virginia Ave Unit 206 St. Louis, MO | 1.0 | 1.0 | 506 | $750 | $1.48 | 43d | 1 | 0.99mi |
| 3111a Arkansas Ave St. Louis, MO | 1.0 | 1.0 | 700 | $875 | $1.25 | 43d | 1 | 0.99mi |
| 4305 Virginia Ave Unit 204 St. Louis, MO | 1.0 | 1.0 | 646 | $785 | $1.22 | 14d | 1 | 1.01mi |
Listing history 21 events
-
2026-06-18days on market $110,000 Active 167 DOM
-
2026-06-17days on market $110,000 Active 166 DOM
-
2026-06-16days on market $110,000 Active 165 DOM
-
2026-06-15days on market $110,000 Active 164 DOM
-
2026-06-13days on market $110,000 Active 162 DOM
-
2026-06-09days on market $110,000 Active 158 DOM
-
2026-06-08days on market $110,000 Active 157 DOM
-
2026-06-08days on market $110,000 Active 156 DOM
-
2026-06-05days on market $110,000 Active 153 DOM
-
2026-06-03days on market $110,000 Active 152 DOM
-
2026-06-02days on market $110,000 Active 151 DOM
-
2026-06-01days on market $110,000 Active 150 DOM
-
2026-05-31days on market $110,000 Active 149 DOM
-
2026-02-12price $119,900 701-char remark
Show marketing remark (701 chars)
Welcome to this charming all-brick 1.5-story home featuring 2 bedrooms and 2.5 baths, ideally located in the highly sought-after Tower Grove South neighborhood. Just minutes from vibrant shopping and dining options and the beautiful Tower Grove Park, this home offers the perfect blend of convenience, character, and city living. Step inside to discover classic architectural details, hardwood floors, a warm and inviting living space, and a functional floor plan that offers flexibility for everyday living or entertaining. The solid brick construction adds timeless appeal and lasting value. Property is being sold as-is. Seller to provide no inspections or repairs. Schedule your appointment today.
-
2026-02-12price $1,199,000 701-char remark
Show marketing remark (701 chars)
Welcome to this charming all-brick 1.5-story home featuring 2 bedrooms and 2.5 baths, ideally located in the highly sought-after Tower Grove South neighborhood. Just minutes from vibrant shopping and dining options and the beautiful Tower Grove Park, this home offers the perfect blend of convenience, character, and city living. Step inside to discover classic architectural details, hardwood floors, a warm and inviting living space, and a functional floor plan that offers flexibility for everyday living or entertaining. The solid brick construction adds timeless appeal and lasting value. Property is being sold as-is. Seller to provide no inspections or repairs. Schedule your appointment today.
-
2026-01-03$125,000 Active 701-char remark
Show marketing remark (701 chars)
Welcome to this charming all-brick 1.5-story home featuring 2 bedrooms and 2.5 baths, ideally located in the highly sought-after Tower Grove South neighborhood. Just minutes from vibrant shopping and dining options and the beautiful Tower Grove Park, this home offers the perfect blend of convenience, character, and city living. Step inside to discover classic architectural details, hardwood floors, a warm and inviting living space, and a functional floor plan that offers flexibility for everyday living or entertaining. The solid brick construction adds timeless appeal and lasting value. Property is being sold as-is. Seller to provide no inspections or repairs. Schedule your appointment today.
-
2026-01-02historical $125,000 701-char remark
Show marketing remark (701 chars)
Welcome to this charming all-brick 1.5-story home featuring 2 bedrooms and 2.5 baths, ideally located in the highly sought-after Tower Grove South neighborhood. Just minutes from vibrant shopping and dining options and the beautiful Tower Grove Park, this home offers the perfect blend of convenience, character, and city living. Step inside to discover classic architectural details, hardwood floors, a warm and inviting living space, and a functional floor plan that offers flexibility for everyday living or entertaining. The solid brick construction adds timeless appeal and lasting value. Property is being sold as-is. Seller to provide no inspections or repairs. Schedule your appointment today.
-
2025-05-10price $139,900
-
2025-03-18$149,900 Active
-
1996-08-14soldstatus
-
1996-08-14soldstatus
ⓘ Source: listings_history table (triggers on properties + properties_extension) + one-shot
backfill from property_details.listing_events for pre-trigger history.
Tax reassessment forecast MO · Resets to sale price
- Current annual tax
- $1,631 · $136/mo
- Projected year-2 tax
- $1,631 · $136/mo
- Expected delta
- $0/yr ($0/mo · 0.0%)
ⓘ Screening estimate from a state-policy table — verify with the county assessor before closing.
Climate risk First Street
- Flood 1/10 Low FEMA zone X (unshaded) · 0% chance over 30 yrs
- Wildfire 1/10 Low
- Heat 5/10 Major 7 d/yr ≥108°F today · 21 d/yr by 30 yrs out
- Wind 2/10 Low 100% chance of damaging wind over 30 yrs
- Air quality 3/10 Moderate 3 unhealthy d/yr today · 4 by 30 yrs out
Nearby sold comps map
Loading sold comps map…
Walkable amenities ~0.75 mi
Loading nearby amenities…
Taxation est. · year 1
- Rental income
- $10,901
- − Mortgage interest
- −$6,162
- − Property taxes
- −$1,631
- − Insurance
- −$550
- − Repairs & maintenance
- −$872
- − Management
- −$872
- − Depreciation
- −$3,200
- Taxable loss
- −$2,387
- Est. tax savings @ 24.0%
- +$573
- After-tax cash flow
- $81/yr
For passive investors: Depreciation is non-cash, so a rental often shows a tax loss while cash-flowing — sheltering income. Rental losses are passive: they offset passive income freely, and up to $25,000/yr can offset ordinary (W-2) income if you actively participate and your MAGI is under $100k (phasing out to $0 by $150k); unused losses carry forward. On sale, claimed depreciation is recaptured at up to 25%, and gains may owe capital-gains tax (a 1031 exchange can defer both). Figures are a year-1 estimate at your 24.0% rate — not tax advice; consult a CPA.
Schools (NCES district)
- District
- St. Louis City
- NCES district ID
- 2929280
- Math proficiency
- 10% ▼ -6.00%
- Reading proficiency
- 18% ▼ -3.00%
- Median HH income
- $35,685
- Composite
- 11.54/100
- National rank
- #9699
- State rank
- #312 of 324 in MO
Livability — St. Louis
No livability data for this city. (Only ~50 U.S. cities are tracked.)
Census & demographics
- Census place
- St. Louis, MO
- County
- Saint Louis City · 254,015 people
- City population
- 283,259
- Metro
- St. Louis, MO-IL
- Population (ZIP)
- 42,170
- Household income
- $61,433
- Rent vs Own
- Severe rent burden
- 1923.0
Population outlook (St. Louis County) Hauer SSP2
- Today (2025)
- 315,737 people
- By 2030
- 313,865 · -0.6%
- By 2040
- 305,439 · -3.3%
- By 2050
- 296,529 · -6.1%
- By 2075
- 271,028 · -14.2%
- By 2100
- 255,359 · -19.1%
Race, ethnicity, and origin ACS 2023
- Neighborhood character
- Diverse neighborhood (Simpson 0.63)
- Race & ethnicity
- White 54% Black 27% Hispanic / Latino 10% Two or more races 8% Asian 5%
- Hispanic origin (detail)
- Mexican 7%
- Common ancestry
- Lithuanian 4% Romanian 2% Italian 2%
- Foreign-born
- 11% · Canada, Vietnam, Philippines
- Languages at home
- 85% English-only · Spanish 6% Vietnamese 2% Arabic 2%
Political lean MEDSL · St. Louis
- 2024 margin
- Solid D (+64.7) · D 81.4% · R 16.7% · Other 2.0%
- 2008→2024 swing
- -3.5pp toward R · 2008: 68.2pp · 2024: 64.7pp
- All cycles
- 2024: D+64.7 2020: D+66.2 2016: D+63.7 2012: D+66.6 2008: D+68.2
Not yet ingested
- Civics
- —
Market trends
- HPI YoY
- ▼ -271.19%
- Current HPI
- 215.7108
- Rent YoY
- ▲ 2.62%
- Metro
- St. Louis, MO-IL
- State GDP YoY
- ▲ 1.84%
- F500 in state
- 20
Industry mix (Fortune 500 HQ in MO)
| Industry | F500 HQs | Revenue |
|---|---|---|
| Healthcare | 1 | $163B |
|
||
| Insurance | 1 | $21B |
|
||
| Industrial Technology | 1 | $17B |
|
||
| Retail | 1 | $16B |
|
||
| Industrial Distribution | 1 | $10B |
|
||
| Utilities | 1 | $9B |
|
||
Price history
-20.0% since first listed8 events — show timeline
- 2026-02-12 Price Changed $119,900 MARIS as Distributed by MLS Grid
- 2026-02-12 Price Changed $1,199,000 MARIS as Distributed by MLS Grid
- 2026-01-03 Listed $125,000 MARIS as Distributed by MLS Grid
- 2026-01-02 Coming Soon $125,000 MARIS as Distributed by MLS Grid
- 2025-05-10 Price Changed $139,900 MARIS as Distributed by MLS Grid
- 2025-03-18 Listed $149,900 MARIS as Distributed by MLS Grid
- 1996-08-14 Sold (Public Records) — Public Records
- 1996-08-14 Sold (Public Records) — Public Records
Property tax history
+4.5%/yrLatest (2024): $1,631 · +5.3% YoY. Source: county tax records.
Cash-flow waterfall
monthlySold comps — $/sqft
last 12 mo · ≤1 miLoading sold comps…