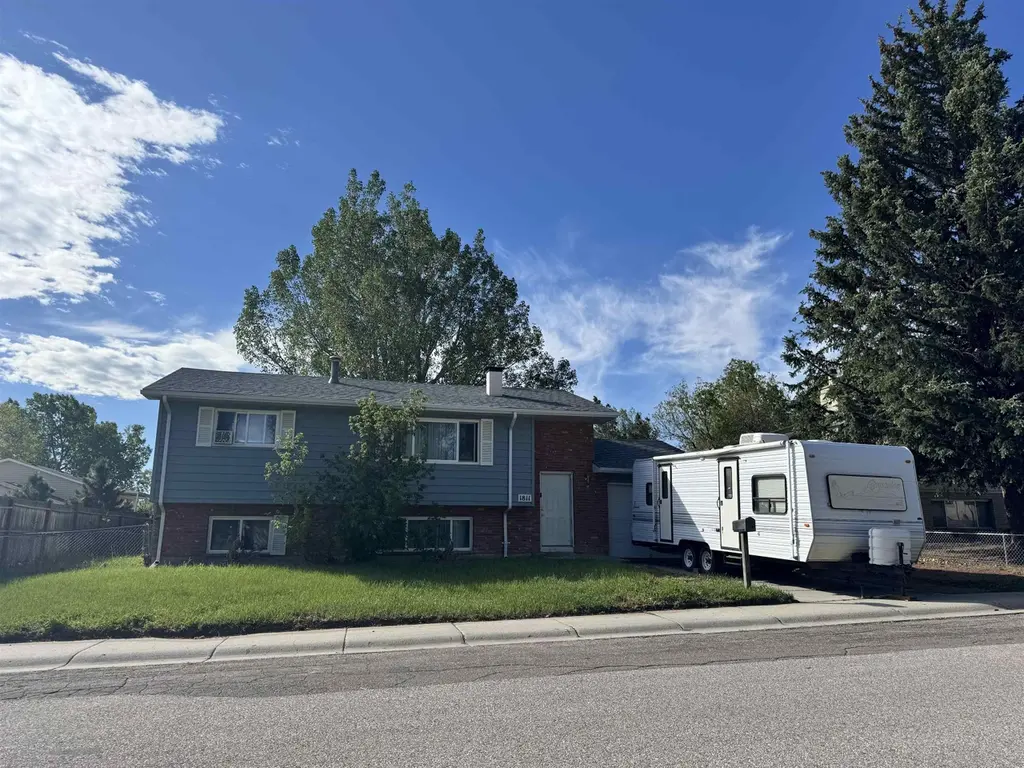
1811 Shumway · Casper, WY
Flood risk 1/10 · Minimal
- FEMA flood zone
- X (unshaded)
- Chance of flooding over 30 yrs
- 0.0%
- Est. flood insurance / yr
- $473 – $860
Fire risk 6/10 · Moderate
- Est. fire insurance / yr
- $564 – $1,046
Heat risk 3/10 · Minor
- Hot days now (above 91°F)
- 6 days/yr
- Hot days in 30 yrs
- 16 days/yr
Wind risk 1/10 · Minimal
- Chance of severe wind over 30 yrs
- —
Air-quality risk 2/10 · Minimal
- Unhealthy air days now
- 2 days/yr
- Unhealthy air days in 30 yrs
- 2 days/yr
Risk factors via First Street. Map © Google.
Why this score? — see what drove the C- grade
The composite is a weighted blend of 9 inputs, each scored 0–100. Each bar is that input's sub-score; the figure is the points it added to the 100-point composite (weight × sub-score).
- ARV discount +15.0/15.0
- Cash flow +13.6/30.0
- Rent growth +4.7/5.0
- Schools +4.2/10.0
- DSCR +4.1/10.0
- Livability +3.9/5.0
- 1% rule +2.8/10.0
- Condition / age +2.5/5.0
- Appreciation +0.0/10.0
$205,000
🖨 Deal sheet (PDF) 📄 Offer letter ✓ Due diligence
Listing remarks MLS
Spacious bi-level home located in a great South Central location. 4 bedrooms, spacious kitchen with breakfast nook and a single garage. Steel siding and newer windows. With a little work, this will be a great home. Contact Jennifer Gladson for your personal tour at 307-259-5074.
Key facts
- 7,841 sq ft lot
- Garage
- Built 1975
Neighborhood map
What this means for you Summary
Snapshot
- This is a 4-bed/2.0-bath single-family listed at $205k.
Deal economics
- At list price, monthly cash flow is $13 ($157/yr) — positive.
- The deal already cash-flows at list — no discount required.
- To meet the 1% rule (rent ≥ 1% of price), the offer needs to be $159k (22.4% below list).
- Recommended offer: $159k (22.4% below list) — sets the bar for 1% rule.
- Cap rate 6.4% vs local median 3.0% in Casper — top-decile yield for the area; either an underpriced asset or a hidden risk that comps aren't pricing in. Stress-test before assuming the spread holds.
Location & tenants
- Location reads 78/100 on livability (#8 in WY, #2,629 nationally) — a middle-class / working-renter tenant base. Strengths: commute A+, cost of living A+, housing A+; Watch: amenities D, health & safety F.
- Natrona County School District #1 (urban): math 44% / reading 52% proficiency, ranked #32 of 41 in WY (top 78%) — families likely to look elsewhere, expect single-tenant / working-renter base with shorter leases.
- Zoned schools: Lincoln Elementary School (math 42% / reading 32%, grade F, #128 of 151 statewide, top 86%, 459 students, 67% FRL); Centennial Middle School (math 37% / reading 54%, grade D+, #40 of 55 statewide, top 72%, 796 students, 31% FRL); Kelly Walsh High School (math 49% / reading 60%, grade C-, #18 of 75 statewide, top 30%, 2,051 students, 29% FRL).
- Market conditions: Rents rising fast (+9.0%/yr); 225 active listings in the ZIP; 310 units permitted in Natrona County in 2024 (104 in 5+ unit buildings).
Forward outlook
- Local home prices are declining (-3.0%/yr); year-one equity from $1k of loan paydown is wiped out by about $6k of value loss. Plan a longer hold.
- Natrona County population projected at +46% by 2050 — long-run rental-demand tailwind backs the buy-and-hold thesis.
Negotiation context
- Only 0 days on market — expect competitive offers; lowballing is unlikely to land.
- 2 sale attempts since 7y ago with the ask held roughly flat each time — persistent listings suggest the price (not the market) is what's stuck; bring a comps-based counter.
Risks & watch-outs
- Climate carrying-cost: major wildfire risk — expect insurance premiums to compound above CPI over the hold.
Questions for the listing agent
- Built in 1975 — when were the roof, HVAC, electrical panel, plumbing, and water heater last replaced?
- Is there a deadline driving the sale (1031 exchange, divorce, estate, relocation)? That informs how much negotiation room exists.
- What's the average days-on-market for RENTAL listings here right now (not sales)? A rising rental-DOM trend means longer vacancies and softer asking-rent achievability than the comps imply.
- What's the recent tenant-quality profile in this submarket — average credit score on applications, eviction rate, late-payment / NSF rate, and stable-employment percentage? A property-management company in the area should have these aggregated.
- How much new for-sale + rental construction is in the pipeline within 1–3 miles? Heavy new supply typically softens prices + rents 12–24 months out; constrained supply supports both.
Investment metrics
- 1% rule
- 0.78% ✗
- Cap rate
- 6.37%
- Cash-on-cash
- 0.27%
- DSCR
- 1.01
- GRM
- 10.7
CMA / ARV
- ARV (on-the-fly)
- $305,108
- Comps found
- 12
Show comp detail 12 sales within ~0.75 mi
| Address | Dist | Beds/Ba | Sqft | Sold | Price | $/sf | Match |
|---|---|---|---|---|---|---|---|
| 1935 Lennox Ave | 0.24mi | 3/2.0 (-1) | 1,820 (-1%) | 1mo | $267,000 | $147 | 82 |
| 1746 Glendale Ave | 0.18mi | 4/2.0 | 1,728 (-6%) | 2mo | $178,000 | $103 | 80 |
| 1854 S Lennox | 0.19mi | 4/2.0 | 1,968 (+7%) | 1mo | $280,000 | $142 | 78 |
| 1881 Shumway Ave | 0.11mi | 3/1.8 (-1) | 1,728 (-6%) | 2mo | $319,000 | $185 | 77 |
| 1635 S Fenway St | 0.30mi | 4/2.0 | 1,950 (+6%) | 1mo | $389,000 | $199 | 75 |
| 2131 S Fairdale Ave | 0.33mi | 3/2.0 (-1) | 1,788 (-3%) | 1mo | $335,000 | $187 | 74 |
| 1888 Shattuck Ave | 0.13mi | 3/2.0 (-1) | 1,671 (-9%) | 1mo | $328,000 | $196 | 73 |
| 1306 E 24th St | 0.54mi | 4/2.0 | 1,764 (-4%) | 2mo | $325,000 | $184 | 67 |
| 1416 S Jackson St | 0.67mi | 4/2.0 | 1,936 (+5%) | 2mo | $295,000 | $152 | 59 |
| 1405 S Jackson St | 0.66mi | 4/2.0 | 1,716 (-7%) | 2mo | $285,000 | $166 | 57 |
| 1728 S Jefferson St | 0.70mi | 3/2.0 (-1) | 1,772 (-4%) | 2mo | $215,000 | $121 | 55 |
| 2251 S Washington St | 0.59mi | 5/1.8 (+1) | 1,990 (+8%) | 2mo | $262,000 | $132 | 51 |
Match score weights: distance 35% · size 25% · config 20% · recency 20%. Top-matched comps best support the ARV.
Projected returns pro-forma
-3.0% appreciation · 8.0% rent growth · sell at horizon
- IRR
- -11.1%
- Equity multiple
- 0.58×
- Total profit
- $-24,061
- Equity at exit
- $30,566
- IRR
- 3.6%
- Equity multiple
- 1.31×
- Total profit
- $18,045
- Equity at exit
- $17,725
Cash invested: $57,400 (down + closing). Projections, not guarantees.
Landlord ↔ Tenant lean methodology
- Overall (STATE)
- 90 Strongly Landlord-Friendly
- State Wyoming
- 90 Strongly Landlord-Friendly · R+25
- County
- — inherits STATE
- City
- — inherits STATE
ZIP-level market 82601
- Rents YoY
- 9.0%
- Active inventory
- 225
- Price-to-rent
- 10.7×
Monthly cashflow live
- Estimated rent
- $1,591 medium interval (Pro) →
- Mortgage (P&I)
- −$1,075
- Tax from tax record
- −$83 /mo · $996/yr
- Insurance
- −$85
- HOA
- −$0
- Vacancy / Maint / Mgmt
- −$334
- Net cashflow
- $13
Break-even live
Sensitivity live
| Price | -10% $129 | -5% $71 | +0% $13 | +5% $-45 | +10% $-103 |
|---|---|---|---|---|---|
| Rent | -10% $-113 | -5% $-50 | +0% $13 | +5% $76 | +10% $139 |
| Rate | -1.0pp $116 | -0.5pp $65 | base $13 | +0.5pp $-40 | +1.0pp $-94 |
UW: 25.0% down · 7.5% · 30yr · 1.5% tax · 5.0% vac · 8.0% maint · 8.0% mgmt
Financing live
Cash to close
- Down payment
- $51,250
- Closing costs
- $6,150
- Reserves months
- —
- Total cash needed
- —
Loan-product check · same deal, 3 products live
Conventional
25% down · 7.5% · 30yr
- Down + closing
- —
- Monthly P&I
- —
- Monthly cashflow
- —
- DSCR
- —
- Eligible?
- —
Personal DTI + credit; lowest rate.
DSCR
20% down · 8.5% · 30yr
- Down + closing
- —
- Monthly P&I
- —
- Monthly cashflow
- —
- DSCR
- —
- Eligible?
- —
No personal income docs; deal must DSCR.
Hard money
10% down · 12.0% · 12mo
- Down + closing
- —
- Monthly P&I
- —
- Monthly cashflow
- —
- DSCR
- —
- Eligible?
- —
Short-term bridge; refi at stabilization.
Listing history 1 events
-
2026-06-05$205,000 Pending
ⓘ Source: listings_history table (triggers on properties + properties_extension) + one-shot
backfill from property_details.listing_events for pre-trigger history.
Tax reassessment forecast WY · Resets to sale price
- Current annual tax
- $996 · $83/mo
- Projected year-2 tax
- $1,250 · $104/mo
- Expected delta
- +$255/yr (+$21/mo · 25.6%)
ⓘ Screening estimate from a state-policy table — verify with the county assessor before closing.
Climate risk First Street
- Flood 1/10 Low FEMA zone X (unshaded) · 0% chance over 30 yrs
- Wildfire 6/10 Major
- Heat 3/10 Moderate 6 d/yr ≥91°F today · 16 d/yr by 30 yrs out
- Wind 1/10 Low
- Air quality 2/10 Low 2 unhealthy d/yr today · 2 by 30 yrs out
Nearby sold comps map
Loading sold comps map…
Walkable amenities ~0.75 mi
Loading nearby amenities…
Taxation est. · year 1
- Rental income
- $19,087
- − Mortgage interest
- −$11,483
- − Property taxes
- −$996
- − Insurance
- −$1,025
- − Repairs & maintenance
- −$1,527
- − Management
- −$1,527
- − Depreciation
- −$5,964
- Taxable loss
- −$3,435
- Est. tax savings @ 24.0%
- +$824
- After-tax cash flow
- $982/yr
For passive investors: Depreciation is non-cash, so a rental often shows a tax loss while cash-flowing — sheltering income. Rental losses are passive: they offset passive income freely, and up to $25,000/yr can offset ordinary (W-2) income if you actively participate and your MAGI is under $100k (phasing out to $0 by $150k); unused losses carry forward. On sale, claimed depreciation is recaptured at up to 25%, and gains may owe capital-gains tax (a 1031 exchange can defer both). Figures are a year-1 estimate at your 24.0% rate — not tax advice; consult a CPA.
Schools (NCES district)
- District
- Natrona County School District #1
- NCES district ID
- 5604510
- Math proficiency
- 44% ▼ -4.00%
- Reading proficiency
- 52% ▼ -2.00%
- Median HH income
- $55,217
- Composite
- 41.6/100
- National rank
- #3437
- State rank
- #32 of 41 in WY
Livability — Casper
- Score
- 78/100
- State rank
- #8
- US rank
- #2629
Category grades
Schools grade is shown separately in the Schools card above.
Census & demographics
- Census place
- Casper, WY
- County
- Natrona County · 72,922 people
- City population
- 72,922
- Metro
- Casper, WY
- Population (ZIP)
- 26,721
- Household income
- $67,642
- Rent vs Own
- Severe rent burden
- 749.0
Population outlook (Natrona County) Hauer SSP2
- Today (2025)
- 98,530 people
- By 2030
- 107,084 · +8.7%
- By 2040
- 124,838 · +26.7%
- By 2050
- 143,617 · +45.8%
- By 2075
- 192,378 · +95.2%
- By 2100
- 228,435 · +131.8%
Race, ethnicity, and origin ACS 2023
- Neighborhood character
- Predominantly White (84%)
- Race & ethnicity
- White 84% Hispanic / Latino 12% Two or more races 7%
- Hispanic origin (detail)
- Mexican 8%
- Common ancestry
- Slovak 4% Lithuanian 4% Portuguese 4%
- Foreign-born
- 3% · Canada
- Languages at home
- 94% English-only · Spanish 4%
Political lean MEDSL · Natrona
- 2024 margin
- Solid R (+48.6) · D 24.8% · R 73.5% · Other 1.7%
- 2008→2024 swing
- -14.3pp toward R · 2008: -34.4pp · 2024: -48.6pp
- All cycles
- 2024: R+48.6 2020: R+47.6 2016: R+52.2 2012: R+41.1 2008: R+34.4
Not yet ingested
- Civics
- —
Market trends
- HPI YoY
- ▼ -190.42%
- Current HPI
- 181.2192
- Rent YoY
- ▲ 8.97%
- Metro
- Casper, WY
- State GDP YoY
- —
- F500 in state
- 0
Price history
+32.3% since first listed4 events — show timeline
- 2026-06-04 Delisted — WMLS
- 2026-06-01 Listed $205,000 WMLS
- 2019-11-26 Sold (MLS) — WMLS
- 2019-10-09 Listed $155,000 WMLS
Property tax history
+3.4%/yrLatest (2025): $996 · -23.4% YoY. Source: county tax records.
Cash-flow waterfall
monthlySold comps — $/sqft
last 12 mo · ≤1 miLoading sold comps…