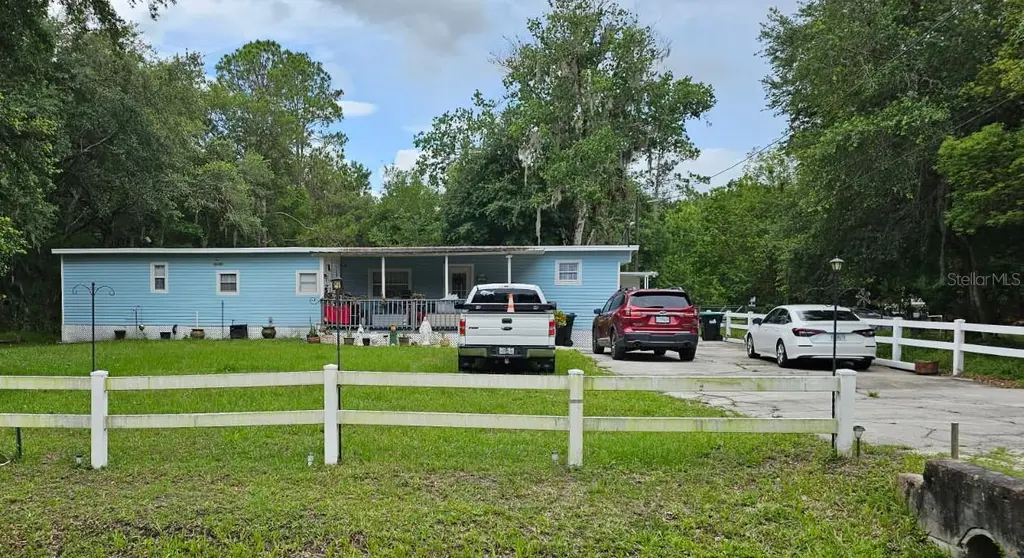
18222 Lynbrook Rd · Bithlo, FL
Flood risk 1/10 · Minimal
- FEMA flood zone
- X (unshaded)
- Chance of flooding over 30 yrs
- 0.0%
- Est. flood insurance / yr
- $507 – $1,088
Fire risk 5/10 · Moderate
- Est. fire insurance / yr
- $947 – $1,759
Heat risk 8/10 · Major
- Hot days now (above 107°F)
- 7 days/yr
- Hot days in 30 yrs
- 21 days/yr
Wind risk 10/10 · Severe
- Chance of severe wind over 30 yrs
- 99.0%
Air-quality risk 2/10 · Minimal
- Unhealthy air days now
- 0 days/yr
- Unhealthy air days in 30 yrs
- 1 days/yr
Risk factors via First Street. Map © Google.
Why this score? — see what drove the D- grade
The composite is a weighted blend of 9 inputs, each scored 0–100. Each bar is that input's sub-score; the figure is the points it added to the 100-point composite (weight × sub-score).
- Cash flow +11.0/30.0
- ARV discount +7.5/15.0
- Schools +4.1/10.0
- DSCR +3.2/10.0
- Livability +3.0/5.0
- Rent growth +2.5/5.0
- Condition / age +2.5/5.0
- 1% rule +2.0/10.0
- Appreciation +0.0/10.0
$249,000
🖨 Deal sheet (PDF) 📄 Offer letter ✓ Due diligence
Listing remarks MLS
* * * CASH ONLY - NO FINANCING * * * Own the land. NO HOA. 3/2 mobile home fresh paint throughout. Owner will put carpet in all rooms buyer can choose color. Metal roof.
Key facts
- 0.24 acre lot
- Built 1969
- Listed 19 days
Property features AI
Finance
- Other: Homestead exempt; Lot approximately 0.24 acre (0 to less than 1/4 acre)
- HOA & community: No association
Exterior
- Utilities: Well water; Septic tank; Electricity connected
- Home design: Residential mobile home (single wide); One story; Faces north; Entry on one level
- Construction: Metal siding; Metal roof; Crawlspace foundation; Built on or before public records (living area source: public records)
- Exterior features: Rain gutters; Exterior storage
Interior
- Kitchen: Built-in oven; Cooktop; Freezer; Refrigerator
- Bedrooms: 3 bedrooms
- Flooring: Vinyl
- Bathrooms: 2 full bathrooms
- Heating & cooling: Electric heating; Central air conditioning
- Interior features: Kitchen open to family room; Window treatments; Water filtration system
- Laundry & utility: Laundry room; Electric dryer hookup; Electric water heater
Neighborhood map
What this means for you Summary
Snapshot
- This is a 3-bed/2.0-bath manufactured listed at $249k.
Deal economics
- At list price, monthly cash flow is $-106 ($-1k/yr) — negative.
- To cash-flow at today's rent, offer at most $230k (7.5% below list).
- To meet the 1% rule (rent ≥ 1% of price), the offer needs to be $175k (29.7% below list).
- Recommended offer: $175k (29.7% below list) — sets the bar for 1% rule.
- Cap rate 5.8% vs local median 2.5% in Bithlo — top-decile yield for the area; either an underpriced asset or a hidden risk that comps aren't pricing in. Stress-test before assuming the spread holds.
Location & tenants
- Location reads 60/100 on livability (#808 in FL) — a middle-class / working-renter tenant base. Strengths: housing A+, crime A, employment A-; Watch: schools F, amenities F, commute F.
- Orange (suburban): math 46% / reading 51% proficiency, ranked #43 of 73 in FL (top 59%) — families likely to look elsewhere, expect single-tenant / working-renter base with shorter leases.
- Market conditions: 188 active listings in the ZIP; 1 comparable units currently listed for rent nearby; 8,053 units permitted in Orange County in 2024 (3,133 in 5+ unit buildings).
Forward outlook
- Local home prices are declining (-3.0%/yr); year-one equity from $2k of loan paydown is wiped out by about $7k of value loss. Plan a longer hold.
- Orange County population projected at +52% by 2050 — long-run rental-demand tailwind backs the buy-and-hold thesis.
Negotiation context
- It's been on market 20 days — a 2% lower offer ($245k) is reasonable based on typical stale-listing flexibility.
- 3 sale attempts since 5y ago with the ask held roughly flat each time — persistent listings suggest the price (not the market) is what's stuck; bring a comps-based counter.
- Current owner paid $119k; list at $249k implies a 109% gain — meaningful room to come down on a strong offer.
Risks & watch-outs
- Climate carrying-cost: severe wind risk, 99% chance of damaging wind over 30y; moderate wildfire risk; extreme-heat days projected 7→21/yr by 2055 (HVAC capex compounding) — expect insurance premiums to compound above CPI over the hold.
Questions for the listing agent
- What do current leases actually rent for vs. the listed asking? Can we see a recent rent roll and the last 12 months of T-12 income?
- Built in 1969 — when were the roof, HVAC, electrical panel, plumbing, and water heater last replaced?
- Is there a deadline driving the sale (1031 exchange, divorce, estate, relocation)? That informs how much negotiation room exists.
- Schools are F-rated, which usually means shorter tenancies and higher turnover. Who's the typical renter profile here, and what's been the actual vacancy rate?
- The area grade is low — what's the realistic commute time and amenity access for the typical tenant pool here? Any planned neighborhood developments (good or bad) we should know about?
- What's the average days-on-market for RENTAL listings here right now (not sales)? A rising rental-DOM trend means longer vacancies and softer asking-rent achievability than the comps imply.
- What's the recent tenant-quality profile in this submarket — average credit score on applications, eviction rate, late-payment / NSF rate, and stable-employment percentage? A property-management company in the area should have these aggregated.
- How much new for-sale + rental construction is in the pipeline within 1–3 miles? Heavy new supply typically softens prices + rents 12–24 months out; constrained supply supports both.
Investment metrics
- 1% rule
- 0.70% ✗
- Cap rate
- 5.78%
- Cash-on-cash
- -1.83%
- DSCR
- 0.92
- GRM
- 11.9
CMA / ARV
No comps found within radius.
Projected returns pro-forma
-3.0% appreciation · 3.0% rent growth · sell at horizon
- IRR
- -19.4%
- Equity multiple
- 0.32×
- Total profit
- $-47,225
- Equity at exit
- $37,127
- IRR
- -12.2%
- Equity multiple
- 0.28×
- Total profit
- $-50,299
- Equity at exit
- $21,529
Cash invested: $69,720 (down + closing). Projections, not guarantees.
Landlord ↔ Tenant lean methodology
- Overall (STATE)
- 87 Strongly Landlord-Friendly
- State Florida
- 87 Strongly Landlord-Friendly · R+3
- County
- — inherits STATE
- City
- — inherits STATE
ZIP-level market 32820
- Home prices YoY
- -14.6%
- Active inventory
- 188
- Price-to-rent
- 11.9×
Monthly cashflow live
- Estimated rent
- $1,750 medium interval (Pro) →
- Mortgage (P&I)
- −$1,306
- Tax from tax record
- −$79 /mo · $949/yr
- Insurance
- −$104
- HOA
- −$0
- Vacancy / Maint / Mgmt
- −$368
- Net cashflow
- $-106
Break-even live
Sensitivity live
| Price | -10% $35 | -5% $-36 | +0% $-106 | +5% $-177 | +10% $-247 |
|---|---|---|---|---|---|
| Rent | -10% $-244 | -5% $-175 | +0% $-106 | +5% $-37 | +10% $32 |
| Rate | -1.0pp $19 | -0.5pp $-43 | base $-106 | +0.5pp $-171 | +1.0pp $-236 |
UW: 25.0% down · 7.5% · 30yr · 1.5% tax · 5.0% vac · 8.0% maint · 8.0% mgmt
Financing live
Cash to close
- Down payment
- $62,250
- Closing costs
- $7,470
- Reserves months
- —
- Total cash needed
- —
Loan-product check · same deal, 3 products live
Conventional
25% down · 7.5% · 30yr
- Down + closing
- —
- Monthly P&I
- —
- Monthly cashflow
- —
- DSCR
- —
- Eligible?
- —
Personal DTI + credit; lowest rate.
DSCR
20% down · 8.5% · 30yr
- Down + closing
- —
- Monthly P&I
- —
- Monthly cashflow
- —
- DSCR
- —
- Eligible?
- —
No personal income docs; deal must DSCR.
Hard money
10% down · 12.0% · 12mo
- Down + closing
- —
- Monthly P&I
- —
- Monthly cashflow
- —
- DSCR
- —
- Eligible?
- —
Short-term bridge; refi at stabilization.
Rent comps 1 comps
| Address | Beds | Baths | Sqft | Rent | $/sqft | DOM | Units | Dist |
|---|---|---|---|---|---|---|---|---|
| 17778 Caudel Rd Orlando, FL | 3.0 | 2.0 | 1104 | $1,750 | $1.59 | 25d | 1 | 1.10mi |
Listing history 16 events
-
2026-06-21days on market $249,000 Active 20 DOM
-
2026-06-18days on market $249,000 Active 17 DOM
-
2026-06-17days on market $249,000 Active 16 DOM
-
2026-06-16days on market $249,000 Active 15 DOM
-
2026-06-15remarks 699-char remark
-
2026-06-15days on market $249,000 Active 14 DOM
-
2026-06-13days on market $249,000 Active 12 DOM
-
2026-06-13days on market $249,000 Active 11 DOM
-
2026-06-09days on market $249,000 Active 8 DOM
-
2026-06-08days on market $249,000 Active 7 DOM
-
2026-06-07days on market $249,000 Active 6 DOM
-
2026-06-04days on market $249,000 Active 3 DOM
-
2026-06-03days on market $249,000 Active 2 DOM
-
2026-06-02remarks 662-char remark
-
2026-06-01remarks 620-char remark
-
2026-06-01$249,000 Active 1 DOM
ⓘ Source: listings_history table (triggers on properties + properties_extension) + one-shot
backfill from property_details.listing_events for pre-trigger history.
Tax reassessment forecast FL · Resets to sale price
- Current annual tax
- $949 · $79/mo
- Projected year-2 tax
- $2,067 · $172/mo
- Expected delta
- +$1,117/yr (+$93/mo · 117.7%)
ⓘ Screening estimate from a state-policy table — verify with the county assessor before closing.
Climate risk First Street
- Flood 1/10 Low FEMA zone X (unshaded) · 0% chance over 30 yrs
- Wildfire 5/10 Major
- Heat 8/10 Severe 7 d/yr ≥107°F today · 21 d/yr by 30 yrs out
- Wind 10/10 Extreme 99% chance of damaging wind over 30 yrs
- Air quality 2/10 Low 0 unhealthy d/yr today · 1 by 30 yrs out
Nearby sold comps map
Loading sold comps map…
Walkable amenities ~0.75 mi
Loading nearby amenities…
Taxation est. · year 1
- Rental income
- $21,000
- − Mortgage interest
- −$13,948
- − Property taxes
- −$949
- − Insurance
- −$1,245
- − Repairs & maintenance
- −$1,680
- − Management
- −$1,680
- − Depreciation
- −$7,244
- Taxable loss
- −$5,746
- Est. tax savings @ 24.0%
- +$1,379
- After-tax cash flow
- $105/yr
For passive investors: Depreciation is non-cash, so a rental often shows a tax loss while cash-flowing — sheltering income. Rental losses are passive: they offset passive income freely, and up to $25,000/yr can offset ordinary (W-2) income if you actively participate and your MAGI is under $100k (phasing out to $0 by $150k); unused losses carry forward. On sale, claimed depreciation is recaptured at up to 25%, and gains may owe capital-gains tax (a 1031 exchange can defer both). Figures are a year-1 estimate at your 24.0% rate — not tax advice; consult a CPA.
Schools (NCES district)
- District
- Orange
- NCES district ID
- 1201440
- Math proficiency
- 46% ▼ -9.00%
- Reading proficiency
- 51% ▼ -2.00%
- Median HH income
- $49,350
- Composite
- 41.47/100
- National rank
- #3461
- State rank
- #43 of 73 in FL
Livability — Bithlo
- Score
- 60/100
- State rank
- #808
- US rank
- #19212
Category grades
Schools grade is shown separately in the Schools card above.
Census & demographics
- Census place
- Bithlo, FL
- Population (ZIP)
- 11,130
Population outlook (Orange County) Hauer SSP2
- Today (2025)
- 1,618,226 people
- By 2030
- 1,787,404 · +10.5%
- By 2040
- 2,125,621 · +31.4%
- By 2050
- 2,454,016 · +51.6%
- By 2075
- 3,173,711 · +96.1%
- By 2100
- 3,607,781 · +122.9%
Race, ethnicity, and origin ACS 2023
- Neighborhood character
- Diverse neighborhood (Simpson 0.70)
- Race & ethnicity
- White 44% Hispanic / Latino 29% Two or more races 19% Black 17% Asian 3%
- Hispanic origin (detail)
- Puerto Rican 18% Cuban 5%
- Common ancestry
- Iranian 1% Italian 1% Armenian 1%
- Foreign-born
- 19% · Canada, Jamaica, Mexico
- Languages at home
- 76% English-only · Spanish 18% Arabic 2% Other Indo-European 1%
Political lean MEDSL · Orange
- 2024 margin
- D (+13.6) · D 56.1% · R 42.5% · Other 1.3%
- 2008→2024 swing
- -5.0pp toward R · 2008: 18.6pp · 2024: 13.6pp
- All cycles
- 2024: D+13.6 2020: D+23.1 2016: D+24.6 2012: D+18.2 2008: D+18.6
Not yet ingested
- Civics
- —
Market trends
- HPI YoY
- ▼ -47.82%
- Current HPI
- 279.7452
- Rent YoY
- —
- Metro
- —
- State GDP YoY
- ▲ 3.28%
- F500 in state
- 36
Industry mix (Fortune 500 HQ in FL)
| Industry | F500 HQs | Revenue |
|---|---|---|
| Industrial Technology | 2 | $29B |
|
||
| Insurance | 2 | $17B |
|
||
| Retail | 1 | $60B |
|
||
| Technology Distribution | 1 | $58B |
|
||
| Homebuilding | 1 | $35B |
|
||
| Technology Manufacturing | 1 | $35B |
|
||
Price history
+3220.0% since first listed10 events — show timeline
- 2026-06-01 Listed $249,000 Stellar MLS as Distributed by MLS Grid
- 2021-07-28 Sold (Public Records) $119,000 Public Records
- 2021-07-26 Sold (MLS) $119,900 Stellar MLS as Distributed by MLS Grid
- 2021-05-24 Pending — Stellar MLS as Distributed by MLS Grid
- 2021-05-16 Relisted — Stellar MLS as Distributed by MLS Grid
- 2021-05-13 Pending — Stellar MLS as Distributed by MLS Grid
- 2021-04-30 Listed $119,900 Stellar MLS as Distributed by MLS Grid
- 2006-10-10 Sold (Public Records) $45,000 Public Records
- 2002-07-03 Sold (Public Records) $50,000 Public Records
- 1980-12-01 Sold (Public Records) $7,500 Public Records
Property tax history
+3.6%/yrLatest (2025): $949 · +13.5% YoY. Source: county tax records.
Cash-flow waterfall
monthlySold comps — $/sqft
last 12 mo · ≤1 miLoading sold comps…