16 Haig Dr · Rancho Mirage, CA
Flood risk 1/10 · Minimal
- FEMA flood zone
- X
- Chance of flooding over 30 yrs
- 0.0%
- Est. flood insurance / yr
- $507 – $1,088
Fire risk 4/10 · Minor
- Est. fire insurance / yr
- $659 – $1,223
Heat risk 9/10 · Severe
- Hot days now (above 114°F)
- 7 days/yr
- Hot days in 30 yrs
- 21 days/yr
Wind risk 1/10 · Minimal
- Chance of severe wind over 30 yrs
- —
Air-quality risk 4/10 · Minor
- Unhealthy air days now
- 5 days/yr
- Unhealthy air days in 30 yrs
- 7 days/yr
Risk factors via First Street. Map © Google.
Why this score? — see what drove the C- grade
The composite is a weighted blend of 9 inputs, each scored 0–100. Each bar is that input's sub-score; the figure is the points it added to the 100-point composite (weight × sub-score).
- Cash flow +20.3/30.0
- 1% rule +8.0/10.0
- ARV discount +7.5/15.0
- DSCR +6.4/10.0
- Rent growth +3.4/5.0
- Schools +2.7/10.0
- Livability +2.6/5.0
- Condition / age +2.5/5.0
- Appreciation +0.0/10.0
$399,000
🖨 Deal sheet 📄 Offer letter ✓ Due diligence
Listing remarks
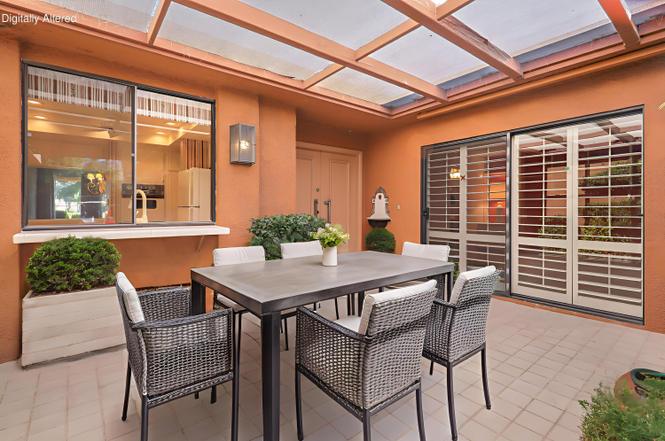
Take advantage of this rare opportunity to own a Seville model with timeless charm and sweeping fairway views. A tile-lined courtyard welcomes you into a spacious interior featuring vaulted tray ceilings, a warm wood-paneled accent wall, and a wet bar perfect for entertaining. The kitchen offers classic tile flooring, crisp white cabinetry, and vintage tile countertops for a touch of retro elegance. The private primary suite includes dual closets and an ensuite bath with a dual vanity, easy-entry tub, and separate shower. A guest bedroom with plantation shutters and built-in shelving connects to a Jack-and-Jill powder room, offering flexible functionality. Slate tile patios and serene golf
Key facts
- Wet bar
- Tile countertops
- Serene fairway views
Tags
Property features AI
Finance
- Other: Washer, dryer and refrigerator included in sale; Disclosures include CC&R, sewer assessments, pet restrictions, planned development and HOA information; earthquake insurance available
- Financial info: Standard sale; seller may consider conventional, VA, 1031 exchange, cash, or cash-to-new-loan financing; Will not consider lease; short-term rentals not allowed
- HOA & community: Gated community with 746 units; Monthly association fees total approximately $1,150 (split as $805.23 and $344.78); Association covers building & grounds, trash, sewer, security, insurance (including earthquake), cable TV, and clubhouse; Community amenities include clubhouse, fitness center, card room, banquet facilities, bocce ball, tennis and pickleball courts, par-3 golf, guest parking, lake/pond, greenbelt/park, controlled access, management, and grounds maintenance; Pets allowed per association rules (call for details); Rental restrictions in place
Exterior
- Parking: Attached garage; Two garage spaces; Two covered spaces; Two additional uncovered/assigned spaces; Assigned and covered parking with garage door opener; driveway parking available; Total parking for six vehicles
- Security: Gated community with 24-hour security; Card/code access and automatic gate; Community-wide security included in association
- Utilities: Water provided by district (CVWD); Sewer connected and paid; Cable TV available; PUD
- Home design: Spanish-style condominium; Single-story (ground level, no unit above); Front door faces west; leisure area faces east; Model: Seville
- Construction: Stucco exterior; Foam, tile and flat roofing; Slab foundation; Built by Bone
- Exterior features: Covered concrete patio; Landscaped grounds; Underground utilities; Sprinkler system with timer; Stucco wall and wrought-iron fencing; Located on a golf course, close to clubhouse; Panoramic and mountain views; Community pool and spa (heated, in-ground, gunite) with fenced lap area; pool and spa have safety fence/gate
Interior
- Kitchen: Tile countertops; Electric cooktop; Electric oven; Microwave; Range hood; Refrigerator with ice maker; Freezer; Disposal; Dishwasher; Water line to refrigerator
- Bedrooms: All bedrooms on the main floor; Main-floor master bedroom
- Flooring: Carpet; Tile
- Bathrooms: Two full bathrooms; Double vanities; Tile shower; Sunken tub; Separate shower stall; Shower and tub combination
- Heating & cooling: Central air conditioning; Central forced-air heating; Natural gas heating fuel
- Interior features: Built-in features; Tray ceilings; High (9 ft+) ceilings; Ground-level entry with no steps; Double door entry; Sliding doors; Blinds and shutters on windows; Unfurnished
- Laundry & utility: Washer and dryer included; Laundry located in garage; 220V outlets in garage and kitchen
Neighborhood map
What this means for you Summary
Snapshot
- This is a 2-bed/2.0-bath condo listed at $399k.
Deal economics
- At list price, monthly cash flow is $510 ($6k/yr) — positive.
- The deal already cash-flows at list — no discount required.
- Meets the 1% rule at list price ($5k rent vs $399k).
- Recommended offer: $351k (12.0% below list) — sets the bar for market timing.
- Cap rate 7.8% vs local median 3.0% in Rancho Mirage — top-decile yield for the area; either an underpriced asset or a hidden risk that comps aren't pricing in. Stress-test before assuming the spread holds.
Location & tenants
- Location reads 51/100 on livability (#1,065 in CA) — a working-class tenant base; expect higher turnover. Strengths: employment A+; Watch: amenities F, commute F, cost of living F.
- Palm Springs Unified (suburban): math 21% / reading 42% proficiency, ranked #328 of 517 in CA (top 63%) — families likely to look elsewhere, expect single-tenant / working-renter base with shorter leases; 73% free/reduced lunch — lower-income household profile, screen leases tightly.
- Market conditions: Rents rising (+3.7%/yr); 529 active listings in the ZIP; 30 comparable units currently listed for rent nearby; rentals lingering (median 44d on market — plan ~5-8 weeks vacancy on turnover, expect pricing pressure); 63% of comp listings sitting > 30 days — soft ceiling on asking rent; solid renter incomes; 9,195 units permitted in Riverside County in 2024 (1,512 in 5+ unit buildings).
- At $5,186/mo this rent would consume 58% of the median local household income ($107k/yr) (locally 498% of renters already pay >50% of income on rent) — very limited rent-growth headroom before tenants either downsize or default.
Forward outlook
- Local home prices are declining (-3.0%/yr); year-one equity from $3k of loan paydown is wiped out by about $12k of value loss. Plan a longer hold.
- Riverside County population projected at +22% by 2050 — long-run rental-demand tailwind backs the buy-and-hold thesis.
Negotiation context
- It's been on market 150 days — a 12% lower offer ($351k) is reasonable based on typical stale-listing flexibility.
Risks & watch-outs
- Watch-outs: HOA is 22% of rent.
- Climate carrying-cost: extreme-heat days projected 7→21/yr by 2055 (HVAC capex compounding) — expect insurance premiums to compound above CPI over the hold.
Questions for the listing agent
- It's been on market 150 days. Have you received any prior offers? Is the seller open to a 12% concession, seller financing, or rate buy-down credit?
- Built in 1975 — when were the roof, HVAC, electrical panel, plumbing, and water heater last replaced?
- What does the HOA fee cover, when was the last increase, and are there any pending special assessments or reserve-fund shortfalls?
- Any open or pending special assessments — roof, HVAC, plumbing, elevator, façade? What's the per-unit balance and payoff schedule, and is the seller paying it off at close or rolling it to the buyer?
- Why hasn't it sold? Are there any deal-killer items the seller is aware of (foundation, flood, title, zoning, code violations)?
- Is there a deadline driving the sale (1031 exchange, divorce, estate, relocation)? That informs how much negotiation room exists.
- What's the average days-on-market for RENTAL listings here right now (not sales)? A rising rental-DOM trend means longer vacancies and softer asking-rent achievability than the comps imply.
- What's the recent tenant-quality profile in this submarket — average credit score on applications, eviction rate, late-payment / NSF rate, and stable-employment percentage? A property-management company in the area should have these aggregated.
- How much new apartment / multifamily construction is in the pipeline within 1–3 miles? Heavy new supply (>2% of stock underway) typically softens rents 12–24 months out; light construction supports rent growth.
Investment metrics
- 1% rule
- 1.30% ✓
- Cap rate
- 7.83%
- Cash-on-cash
- 5.48%
- DSCR
- 1.24
- GRM
- 6.4
CMA / ARV
No comps found within radius.
Projected returns pro-forma
-3.0% appreciation · 3.72% rent growth · sell at horizon
- IRR
- -6.6%
- Equity multiple
- 0.75×
- Total profit
- $-27,801
- Equity at exit
- $59,492
- IRR
- 4.2%
- Equity multiple
- 1.32×
- Total profit
- $35,764
- Equity at exit
- $34,498
Cash invested: $111,720 (down + closing). Projections, not guarantees.
Landlord ↔ Tenant lean methodology
- Overall (STATE)
- 18 Strongly Tenant-Friendly
- State California
- 18 Strongly Tenant-Friendly · D+13
- County
- — inherits STATE
- City
- — inherits STATE
ZIP-level market 92270
- Rents YoY
- 3.7%
- Active inventory
- 529
- Price-to-rent
- 6.4×
Monthly cashflow live
- Estimated rent
- $5,186 high interval (Pro) →
- Mortgage (P&I)
- −$2,092
- Tax from tax record
- −$179 /mo · $2,142/yr
- Insurance
- −$166
- HOA
- −$1,150
- Vacancy / Maint / Mgmt
- −$1,089
- Net cashflow
- $510
Break-even live
UW: 25.0% down · 7.5% · 30yr · 1.5% tax · 5.0% vac · 8.0% maint · 8.0% mgmt
Financing live
Cash to close
- Down payment
- $99,750
- Closing costs
- $11,970
- Reserves months
- —
- Total cash needed
- —
Loan-product check · same deal, 3 products live
Conventional
25% down · 7.5% · 30yr
- Down + closing
- —
- Monthly P&I
- —
- Monthly cashflow
- —
- DSCR
- —
- Eligible?
- —
Personal DTI + credit; lowest rate.
DSCR
20% down · 8.5% · 30yr
- Down + closing
- —
- Monthly P&I
- —
- Monthly cashflow
- —
- DSCR
- —
- Eligible?
- —
No personal income docs; deal must DSCR.
Hard money
10% down · 12.0% · 12mo
- Down + closing
- —
- Monthly P&I
- —
- Monthly cashflow
- —
- DSCR
- —
- Eligible?
- —
Short-term bridge; refi at stabilization.
Rent comps 30 comps
| Address | Beds | Baths | Sqft | Rent | $/sqft | DOM | Units | Dist |
|---|---|---|---|---|---|---|---|---|
| 8 Valencia Dr Rancho Mirage, CA | 3.0 | 2.0 | 1700 | $6,800 | $4.00 | 43d | 1 | 0.10mi |
| 8 Cadiz Dr Rancho Mirage, CA | 2.0 | 2.0 | 1701 | $6,300 | $3.70 | 43d | 1 | 0.18mi |
| 26 Sunrise Dr Rancho Mirage, CA | 3.0 | 3.0 | 1762 | $6,500 | $3.69 | 7d | 1 | 0.22mi |
| 36 Sunrise Dr Rancho Mirage, CA | 2.0 | 2.0 | 1320 | $3,200 | $2.42 | 18d | 1 | 0.27mi |
| 48 Palma Dr Rancho Mirage, CA | 2.0 | 2.0 | 1320 | $6,200 | $4.70 | 43d | 1 | 0.31mi |
| 6 Granada Dr Rancho Mirage, CA | 2.0 | 2.0 | 1320 | $2,950 | $2.23 | 24d | 1 | 0.31mi |
| 97 Palma Dr Rancho Mirage, CA | 2.0 | 2.0 | 1650 | $5,900 | $3.58 | 43d | 1 | 0.37mi |
| 11 Palma Dr Rancho Mirage, CA | 2.0 | 2.0 | 1320 | $6,500 | $4.92 | 43d | 1 | 0.41mi |
| 88 La Ronda Dr Rancho Mirage, CA | 2.0 | 2.0 | 1320 | $6,700 | $5.08 | 43d | 1 | 0.43mi |
| 142 La Cerra Dr Rancho Mirage, CA | 2.0 | 2.0 | 1650 | $4,000 | $2.42 | 43d | 1 | 0.46mi |
| 72 Majorca Dr Rancho Mirage, CA | 2.0 | 2.0 | 1320 | $3,038 | $2.30 | 43d | 1 | 0.47mi |
| 17 Lugo Dr Rancho Mirage, CA | 3.0 | 2.0 | 1581 | $3,700 | $2.34 | 43d | 1 | 0.49mi |
| 35 Malaga Dr Rancho Mirage, CA | 3.0 | 2.0 | 1776 | $2,499 | $1.41 | 24d | 1 | 0.59mi |
| 5 Majorca Dr Rancho Mirage, CA | 2.0 | 2.0 | 1650 | $5,700 | $3.45 | 43d | 1 | 0.72mi |
| 900 Island Dr #507 Rancho Mirage, CA | 2.0 | 2.0 | 1867 | $6,500 | $3.48 | 43d | 1 | 0.82mi |
| 72385 Beverly Way Rancho Mirage, CA | 2.0 | 2.0 | 1851 | $2,500 | $1.35 | 18d | 1 | 0.87mi |
| 71863 Eleanora Ln Rancho Mirage, CA | 2.0 | 2.0 | 1384 | $2,600 | $1.88 | 43d | 1 | 0.88mi |
| 72460 Rodeo Way Rancho Mirage, CA | 2.0 | 2.0 | 1851 | $2,500 | $1.35 | 5d | 1 | 0.91mi |
| 910 Island Dr #112 Rancho Mirage, CA | 2.0 | 2.0 | 1815 | $6,500 | $3.58 | 18d | 1 | 1.01mi |
| 910 Island Dr #112 Rancho Mirage, CA | 2.0 | 2.0 | 1815 | $4,250 | $2.34 | 43d | 1 | 1.01mi |
| 910 Island Dr #111 Rancho Mirage, CA | 2.0 | 2.0 | 1783 | $3,250 | $1.82 | 23d | 1 | 1.01mi |
| 71292 Biskra Rd Rancho Mirage, CA | 3.0 | 2.0 | 1732 | $7,999 | $4.62 | 43d | 1 | 1.05mi |
| 142 Lake Shore Dr Rancho Mirage, CA | 3.0 | 3.0 | 1888 | $4,850 | $2.57 | 43d | 1 | 1.17mi |
| 93 Kavenish Dr Rancho Mirage, CA | 3.0 | 3.0 | 2136 | $6,800 | $3.18 | 3d | 1 | 1.34mi |
| 40080 Via Buena Vista Rancho Mirage, CA | 3.0 | 3.0 | 1848 | $3,800 | $2.06 | 24d | 1 | 1.35mi |
| 105 Kavenish Dr Rancho Mirage, CA | 3.0 | 3.0 | 1724 | $4,200 | $2.44 | 43d | 1 | 1.37mi |
| 71798 San Gorgonio Rd Rancho Mirage, CA | 3.0 | 2.0 | 1243 | $4,500 | $3.62 | 43d | 1 | 1.40mi |
| 45 Cueta Dr Rancho Mirage, CA | 2.0 | 2.0 | 1270 | $3,000 | $2.36 | 43d | 1 | 1.42mi |
| 40560 Glenwood Ln Palm Desert, CA | 3.0 | 3.0 | 2052 | $6,500 | $3.17 | 43d | 1 | 1.49mi |
| 27 Calle Encinitas Rancho Mirage, CA | 2.0 | 2.0 | 1537 | $2,200 | $1.43 | 23d | 1 | 1.49mi |
HOA detail condo
- Monthly dues
- $1,150 · $13,800/yr
- Assessments
- None detected in remarks — confirm with the listing agent.
Listing history 6 events
-
2026-05-15status Pending
-
2026-04-30historical Active Under Contract
-
2026-04-10price $399,000
-
2026-02-27price $409,000
-
2026-01-14price $429,000
-
2025-12-16$449,000 Active
ⓘ Source: listings_history table (triggers on properties + properties_extension) + one-shot
backfill from property_details.listing_events for pre-trigger history.
Tax reassessment forecast CA · Resets to sale price
- Current annual tax
- $2,142 · $179/mo
- Projected year-2 tax
- $3,032 · $253/mo
- Expected delta
- +$890/yr (+$74/mo · 41.6%)
ⓘ Screening estimate from a state-policy table — verify with the county assessor before closing.
Climate risk First Street
- Flood 1/10 Low FEMA zone X · 0% chance over 30 yrs
- Wildfire 4/10 Moderate
- Heat 9/10 Extreme 7 d/yr ≥114°F today · 21 d/yr by 30 yrs out
- Wind 1/10 Low
- Air quality 4/10 Moderate 5 unhealthy d/yr today · 7 by 30 yrs out
Nearby sold comps map
Loading sold comps map…
Walkable amenities ~0.75 mi
Loading nearby amenities…
Taxation est. · year 1
- Rental income
- $62,235
- − Mortgage interest
- −$22,350
- − Property taxes
- −$2,142
- − Insurance
- −$1,995
- − Repairs & maintenance
- −$4,979
- − Management
- −$4,979
- − HOA
- −$13,800
- − Depreciation
- −$11,607
- Taxable income
- $383
- Est. tax owed @ 24.0%
- −$92
- After-tax cash flow
- $6,028/yr
For passive investors: Depreciation is non-cash, so a rental often shows a tax loss while cash-flowing — sheltering income. Rental losses are passive: they offset passive income freely, and up to $25,000/yr can offset ordinary (W-2) income if you actively participate and your MAGI is under $100k (phasing out to $0 by $150k); unused losses carry forward. On sale, claimed depreciation is recaptured at up to 25%, and gains may owe capital-gains tax (a 1031 exchange can defer both). Figures are a year-1 estimate at your 24.0% rate — not tax advice; consult a CPA.
Schools (NCES district)
- District
- Palm Springs Unified
- NCES district ID
- 0629550
- Math proficiency
- 21% ▼ -7.00%
- Reading proficiency
- 42% ▬ 0.00%
- Median HH income
- $43,638
- Composite
- 26.76/100
- National rank
- #7131
- State rank
- #328 of 517 in CA
Livability — Rancho Mirage
- Score
- 51/100
- State rank
- #1065
- US rank
- #25255
Category grades
Schools grade is shown separately in the Schools card above.
Census & demographics
- Census place
- Rancho Mirage, CA
- County
- Riverside County · 2,287,001 people
- City population
- 17,563
- Metro
- Riverside-San Bernardino-Ontario, CA
- Population (ZIP)
- 17,563
- Household income
- $107,364
- Rent vs Own
- Severe rent burden
- 498.0
Population outlook (Riverside County) Hauer SSP2
- Today (2025)
- 2,664,475 people
- By 2030
- 2,802,692 · +5.2%
- By 2040
- 3,050,904 · +14.5%
- By 2050
- 3,256,783 · +22.2%
- By 2075
- 3,655,058 · +37.2%
- By 2100
- 3,766,594 · +41.4%
Race, ethnicity, and origin ACS 2023
- Neighborhood character
- Predominantly White (77%)
- Race & ethnicity
- White 77% Hispanic / Latino 15% Two or more races 6% Asian 4% Black 2%
- Hispanic origin (detail)
- Mexican 12%
- Common ancestry
- Slovak 4% Romanian 3% Lithuanian 3%
- Foreign-born
- 17% · Canada, South Korea, China
- Languages at home
- 81% English-only · Spanish 11% Other Indo-European 3% French/Haitian/Cajun 1%
Political lean MEDSL · Riverside
- 2024 margin
- Toss-up / Even · D 48.0% · R 49.3% · Other 2.6%
- 2008→2024 swing
- -3.6pp toward R · 2008: 2.3pp · 2024: -1.3pp
- All cycles
- 2024: R+1.3 2020: D+8.0 2016: D+4.3 2012: R+0.4 2008: D+2.3
Not yet ingested
- Civics
- —
Market trends
- HPI YoY
- ▼ -210.99%
- Current HPI
- 282.2957
- Rent YoY
- ▲ 3.72%
- Metro
- Riverside-San Bernardino-Ontario, CA
- State GDP YoY
- ▲ 3.21%
- F500 in state
- 116
Industry mix (Fortune 500 HQ in CA)
| Industry | F500 HQs | Revenue |
|---|---|---|
| Technology | 27 | $1,492B |
|
||
| Financial Services | 3 | $174B |
|
||
| Retail | 3 | $44B |
|
||
| Insurance | 3 | $26B |
|
||
| Media / Entertainment | 2 | $115B |
|
||
| Pharmaceuticals / Biotech | 2 | $62B |
|
||
Price history
-11.1% since first listed6 events — show timeline
- 2026-05-15 Pending — GPSMLS
- 2026-04-30 Contingent — GPSMLS
- 2026-04-10 Price Changed $399,000 GPSMLS
- 2026-02-27 Price Changed $409,000 GPSMLS
- 2026-01-14 Price Changed $429,000 GPSMLS
- 2025-12-16 Listed $449,000 GPSMLS
Property tax history
+2.0%/yrLatest (2025): $2,142 · +0.3% YoY. Source: county tax records.
Cash-flow waterfall
monthlySold comps — $/sqft
last 12 mo · ≤1 miLoading sold comps…