 Triplex
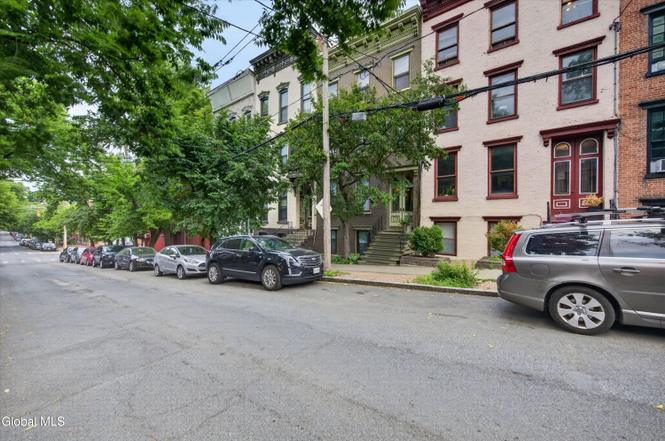
82 Dove St · Albany, NY
Flood risk 1/10 · Minimal
- FEMA flood zone
- X (unshaded)
- Chance of flooding over 30 yrs
- 0.0%
- Est. flood insurance / yr
- $473 – $860
Fire risk 1/10 · Minimal
- Est. fire insurance / yr
- $691 – $1,283
Heat risk 4/10 · Minor
- Hot days now (above 97°F)
- 7 days/yr
- Hot days in 30 yrs
- 17 days/yr
Wind risk 3/10 · Minor
- Chance of severe wind over 30 yrs
- 6.0%
Air-quality risk 1/10 · Minimal
- Unhealthy air days now
- 0 days/yr
- Unhealthy air days in 30 yrs
- 0 days/yr
Risk factors via First Street. Map © Google.
Why this score? — see what drove the C- grade
The composite is a weighted blend of 9 inputs, each scored 0–100. Each bar is that input's sub-score; the figure is the points it added to the 100-point composite (weight × sub-score).
- Cash flow +24.1/30.0
- DSCR +7.8/10.0
- 1% rule +7.1/10.0
- Rent growth +4.2/5.0
- Livability +4.0/5.0
- Schools +3.2/10.0
- Condition / age +2.5/5.0
- Appreciation +2.0/10.0
- ARV discount +0.0/15.0
$399,000
🖨 Deal sheet 📄 Offer letter ✓ Due diligence
Multi-family units
County records classify this as Multi-Family (2-4 Unit). Listing-text estimate: 3 units. confirmed
Listing remarks MLS
WELL MAINTAINED 3 UNIT WITH GREAT RENTS AND A STUNNING OWNER'S UNIT! SUNNY, NEW KITCHEN WITH CHERRY CABINETS & GRANITE COUNTERTOPS. OPEN DESIGN WITH EXPOSED BEAMS & BRICK, WOOD BURNING STOVE, SKYLIGHTS, DECKS & MUCH MORE! Excellent Condition
Key facts
- Private decks
- Washington park
- Off-street parking
Tags
Property features AI
Finance
- Financial info: Three-unit property (triplex)
Exterior
- Parking: Total 2 parking spaces; Other parking features
- Utilities: Public water; Public sewer
- Home design: Triplex; Below-grade finished area (basement) present
- Construction: Brick construction
- Exterior features: Flat rubber roof; Other exterior features
Interior
- Bedrooms: Unit 1: 1 bedroom; Unit 2: 1 bedroom; Unit 3: 3 bedrooms
- Flooring: Wood and hardwood floors
- Bathrooms: Four full bathrooms (located in basement, 1st floor, and two on 2nd floor total)
- Heating & cooling: Baseboard heating (natural gas); Central cooling (other)
- Interior features: Finished full basement; Wood / Hardwood flooring; One fireplace
- Laundry & utility: Main-level laundry room
Neighborhood map
What this means for you Summary
Snapshot
- This is a 2×1bd/1.0ba + 1×3bd/2.0ba units multifamily listed at $399k.
Deal economics
- At list price, monthly cash flow is $792 ($10k/yr) — positive. Per door: $264/mo.
- The deal already cash-flows at list — no discount required.
- Meets the 1% rule at list price ($5k rent vs $399k).
- Cap rate 8.7% vs local median 5.7% in Albany — top-decile yield for the area; either an underpriced asset or a hidden risk that comps aren't pricing in. Stress-test before assuming the spread holds.
Location & tenants
- Location reads 79/100 on livability (#129 in NY, #2,083 nationally) — a middle-class / working-renter tenant base. Strengths: amenities A+, commute A+, housing A+; Watch: employment C-, crime F.
- Albany City School District (urban): math 37% / reading 40% proficiency, ranked #543 of 590 in NY (top 92%) — families likely to look elsewhere, expect single-tenant / working-renter base with shorter leases; 66% free/reduced lunch — lower-income household profile, screen leases tightly.
- Zoned schools: Giffen Memorial Elementary School (math 17% / reading 22%, grade F, #1,992 of 2,108 statewide, top 95%, 404 students, 93% FRL); Albany High School (math 74% / reading 67%, grade B+, #710 of 1,100 statewide, top 65%, 2,676 students, 69% FRL) — zoned schools average 81% FRL vs 66% district-wide (15 pts higher); higher-poverty schools than district average — tighter screening recommended.
- Market conditions: Rents rising fast (+6.9%/yr); 70 active listings in the ZIP; 4 comparable units currently listed for rent nearby; rentals lingering (median 44d on market — plan ~5-8 weeks vacancy on turnover, expect pricing pressure); 100% of comp listings sitting > 30 days — soft ceiling on asking rent; 675 units permitted in Albany County in 2024 (451 in 5+ unit buildings).
- At $4,823/mo this rent would consume 104% of the median local household income ($56k/yr) (locally 1211% of renters already pay >50% of income on rent) — very limited rent-growth headroom before tenants either downsize or default.
Forward outlook
- Local home prices are declining (-3.0%/yr); year-one equity from $3k of loan paydown is wiped out by about $12k of value loss. Plan a longer hold.
- Albany County population projected at +9% by 2050 — modest demand growth; plan on rents tracking national, not racing it.
- At projected returns (-3.0% appreciation + 6.9% rent growth), your $112k cash investment doubles in ~9 years — after that, you're playing with house money.
Negotiation context
- Only 5 days on market — expect competitive offers; lowballing is unlikely to land.
- 2 sale attempts since 25y ago with the ask held roughly flat each time — persistent listings suggest the price (not the market) is what's stuck; bring a comps-based counter.
- Current owner paid $210k; list at $399k implies a 90% gain — meaningful room to come down on a strong offer.
Risks & watch-outs
- Watch-outs: built in 1870 — expect roof / HVAC / electrical / plumbing capex.
Questions for the listing agent
- Can we see the unit-by-unit rent roll, current vacancy, and any below-market leases? What's the average tenancy length?
- What capital expenditures (roof, boiler, parking lot, exteriors) have been made in the last 5 years, and what's planned in the next 2?
- Built in 1870 — when were the roof, HVAC, electrical panel, plumbing, and water heater last replaced?
- Is there a deadline driving the sale (1031 exchange, divorce, estate, relocation)? That informs how much negotiation room exists.
- Crime grade is F in this area — have there been break-ins, vandalism, or insurance claims at this property in the last 3 years? What carrier currently insures it and at what premium?
- What's the average days-on-market for RENTAL listings here right now (not sales)? A rising rental-DOM trend means longer vacancies and softer asking-rent achievability than the comps imply.
- What's the recent tenant-quality profile in this submarket — average credit score on applications, eviction rate, late-payment / NSF rate, and stable-employment percentage? A property-management company in the area should have these aggregated.
- How much new apartment / multifamily construction is in the pipeline within 1–3 miles? Heavy new supply (>2% of stock underway) typically softens rents 12–24 months out; light construction supports rent growth.
Investment metrics
- 1% rule
- 1.21% ✓
- Cap rate
- 8.67%
- Cash-on-cash
- 8.51%
- DSCR
- 1.38
- GRM
- 6.9
CMA / ARV
- ARV (on-the-fly)
- $322,560
- Comps found
- 12
Show comp detail 12 sales within ~0.75 mi
| Address | Dist | Beds/Ba | Sqft | Sold | Price | $/sf | Match |
|---|---|---|---|---|---|---|---|
| 285.5 Hudson Ave | 0.04mi | 4/4.0 | 2,478 (-8%) | 5mo | $430,000 | $174 | 81 |
| 208 Elm St | 0.19mi | 4/3.0 | 2,508 (-7%) | 3mo | $420,000 | $167 | 73 |
| 270 Morton Ave | 0.58mi | 5/4.0 (+1) | 2,714 (+1%) | 9mo | $477,000 | $176 | 59 |
| 211 Clinton Ave | 0.57mi | 5/3.0 (+1) | 2,640 (-2%) | 4mo | $250,000 | $95 | 58 |
| 184 Elm St | 0.21mi | 4/2.0 | 2,394 (-11%) | 7mo | $375,000 | $157 | 58 |
| 492 Madison Ave | 0.30mi | 3/2.5 (-1) | 2,995 (+11%) | 4mo | $360,000 | $120 | 53 |
| 114 Lark St | 0.51mi | 5/3.0 (+1) | 2,835 (+6%) | 11mo | $260,000 | $92 | 49 |
| 51 1/2 First St | 0.67mi | 4/3.5 | 2,975 (+11%) | 5mo | $365,000 | $123 | 44 |
| 79 1st St | 0.65mi | 5/3.0 (+1) | 2,516 (-6%) | 8mo | $275,000 | $109 | 43 |
| 26 Trinity Pl | 0.64mi | 5/2.0 (+1) | 2,508 (-7%) | 11mo | $230,000 | $92 | 36 |
| 8 Avondale Ter | 0.65mi | 4/2.0 | 2,296 (-15%) | 2mo | $189,000 | $82 | 35 |
| 425 Clinton Ave | 0.74mi | 5/4.5 (+1) | 3,072 (+14%) | 12mo | $280,000 | $91 | 25 |
Match score weights: distance 35% · size 25% · config 20% · recency 20%. Top-matched comps best support the ARV.
Projected returns pro-forma
-3.0% appreciation · 6.86% rent growth · sell at horizon
- IRR
- 1.2%
- Equity multiple
- 1.05×
- Total profit
- $5,472
- Equity at exit
- $59,492
- IRR
- 14.6%
- Equity multiple
- 2.41×
- Total profit
- $157,116
- Equity at exit
- $34,498
Cash invested: $111,720 (down + closing). Projections, not guarantees.
Landlord ↔ Tenant lean methodology
- Overall (STATE)
- 15 Strongly Tenant-Friendly
- State New York
- 15 Strongly Tenant-Friendly · D+10
- County
- — inherits STATE
- City
- — inherits STATE
ZIP-level market 12210
- Home prices YoY
- -2.3%
- Rents YoY
- 6.9%
- Active inventory
- 70
- Price-to-rent
- 22.0×
Monthly cashflow live
- Estimated rent
- $4,823 high interval (Pro) →
- Mortgage (P&I)
- −$2,092
- Tax from tax record
- −$760 /mo · $9,115/yr
- Insurance
- −$166
- HOA
- −$0
- Vacancy / Maint / Mgmt
- −$1,013
- Net cashflow
- $792
Break-even live
3-unit breakdown (identical units grouped — click to expand)
| Units | Beds | Baths | Est. rent |
|---|---|---|---|
| 2× units | 1 | 1 | $3,028 |
| #1 | 1 | 1 | $1,514 |
| #2 | 1 | 1 | $1,514 |
| 1× unit | 3 | 2 | $1,795 |
| Total (3 units) | $4,823 | ||
UW: 25.0% down · 7.5% · 30yr · 1.5% tax · 5.0% vac · 8.0% maint · 8.0% mgmt
Financing live
Cash to close
- Down payment
- $99,750
- Closing costs
- $11,970
- Reserves months
- —
- Total cash needed
- —
Loan-product check · same deal, 3 products live
Conventional
25% down · 7.5% · 30yr
- Down + closing
- —
- Monthly P&I
- —
- Monthly cashflow
- —
- DSCR
- —
- Eligible?
- —
Personal DTI + credit; lowest rate.
DSCR
20% down · 8.5% · 30yr
- Down + closing
- —
- Monthly P&I
- —
- Monthly cashflow
- —
- DSCR
- —
- Eligible?
- —
No personal income docs; deal must DSCR.
Hard money
10% down · 12.0% · 12mo
- Down + closing
- —
- Monthly P&I
- —
- Monthly cashflow
- —
- DSCR
- —
- Eligible?
- —
Short-term bridge; refi at stabilization.
Rent comps 4 comps
| Address | Beds | Baths | Sqft | Rent | $/sqft | DOM | Units | Dist |
|---|---|---|---|---|---|---|---|---|
| 32 1st St Albany, NY | 4.0 | 1.5 | 1773 | $1,850 | $1.04 | 43d | 1 | 0.67mi |
| 257 Quail St Albany, NY | 4.0 | 2.5 | 2208 | $2,800 | $1.27 | 43d | 1 | 0.97mi |
| 154 Spring St Albany, NY | 3.0 | 1.0 | 2500 | $1,695 | $0.68 | 43d | 1 | 1.04mi |
| 32 Peyster St Unit 1st floor Albany, NY | 3.0 | 2.0 | 2714 | $2,500 | $0.92 | 43d | 1 | 1.50mi |
Listing history 5 events
-
2026-06-16statusdays on market $399,000 Pending 5 DOM
-
2026-06-15remarks 699-char remark
-
2026-06-15days on market $399,000 Active 4 DOM
-
2026-06-14remarks 692-char remark
-
2026-06-14$399,000 Active 2 DOM
ⓘ Source: listings_history table (triggers on properties + properties_extension) + one-shot
backfill from property_details.listing_events for pre-trigger history.
Tax reassessment forecast NY · Partial reset (capped growth)
- Current annual tax
- $9,115 · $760/mo
- Projected year-2 tax
- $9,115 · $760/mo
- Expected delta
- $0/yr ($0/mo · 0.0%)
ⓘ Screening estimate from a state-policy table — verify with the county assessor before closing.
Climate risk First Street
- Flood 1/10 Low FEMA zone X (unshaded) · 0% chance over 30 yrs
- Wildfire 1/10 Low
- Heat 4/10 Moderate 7 d/yr ≥97°F today · 17 d/yr by 30 yrs out
- Wind 3/10 Moderate 6% chance of damaging wind over 30 yrs
- Air quality 1/10 Low 0 unhealthy d/yr today · 0 by 30 yrs out
Nearby sold comps map
Loading sold comps map…
Walkable amenities ~0.75 mi
Loading nearby amenities…
Taxation est. · year 1
- Rental income
- $57,876
- − Mortgage interest
- −$22,350
- − Property taxes
- −$9,115
- − Insurance
- −$1,995
- − Repairs & maintenance
- −$4,630
- − Management
- −$4,630
- − Depreciation
- −$11,607
- Taxable income
- $3,548
- Est. tax owed @ 24.0%
- −$852
- After-tax cash flow
- $8,651/yr
For passive investors: Depreciation is non-cash, so a rental often shows a tax loss while cash-flowing — sheltering income. Rental losses are passive: they offset passive income freely, and up to $25,000/yr can offset ordinary (W-2) income if you actively participate and your MAGI is under $100k (phasing out to $0 by $150k); unused losses carry forward. On sale, claimed depreciation is recaptured at up to 25%, and gains may owe capital-gains tax (a 1031 exchange can defer both). Figures are a year-1 estimate at your 24.0% rate — not tax advice; consult a CPA.
Schools (NCES district)
- District
- Albany City School District
- NCES district ID
- 3602460
- Math proficiency
- 37% ▲ 6.00%
- Reading proficiency
- 40% ▲ 7.00%
- Median HH income
- $40,568
- Composite
- 32.34/100
- National rank
- #5744
- State rank
- #543 of 590 in NY
Livability — Albany
- Score
- 79/100
- State rank
- #129
- US rank
- #2083
Category grades
Schools grade is shown separately in the Schools card above.
Census & demographics
- Census place
- Albany, NY
- County
- Albany County · 196,626 people
- City population
- 116,921
- Metro
- Albany-Schenectady-Troy, NY
- Population (ZIP)
- 10,297
- Household income
- $55,843
- Rent vs Own
- Severe rent burden
- 1211.0
Population outlook (Albany County) Hauer SSP2
- Today (2025)
- 320,794 people
- By 2030
- 327,401 · +2.1%
- By 2040
- 338,218 · +5.4%
- By 2050
- 348,467 · +8.6%
- By 2075
- 381,693 · +19.0%
- By 2100
- 393,809 · +22.8%
Race, ethnicity, and origin ACS 2023
- Neighborhood character
- Diverse neighborhood (Simpson 0.63)
- Race & ethnicity
- White 44% Black 41% Two or more races 7% Hispanic / Latino 7% Asian 3%
- Hispanic origin (detail)
- Puerto Rican 3% Dominican 2%
- Common ancestry
- Romanian 4% Lithuanian 2% Serbian 2%
- Foreign-born
- 8% · Canada, China, Vietnam
- Languages at home
- 89% English-only · Spanish 3% French/Haitian/Cajun 2% Other Indo-European 2%
Political lean MEDSL · Albany
- 2024 margin
- Strong D (+25.8) · D 62.9% · R 37.1%
- 2008→2024 swing
- -3.6pp toward R · 2008: 29.4pp · 2024: 25.8pp
- All cycles
- 2024: D+25.8 2020: D+31.4 2016: D+24.3 2012: D+31.0 2008: D+29.4
Not yet ingested
- Civics
- —
Market trends
- HPI YoY
- ▼ -5.92%
- Current HPI
- 252.3084
- Rent YoY
- ▲ 6.86%
- Metro
- Albany-Schenectady-Troy, NY
- State GDP YoY
- ▲ 2.60%
- F500 in state
- 92
Industry mix (Fortune 500 HQ in NY)
| Industry | F500 HQs | Revenue |
|---|---|---|
| Financial Services | 10 | $950B |
|
||
| Consumer Goods | 9 | $162B |
|
||
| Insurance | 4 | $225B |
|
||
| Telecommunications | 2 | $144B |
|
||
| Pharmaceuticals | 2 | $112B |
|
||
| Media / Entertainment | 2 | $69B |
|
||
Price history
+320.0% since first listed7 events — show timeline
- 2026-06-11 Listed $399,000 Global MLS
- 2004-09-27 Sold (Public Records) $210,000 Public Records
- 2001-12-11 Sold (Public Records) $142,000 Public Records
- 2001-11-30 Sold (MLS) $138,500 Global MLS
- 2001-11-03 Listing Removed — Global MLS
- 2001-11-01 Listed $149,900 Global MLS
- 1999-03-30 Sold (Public Records) $95,000 Public Records
Property tax history
+3.0%/yrLatest (2025): $9,115 · +0.1% YoY. Source: county tax records.
Cash-flow waterfall
monthlySold comps — $/sqft
last 12 mo · ≤1 miLoading sold comps…