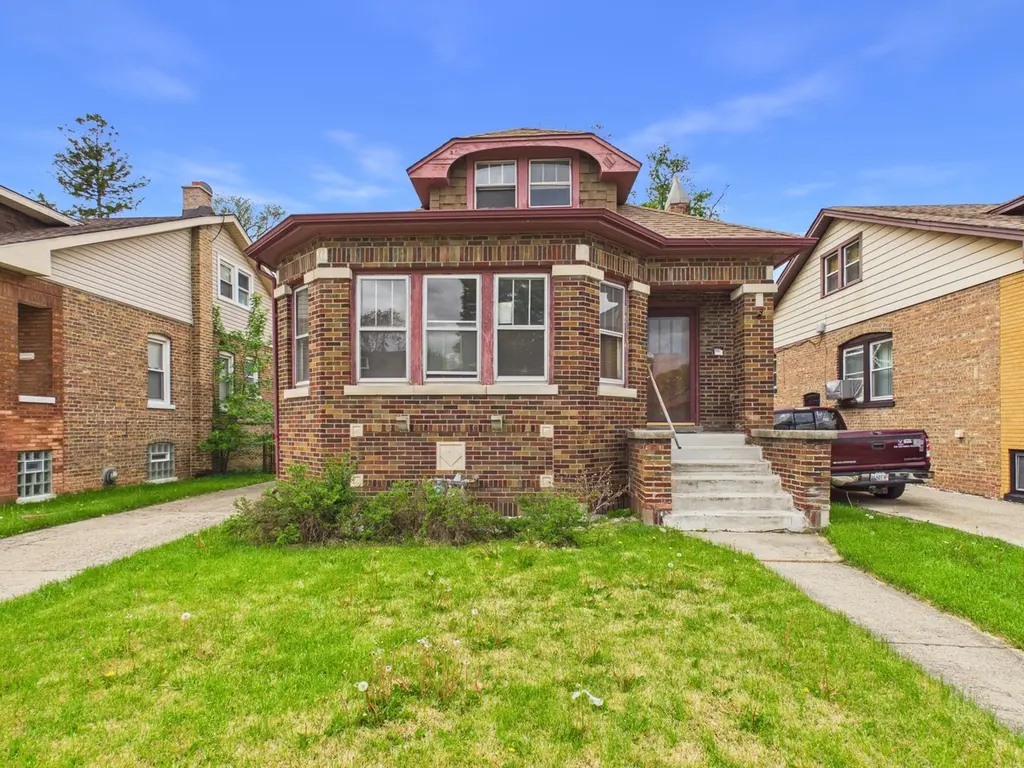
1036 22nd Ave · Bellwood, IL
Flood risk 1/10 · Minimal
- FEMA flood zone
- X (shaded)
- Chance of flooding over 30 yrs
- 0.0%
- Est. flood insurance / yr
- $507 – $1,088
Fire risk 1/10 · Minimal
- Est. fire insurance / yr
- $804 – $1,492
Heat risk 3/10 · Minor
- Hot days now (above 101°F)
- 7 days/yr
- Hot days in 30 yrs
- 14 days/yr
Wind risk 2/10 · Minimal
- Chance of severe wind over 30 yrs
- —
Air-quality risk 4/10 · Minor
- Unhealthy air days now
- 6 days/yr
- Unhealthy air days in 30 yrs
- 7 days/yr
Risk factors via First Street. Map © Google.
Why this score? — see what drove the B- grade
The composite is a weighted blend of 9 inputs, each scored 0–100. Each bar is that input's sub-score; the figure is the points it added to the 100-point composite (weight × sub-score).
- Cash flow +25.7/30.0
- ARV discount +15.0/15.0
- DSCR +8.6/10.0
- 1% rule +8.0/10.0
- Livability +3.9/5.0
- Rent growth +2.5/5.0
- Condition / age +2.5/5.0
- Schools +1.4/10.0
- Appreciation +0.0/10.0
$180,500
🖨 Deal sheet 📄 Offer letter ✓ Due diligence
Listing remarks
Located in highly sought after western Bellwood, this spacious octagon bungalow offers an expansive layout that blends character and charm effortlessly. As you walk into the home you will fall in love with the hardwood floors which run throughout the home and the natural light which shines through the octagon living room! The home has a great layout with 4 bedrooms of which two of them are on the main level with the other two bedrooms in the finished second level with a half bath on the second level! The added benefit of this home is the space the unfinished basement offers, finishing the basement will add additional space, another bedroom or home office while adding value! The home offers
Key facts
- 2 parking spots
- Built 1928
- Listed 34 days
Property features AI
Finance
- Other: Age estimated 91–100 years
- HOA & community: No master association fee required
Exterior
- Parking: 2 total parking spaces
- Utilities: Water from Lake Michigan; Public sewer
- Home design: Detached single-family home; 1.5-story design; Fee simple ownership; Built before 1978
- Construction: Brick construction
- Exterior features: Lot smaller than 0.25 acre; Lot dimensions: 0123
Interior
- Kitchen: Kitchen (12 x 14)
- Bedrooms: 4 bedrooms (Master on main; additional bedrooms on main and second levels); Bedroom — 12 x 14 (main); Bedroom — 12 x 10 (master, main); Bedroom — 11 x 10 (second); Bedroom — 10 x 11 (second)
- Flooring: Hardwood flooring in living room and dining room
- Bathrooms: 1 full bathroom; 1 half bathroom
- Heating & cooling: Forced air heating
- Interior features: 7 total rooms; Unfinished full basement
- Laundry & utility: Laundry room
Neighborhood map
What this means for you Summary
Snapshot
- This is a 3-bed/1.5-bath single-family listed at $180k.
Deal economics
- At list price, monthly cash flow is $434 ($5k/yr) — positive.
- The deal already cash-flows at list — no discount required.
- Meets the 1% rule at list price ($2k rent vs $180k).
- Recommended offer: $175k (3.0% below list) — sets the bar for market timing.
- Cap rate 9.2% vs local median 5.3% in Bellwood — top-decile yield for the area; either an underpriced asset or a hidden risk that comps aren't pricing in. Stress-test before assuming the spread holds.
Location & tenants
- Location reads 77/100 on livability (#155 in IL, #2,847 nationally) — a middle-class / working-renter tenant base. Strengths: commute A+, cost of living A+, housing A+; Watch: health & safety D+, schools F, amenities F.
- Proviso Twp Hsd 209 (suburban): math 12% / reading 17% proficiency, ranked #507 of 620 in IL (top 82%) — low school quality limits family demand, transient renter base, plan for 1-2y turnover.
- Market conditions: 41 active listings in the ZIP; 17 comparable units currently listed for rent nearby; rentals leasing fast (median 13d on market — plan ~1-2 weeks tenant-placement turnaround); 6,272 units permitted in Cook County in 2024 (4,658 in 5+ unit buildings).
Forward outlook
- Local home prices are declining (-3.0%/yr); year-one equity from $1k of loan paydown is wiped out by about $5k of value loss. Plan a longer hold.
Negotiation context
- It's been on market 34 days — a 3% lower offer ($175k) is reasonable based on typical stale-listing flexibility.
- Current owner paid $21k; list at $180k implies a 762% gain — meaningful room to come down on a strong offer.
Risks & watch-outs
- Watch-outs: property tax is 2.6% of price; built in 1928 — expect roof / HVAC / electrical / plumbing capex.
Questions for the listing agent
- It's been on market 34 days. Have you received any prior offers? Is the seller open to a 3% concession, seller financing, or rate buy-down credit?
- Built in 1928 — when were the roof, HVAC, electrical panel, plumbing, and water heater last replaced?
- Property tax is high relative to price — has the assessment been appealed recently, and will the sale trigger a re-assessment?
- Is there a deadline driving the sale (1031 exchange, divorce, estate, relocation)? That informs how much negotiation room exists.
- Schools are F-rated, which usually means shorter tenancies and higher turnover. Who's the typical renter profile here, and what's been the actual vacancy rate?
- What's the average days-on-market for RENTAL listings here right now (not sales)? A rising rental-DOM trend means longer vacancies and softer asking-rent achievability than the comps imply.
- What's the recent tenant-quality profile in this submarket — average credit score on applications, eviction rate, late-payment / NSF rate, and stable-employment percentage? A property-management company in the area should have these aggregated.
- How much new for-sale + rental construction is in the pipeline within 1–3 miles? Heavy new supply typically softens prices + rents 12–24 months out; constrained supply supports both.
Investment metrics
- 1% rule
- 1.30% ✓
- Cap rate
- 9.18%
- Cash-on-cash
- 10.30%
- DSCR
- 1.46
- GRM
- 6.4
CMA / ARV
- ARV (on-the-fly)
- $275,462
- Comps found
- 12
Show comp detail 12 sales within ~0.75 mi
| Address | Dist | Beds/Ba | Sqft | Sold | Price | $/sf | Match |
|---|---|---|---|---|---|---|---|
| 1433 S 21st Ave | 0.09mi | 3/2.0 | 1,226 (-7%) | 1mo | $290,000 | $237 | 81 |
| 1615 S 20th Ave | 0.17mi | 2/2.0 (-1) | 1,260 (-4%) | 3mo | $263,000 | $209 | 75 |
| 1925 S 22nd Ave | 0.36mi | 3/2.0 | 1,260 (-4%) | 2mo | $345,000 | $274 | 72 |
| 1911 S 18th Ave | 0.43mi | 4/1.0 (+1) | 1,340 (+2%) | 1mo | $130,000 | $97 | 69 |
| 2111 S 24th Ave | 0.59mi | 3/2.0 | 1,286 (-2%) | 2mo | $300,000 | $233 | 65 |
| 2023 S 23rd Ave | 0.50mi | 3/2.5 | 1,396 (+6%) | 3mo | $324,900 | $233 | 60 |
| 1844 S 13th Ave | 0.63mi | 3/1.5 | 1,404 (+6%) | 1mo | $177,000 | $126 | 59 |
| 820 S 17th Ave | 0.52mi | 3/2.0 | 1,420 (+8%) | 4mo | $290,000 | $204 | 58 |
| 1124 31st Ave | 0.58mi | 4/1.0 (+1) | 1,224 (-7%) | 2mo | $255,000 | $208 | 52 |
| 2003 S 24th Ave | 0.44mi | 3/2.0 | 1,500 (+14%) | 6mo | $300,000 | $200 | 50 |
| 1102 31st Ave | 0.57mi | 3/1.0 | 1,176 (-11%) | 6mo | $149,000 | $127 | 48 |
| 2036 S 15th Ave | 0.67mi | 3/1.0 | 1,153 (-12%) | 1mo | $257,500 | $223 | 45 |
Match score weights: distance 35% · size 25% · config 20% · recency 20%. Top-matched comps best support the ARV.
Projected returns pro-forma
-3.0% appreciation · 3.0% rent growth · sell at horizon
- IRR
- -0.8%
- Equity multiple
- 0.97×
- Total profit
- $-1,475
- Equity at exit
- $26,913
- IRR
- 9.0%
- Equity multiple
- 1.69×
- Total profit
- $34,866
- Equity at exit
- $15,606
Cash invested: $50,540 (down + closing). Projections, not guarantees.
Landlord ↔ Tenant lean methodology
- Overall (STATE)
- 43 Moderately Tenant-Leaning
- State Illinois
- 43 Moderately Tenant-Leaning · D+7
- County
- — inherits STATE
- City
- — inherits STATE
ZIP-level market 60104
- Active inventory
- 41
- Price-to-rent
- 6.4×
Monthly cashflow live
- Estimated rent
- $2,343 high interval (Pro) →
- Mortgage (P&I)
- −$947
- Tax from tax record
- −$395 /mo · $4,746/yr
- Insurance
- −$75
- HOA
- −$0
- Vacancy / Maint / Mgmt
- −$492
- Net cashflow
- $434
Break-even live
UW: 25.0% down · 7.5% · 30yr · 1.5% tax · 5.0% vac · 8.0% maint · 8.0% mgmt
Financing live
Cash to close
- Down payment
- $45,125
- Closing costs
- $5,415
- Reserves months
- —
- Total cash needed
- —
Loan-product check · same deal, 3 products live
Conventional
25% down · 7.5% · 30yr
- Down + closing
- —
- Monthly P&I
- —
- Monthly cashflow
- —
- DSCR
- —
- Eligible?
- —
Personal DTI + credit; lowest rate.
DSCR
20% down · 8.5% · 30yr
- Down + closing
- —
- Monthly P&I
- —
- Monthly cashflow
- —
- DSCR
- —
- Eligible?
- —
No personal income docs; deal must DSCR.
Hard money
10% down · 12.0% · 12mo
- Down + closing
- —
- Monthly P&I
- —
- Monthly cashflow
- —
- DSCR
- —
- Eligible?
- —
Short-term bridge; refi at stabilization.
Rent comps 17 comps
| Address | Beds | Baths | Sqft | Rent | $/sqft | DOM | Units | Dist |
|---|---|---|---|---|---|---|---|---|
| 1814 Warren St Maywood, IL | 3.0 | 1.0 | 1200 | $2,500 | $2.08 | 10d | 1 | 0.54mi |
| 1814 Warren St Unit 2W Maywood, IL | 3.0 | 1.0 | 1200 | $2,500 | $2.08 | 1d | 1 | 0.54mi |
| 723 Manchester Ave Westchester, IL | 3.0 | 2.0 | 1151 | $2,721 | $2.36 | 24d | 1 | 0.58mi |
| 2040 16th Ave Unit 2C Broadview, IL | 2.0 | 1.0 | 900 | $1,595 | $1.77 | 13d | 1 | 0.63mi |
| 624 Norfolk Ave Unit 1237891P Westchester, IL | 3.0 | 2.0 | 1646 | $12,991 | $7.89 | 20d | 1 | 0.65mi |
| 2416 W Roosevelt Rd Apt 1S Broadview, IL | 2.0 | 1.0 | 884 | $1,475 | $1.67 | 24d | 1 | 0.66mi |
| 1104 Rice Ave Bellwood, IL | 2.0 | 1.0 | 995 | $1,725 | $1.73 | 21d | 1 | 0.76mi |
| 1013 Bellwood Ave Unit 2W Bellwood, IL | 2.0 | 1.0 | 925 | $1,850 | $2.00 | 19d | 1 | 0.92mi |
| 218 S 13th Ave Unit 2 Maywood, IL | 2.0 | 1.0 | 1050 | $1,650 | $1.57 | 4d | 1 | 1.01mi |
| 631 Balmoral Ave Westchester, IL | 2.0 | 1.0 | 903 | $2,100 | $2.33 | 24d | 1 | 1.02mi |
| 1610 S 4th Ave Maywood, IL | 3.0 | 2.5 | 1754 | $4,500 | $2.57 | 1d | 1 | 1.15mi |
| 903 S 5th Ave Unit 2D Maywood, IL | 3.0 | 2.0 | 1008 | $2,100 | $2.08 | 1d | 1 | 1.20mi |
| 1215 Balmoral Ave Unit 1 Westchester, IL | 3.0 | 1.5 | 1500 | $2,750 | $1.83 | 24d | 1 | 1.20mi |
| 1215 Balmoral Ave Unit 2 Westchester, IL | 3.0 | 1.5 | 1500 | $2,950 | $1.97 | 15d | 1 | 1.20mi |
| 410 School St Unit 1B Maywood, IL | 3.0 | 2.0 | 1218 | $2,200 | $1.81 | 1d | 1 | 1.21mi |
| 2036 S 1st Ave Maywood, IL | 4.0 | 2.0 | 1363 | $2,750 | $2.02 | 1d | 1 | 1.42mi |
| 422 Granville Ave Hillside, IL | 3.0 | 1.0 | 1194 | $2,571 | $2.15 | 7d | 1 | 1.45mi |
Listing history 12 events
-
2026-06-13statusdays on market $180,500 Pending 34 DOM
-
2026-06-10price $180,500 Active 32 DOM
-
2026-06-09days on market $190,000 Active 32 DOM
-
2026-06-08days on market $190,000 Active 31 DOM
-
2026-06-07days on market $190,000 Active 30 DOM
-
2026-06-04days on market $190,000 Active 27 DOM
-
2026-06-03days on market $190,000 Active 26 DOM
-
2026-06-02days on market $190,000 Active 25 DOM
-
2026-06-01days on market $190,000 Active 24 DOM
-
2026-05-31days on market $190,000 Active 23 DOM
-
2026-05-08$190,000 Active
-
1992-02-04soldstatus $20,942
ⓘ Source: listings_history table (triggers on properties + properties_extension) + one-shot
backfill from property_details.listing_events for pre-trigger history.
Tax reassessment forecast IL · Partial reset (capped growth)
- Current annual tax
- $4,746 · $395/mo
- Projected year-2 tax
- $4,746 · $395/mo
- Expected delta
- $0/yr ($0/mo · 0.0%)
ⓘ Screening estimate from a state-policy table — verify with the county assessor before closing.
Climate risk First Street
- Flood 1/10 Low FEMA zone X (shaded) · 0% chance over 30 yrs
- Wildfire 1/10 Low
- Heat 3/10 Moderate 7 d/yr ≥101°F today · 14 d/yr by 30 yrs out
- Wind 2/10 Low
- Air quality 4/10 Moderate 6 unhealthy d/yr today · 7 by 30 yrs out
Nearby sold comps map
Loading sold comps map…
Walkable amenities ~0.75 mi
Loading nearby amenities…
Taxation est. · year 1
- Rental income
- $28,118
- − Mortgage interest
- −$10,111
- − Property taxes
- −$4,746
- − Insurance
- −$902
- − Repairs & maintenance
- −$2,249
- − Management
- −$2,249
- − Depreciation
- −$5,251
- Taxable income
- $2,609
- Est. tax owed @ 24.0%
- −$626
- After-tax cash flow
- $4,580/yr
For passive investors: Depreciation is non-cash, so a rental often shows a tax loss while cash-flowing — sheltering income. Rental losses are passive: they offset passive income freely, and up to $25,000/yr can offset ordinary (W-2) income if you actively participate and your MAGI is under $100k (phasing out to $0 by $150k); unused losses carry forward. On sale, claimed depreciation is recaptured at up to 25%, and gains may owe capital-gains tax (a 1031 exchange can defer both). Figures are a year-1 estimate at your 24.0% rate — not tax advice; consult a CPA.
Schools (NCES district)
- District
- Proviso Twp Hsd 209
- NCES district ID
- 1732910
- Math proficiency
- 12% ▼ -4.00%
- Reading proficiency
- 17% ▼ -3.00%
- Median HH income
- $51,744
- Composite
- 13.5/100
- National rank
- #9518
- State rank
- #507 of 620 in IL
Livability — Bellwood
- Score
- 77/100
- State rank
- #155
- US rank
- #2847
Category grades
Schools grade is shown separately in the Schools card above.
Census & demographics
- Census place
- Bellwood, IL
- City population
- 18,390
- Population (ZIP)
- 18,390
Population outlook (Cook County) Hauer SSP2
- Today (2025)
- 5,347,519 people
- By 2030
- 5,357,703 · +0.2%
- By 2040
- 5,324,924 · -0.4%
- By 2050
- 5,230,762 · -2.2%
- By 2075
- 4,785,735 · -10.5%
- By 2100
- 4,188,836 · -21.7%
Race, ethnicity, and origin ACS 2023
- Neighborhood character
- Predominantly Black (70%)
- Race & ethnicity
- Black 70% Hispanic / Latino 23% Two or more races 7% White 4% Asian 1%
- Hispanic origin (detail)
- Mexican 18% Puerto Rican 4%
- Common ancestry
- Romanian 1%
- Foreign-born
- 10% · Canada
- Languages at home
- 78% English-only · Spanish 20% Other Indo-European 1%
Political lean MEDSL · Cook
- 2024 margin
- Solid D (+42.0) · D 70.4% · R 28.4% · Other 1.2%
- 2008→2024 swing
- -11.4pp toward R · 2008: 53.4pp · 2024: 42.0pp
- All cycles
- 2024: D+42.0 2020: D+50.3 2016: D+53.0 2012: D+49.4 2008: D+53.4
Not yet ingested
- Civics
- —
Market trends
- HPI YoY
- ▼ -212.49%
- Current HPI
- 290.8215
- Rent YoY
- —
- Metro
- —
- State GDP YoY
- ▲ 1.59%
- F500 in state
- 60
Industry mix (Fortune 500 HQ in IL)
| Industry | F500 HQs | Revenue |
|---|---|---|
| Insurance | 4 | $201B |
|
||
| Consumer Goods | 4 | $87B |
|
||
| Industrial Machinery | 3 | $64B |
|
||
| Healthcare | 2 | $55B |
|
||
| Retail / Pharmacy | 1 | $148B |
|
||
| Agriculture / Food | 1 | $86B |
|
||
Price history
+807.3% since first listed2 events — show timeline
- 2026-05-08 Listed $190,000 MRED as Distributed by MLS Grid
- 1992-02-04 Sold (Public Records) $20,942 Public Records
Property tax history
+1.5%/yrLatest (2023): $4,746 · -16.5% YoY. Source: county tax records.
Cash-flow waterfall
monthlySold comps — $/sqft
last 12 mo · ≤1 miLoading sold comps…