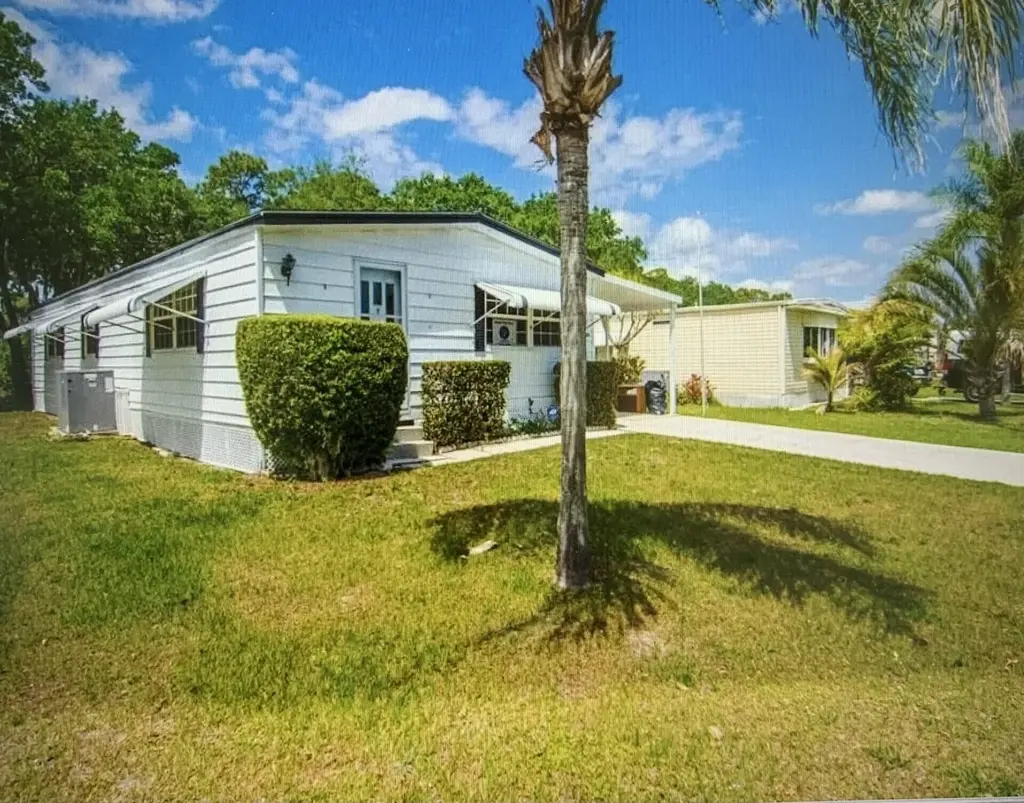
139 Camino Del Rio · River Park, FL
Flood risk 3/10 · Minor
- FEMA flood zone
- X (unshaded)
- Chance of flooding over 30 yrs
- 0.12%
- Est. flood insurance / yr
- $507 – $1,088
Fire risk 3/10 · Minor
- Est. fire insurance / yr
- $947 – $1,759
Heat risk 10/10 · Severe
- Hot days now (above 106°F)
- 7 days/yr
- Hot days in 30 yrs
- 23 days/yr
Wind risk 10/10 · Severe
- Chance of severe wind over 30 yrs
- 99.0%
Air-quality risk 2/10 · Minimal
- Unhealthy air days now
- 1 days/yr
- Unhealthy air days in 30 yrs
- 1 days/yr
Risk factors via First Street. Map © Google.
Why this score? — see what drove the B+ grade
The composite is a weighted blend of 9 inputs, each scored 0–100. Each bar is that input's sub-score; the figure is the points it added to the 100-point composite (weight × sub-score).
- Cash flow +30.0/30.0
- ARV discount +15.0/15.0
- 1% rule +10.0/10.0
- DSCR +10.0/10.0
- Condition / age +3.8/5.0
- Schools +3.7/10.0
- Livability +3.5/5.0
- Rent growth +3.0/5.0
- Appreciation +0.0/10.0
$74,500
🖨 Deal sheet 📄 Offer letter ✓ Due diligence
Listing remarks
Retirement living at its best! This move-in ready 3-bedroom, 2-bath home features laminate flooring throughout and is fully furnished. The A/C and water heater are in excellent condition and regularly serviced. The shingle roof, 18 years old, is in great shape, and all ductwork was replaced in 2025. Owned by a master craftsman, the home was maintained meticulously and includes thoughtful features like an emergency power outlet. Located on the St. Lucie River in a 55+ community, this property is ready for you to make it your new home.
Key facts
- Laminate flooring
- St. lucie river
- Parking
Tags
Property features AI
Finance
- Other: Pets not allowed
- Financial info: Monthly land lease payment (land lease in effect; expires 2027-06-30)
- HOA & community: Located in a senior community; Monthly land lease
Exterior
- Parking: Attached covered carport (1 space); Open parking space
- Security: Smoke detectors; Security patrol
- Utilities: Public water; Public sewer; Sewer and water available
- Home design: Manufactured home; Single-story; Faces east; Resale condition
- Construction: Vinyl siding; Modular construction; Composition/shingle roof; Skirt: other; Mobile dimensions approximately 60' x 24'
- Exterior features: Open patio; Patio; Shed(s); Many trees; Paved road frontage; Waterfront
Interior
- Kitchen: Electric range; Dishwasher; Microwave; Refrigerator; Electric water heater
- Bedrooms: Three bedrooms on the main level
- Flooring: Laminate flooring
- Bathrooms: Two full bathrooms on the main level
- Heating & cooling: Central electric heating; Central air conditioning; Ceiling fans
- Interior features: Bedroom layout with stacked beds; Furnished; Decorative fireplace; Blinds and drapes
Neighborhood map
What this means for you Summary
Snapshot
- This is a 3-bed/2.0-bath manufactured listed at $74k. Condition is rated good.
Deal economics
- At list price, monthly cash flow is $1k ($15k/yr) — positive.
- The deal already cash-flows at list — no discount required.
- Meets the 1% rule at list price ($2k rent vs $74k).
- Recommended offer: $72k (3.0% below list) — sets the bar for market timing.
- Cap rate 26.4% vs local median 6.3% in River Park — top-decile yield for the area; either an underpriced asset or a hidden risk that comps aren't pricing in. Stress-test before assuming the spread holds.
Location & tenants
- Location reads 69/100 on livability (#451 in FL) — a middle-class / working-renter tenant base. Strengths: cost of living A+, housing A+, commute A-; Watch: schools F, amenities F, employment F.
- St. Lucie (urban): math 40% / reading 48% proficiency, ranked #51 of 73 in FL (top 70%) — families likely to look elsewhere, expect single-tenant / working-renter base with shorter leases.
- Market conditions: Rents rising (+1.9%/yr); 639 active listings in the ZIP; 18 comparable units currently listed for rent nearby; rentals at typical pace (median 24d on market — plan ~3-4 weeks tenant-placement turnaround); 4,868 units permitted in St. Lucie County in 2024 (268 in 5+ unit buildings).
- This rent runs 43% of the median local income ($62k/yr) — at the standard rent-burdened threshold; future hikes will face affordability resistance.
Forward outlook
- Local home prices are declining (-3.0%/yr); year-one equity from $515 of loan paydown is wiped out by about $2k of value loss. Plan a longer hold.
- St. Lucie County population projected at +20% by 2050 — long-run rental-demand tailwind backs the buy-and-hold thesis.
- At projected returns (-3.0% appreciation + 1.9% rent growth), your $21k cash investment doubles in ~2 years — after that, you're playing with house money.
Negotiation context
- It's been on market 54 days — a 3% lower offer ($72k) is reasonable based on typical stale-listing flexibility.
- 2 sale attempts; this cycle's ask has dropped $11k (13%) from the opening price — seller is motivated, your offer sets the floor, not the list.
Risks & watch-outs
- Climate carrying-cost: severe wind risk, 99% chance of damaging wind over 30y; extreme-heat days projected 7→23/yr by 2055 (HVAC capex compounding) — expect insurance premiums to compound above CPI over the hold.
Questions for the listing agent
- It's been on market 54 days. Have you received any prior offers? Is the seller open to a 3% concession, seller financing, or rate buy-down credit?
- Built in 1978 — when were the roof, HVAC, electrical panel, plumbing, and water heater last replaced?
- Is there a deadline driving the sale (1031 exchange, divorce, estate, relocation)? That informs how much negotiation room exists.
- Schools are F-rated, which usually means shorter tenancies and higher turnover. Who's the typical renter profile here, and what's been the actual vacancy rate?
- What's the average days-on-market for RENTAL listings here right now (not sales)? A rising rental-DOM trend means longer vacancies and softer asking-rent achievability than the comps imply.
- What's the recent tenant-quality profile in this submarket — average credit score on applications, eviction rate, late-payment / NSF rate, and stable-employment percentage? A property-management company in the area should have these aggregated.
- How much new for-sale + rental construction is in the pipeline within 1–3 miles? Heavy new supply typically softens prices + rents 12–24 months out; constrained supply supports both.
Investment metrics
- 1% rule
- 2.99% ✓
- Cap rate
- 26.38%
- Cash-on-cash
- 71.72%
- DSCR
- 4.19
- GRM
- 2.8
CMA / ARV
- ARV (on-the-fly)
- $146,880
- Comps found
- 7
Show comp detail 7 sales within ~0.75 mi
| Address | Dist | Beds/Ba | Sqft | Sold | Price | $/sf | Match |
|---|---|---|---|---|---|---|---|
| 38 Alta Loma | 0.47mi | 2/2.0 (-1) | 1,433 (-0%) | 5mo | $180,000 | $126 | 68 |
| 5 Yolanda Ln | 0.09mi | 2/2.0 (-1) | 1,280 (-11%) | 5mo | $39,000 | $30 | 68 |
| 8 S Alhambra Ln | 0.53mi | 3/2.0 | 1,400 (-3%) | 14mo | $100,000 | $71 | 59 |
| 2 Quintana Roo Ln | 0.31mi | 2/2.0 (-1) | 1,350 (-6%) | 21mo | $32,000 | $24 | 53 |
| 8580 Mary Ann Ln | 0.75mi | 2/2.0 (-1) | 1,471 (+2%) | 5mo | $175,000 | $119 | 52 |
| 501 La Buona Vita Dr | 0.68mi | 2/2.0 (-1) | 1,289 (-10%) | 9mo | $132,000 | $102 | 38 |
| 560 Natalie Dr | 0.54mi | 2/2.0 (-1) | 1,248 (-13%) | 18mo | $162,800 | $130 | 32 |
Match score weights: distance 35% · size 25% · config 20% · recency 20%. Top-matched comps best support the ARV.
Projected returns pro-forma
-3.0% appreciation · 1.92% rent growth · sell at horizon
- IRR
- 70.2%
- Equity multiple
- 4.11×
- Total profit
- $64,971
- Equity at exit
- $11,108
- IRR
- 73.8%
- Equity multiple
- 8.16×
- Total profit
- $149,336
- Equity at exit
- $6,441
Cash invested: $20,860 (down + closing). Projections, not guarantees.
Landlord ↔ Tenant lean methodology
- Overall (STATE)
- 87 Strongly Landlord-Friendly
- State Florida
- 87 Strongly Landlord-Friendly · R+3
- County
- — inherits STATE
- City
- — inherits STATE
ZIP-level market 34952
- Home prices YoY
- -29.6%
- Rents YoY
- 1.9%
- Active inventory
- 639
- Price-to-rent
- 2.8×
Monthly cashflow live
- Estimated rent
- $2,230 high interval (Pro) →
- Mortgage (P&I)
- −$391
- Tax est. 1.5%
- −$93 /mo · $1,118/yr
- Insurance
- −$31
- HOA
- −$0
- Vacancy / Maint / Mgmt
- −$468
- Net cashflow
- $1,247
Break-even live
UW: 25.0% down · 7.5% · 30yr · 1.5% tax · 5.0% vac · 8.0% maint · 8.0% mgmt
Financing live
Cash to close
- Down payment
- $18,625
- Closing costs
- $2,235
- Reserves months
- —
- Total cash needed
- —
Loan-product check · same deal, 3 products live
Conventional
25% down · 7.5% · 30yr
- Down + closing
- —
- Monthly P&I
- —
- Monthly cashflow
- —
- DSCR
- —
- Eligible?
- —
Personal DTI + credit; lowest rate.
DSCR
20% down · 8.5% · 30yr
- Down + closing
- —
- Monthly P&I
- —
- Monthly cashflow
- —
- DSCR
- —
- Eligible?
- —
No personal income docs; deal must DSCR.
Hard money
10% down · 12.0% · 12mo
- Down + closing
- —
- Monthly P&I
- —
- Monthly cashflow
- —
- DSCR
- —
- Eligible?
- —
Short-term bridge; refi at stabilization.
Rent comps 18 comps
| Address | Beds | Baths | Sqft | Rent | $/sqft | DOM | Units | Dist |
|---|---|---|---|---|---|---|---|---|
| 730 SE White Ave Port Saint Lucie, FL | 2.0 | 2.0 | 1386 | $10,000 | $7.22 | 23d | 1 | 0.68mi |
| 124 E Arbor Ave Port Saint Lucie, FL | 3.0 | 1.0 | 964 | $2,550 | $2.65 | 14d | 1 | 0.76mi |
| 805 SE Cavern Ave Port Saint Lucie, FL | 3.0 | 2.0 | 1732 | $2,500 | $1.44 | 23d | 1 | 0.87mi |
| 7700 Pine Lakes Blvd Port Saint Lucie, FL | 1.0–3.0 | 1.0–2.0 | 1022 | $2,212 | $2.16 | 14d | 16 | 0.90mi |
| 400 NW Prima Vista Blvd Port St Lucie, FL | 2.0 | 2.0 | 1566 | $2,300 | $1.47 | 23d | 1 | 0.97mi |
| 326 Shady Ln Port Saint Lucie, FL | 3.0 | 2.0 | 1030 | $2,250 | $2.18 | 23d | 1 | 1.02mi |
| 336 SE Tranquilla Ave Port Saint Lucie, FL | 3.0 | 3.0 | 1412 | $2,700 | $1.91 | 14d | 1 | 1.04mi |
| 14 Lake Vista Trl #101 Port Saint Lucie, FL | 2.0 | 2.0 | 1170 | $2,200 | $1.88 | 23d | 1 | 1.15mi |
| 11 Lake Vista Trl #206 Port Saint Lucie, FL | 2.0 | 2.0 | 1080 | $1,400 | $1.30 | 23d | 1 | 1.17mi |
| 4 Lake Vista Trl #202 Port Saint Lucie, FL | 2.0 | 2.0 | 1080 | $1,700 | $1.57 | 21d | 1 | 1.17mi |
| 650 SE Evergreen Ter Port Saint Lucie, FL | 2.0 | 2.0 | 974 | $2,095 | $2.15 | 14d | 1 | 1.19mi |
| 1900 Bella Vista Way Port Saint Lucie, FL | 1.0–2.0 | 1.0–2.0 | 995 | $1,764 | $1.77 | 14d | 15 | 1.20mi |
| 2 Lake Vista Trl #107 Port Saint Lucie, FL | 2.0 | 2.0 | 1170 | $1,850 | $1.58 | 23d | 1 | 1.22mi |
| 26 Lake Vista Trl #201 Port Saint Lucie, FL | 2.0 | 2.0 | 1170 | $1,500 | $1.28 | 23d | 1 | 1.23mi |
| 1 Lake Vista Trl #201 Port Saint Lucie, FL | 2.0 | 2.0 | 1170 | $1,800 | $1.54 | 23d | 1 | 1.26mi |
| 201 NE Midfield Ln Port Saint Lucie, FL | 2.0 | 2.0 | 1389 | $2,500 | $1.80 | 23d | 1 | 1.34mi |
| 213 NE Prima Vista Blvd Port Saint Lucie, FL | 2.0 | 1.0 | 1012 | $2,000 | $1.98 | 23d | 1 | 1.34mi |
| 107 SE Lucero Dr Port Saint Lucie, FL | 3.0 | 2.0 | 1326 | $2,150 | $1.62 | 21d | 1 | 1.49mi |
Listing history 22 events
-
2026-06-18days on market $74,500 Active 54 DOM
-
2026-06-17days on market $74,500 Active 53 DOM
-
2026-06-16days on market $74,500 Active 52 DOM
-
2026-06-15days on market $74,500 Active 51 DOM
-
2026-06-14days on market $74,500 Active 49 DOM
-
2026-06-13days on market $74,500 Active 48 DOM
-
2026-06-10days on market $74,500 Active 46 DOM
-
2026-06-09days on market $74,500 Active 45 DOM
-
2026-06-08days on market $74,500 Active 44 DOM
-
2026-06-07pricedays on market $74,500 Active 43 DOM
-
2026-06-05days on market $85,500 Active 40 DOM
-
2026-06-03days on market $85,500 Active 39 DOM
-
2026-06-02days on market $85,500 Active 38 DOM
-
2026-06-01days on market $85,500 Active 37 DOM
-
2026-05-31days on market $85,500 Active 36 DOM
-
2026-05-30days on market $85,500 Active 35 DOM
-
2026-04-24$85,500 Active
-
2026-04-20historical
-
2026-01-27price $89,000
-
2025-11-05price $99,000
-
2025-05-07price $115,000
-
2025-04-08$118,000 Active
ⓘ Source: listings_history table (triggers on properties + properties_extension) + one-shot
backfill from property_details.listing_events for pre-trigger history.
Climate risk First Street
- Flood 3/10 Moderate FEMA zone X (unshaded) · 12% chance over 30 yrs
- Wildfire 3/10 Moderate
- Heat 10/10 Extreme 7 d/yr ≥106°F today · 23 d/yr by 30 yrs out
- Wind 10/10 Extreme 99% chance of damaging wind over 30 yrs
- Air quality 2/10 Low 1 unhealthy d/yr today · 1 by 30 yrs out
Nearby sold comps map
Loading sold comps map…
Walkable amenities ~0.75 mi
Loading nearby amenities…
Taxation est. · year 1
- Rental income
- $26,759
- − Mortgage interest
- −$4,173
- − Property taxes
- −$1,118
- − Insurance
- −$372
- − Repairs & maintenance
- −$2,141
- − Management
- −$2,141
- − Depreciation
- −$2,167
- Taxable income
- $14,647
- Est. tax owed @ 24.0%
- −$3,515
- After-tax cash flow
- $11,446/yr
For passive investors: Depreciation is non-cash, so a rental often shows a tax loss while cash-flowing — sheltering income. Rental losses are passive: they offset passive income freely, and up to $25,000/yr can offset ordinary (W-2) income if you actively participate and your MAGI is under $100k (phasing out to $0 by $150k); unused losses carry forward. On sale, claimed depreciation is recaptured at up to 25%, and gains may owe capital-gains tax (a 1031 exchange can defer both). Figures are a year-1 estimate at your 24.0% rate — not tax advice; consult a CPA.
Condition & rehab AI · 6 photos
This move-in ready 3-bedroom, 2-bath home features laminate flooring throughout and is fully furnished. The property is in good condition with minor updates needed to the kitchen and landscaping to maximize its value.
Repairs flagged
- Minor kitchen cabinets — dated design
- Minor kitchen countertops — laminate material
Value-add opportunities
- Both new kitchen cabinets and countertops — modernizing the kitchen would appeal to both buyers and renters
- Both landscaping improvements — enhancing the curb appeal would attract more interest
Renovation cost estimate screening
| Repair item | Severity | Est. cost |
|---|---|---|
| kitchen cabinets · dated design | Minor | $500–3,000 |
| kitchen countertops · laminate material | Minor | $500–3,000 |
| Total estimated repair cost · 2 items | $1,000–6,000 |
Value-add ROI direction
- Both new kitchen cabinets and countertops — modernizing the kitchen would appeal to both buyers and renters ↑
- Both landscaping improvements — enhancing the curb appeal would attract more interest ↑
ⓘ Cost ranges are severity-bucket heuristics (US national rule-of-thumb). Get contractor quotes + a written scope before underwriting a rehab budget.
Schools (NCES district)
- District
- St. Lucie
- NCES district ID
- 1201770
- Math proficiency
- 40% ▼ -11.00%
- Reading proficiency
- 48% ▼ -4.00%
- Median HH income
- $44,737
- Composite
- 37.28/100
- National rank
- #4449
- State rank
- #51 of 73 in FL
Livability — River Park
- Score
- 69/100
- State rank
- #451
- US rank
- #8159
Category grades
Schools grade is shown separately in the Schools card above.
Census & demographics
- Census place
- River Park, FL
- County
- Saint Lucie County · 337,150 people
- City population
- 221,051
- Metro
- Port St. Lucie, FL
- Population (ZIP)
- 42,655
- Household income
- $61,628
- Rent vs Own
- Severe rent burden
- 1759.0
Population outlook (St. Lucie County) Hauer SSP2
- Today (2025)
- 338,016 people
- By 2030
- 355,687 · +5.2%
- By 2040
- 385,521 · +14.1%
- By 2050
- 406,106 · +20.1%
- By 2075
- 441,054 · +30.5%
- By 2100
- 436,885 · +29.2%
Race, ethnicity, and origin ACS 2023
- Neighborhood character
- Diverse neighborhood (Simpson 0.57)
- Race & ethnicity
- White 62% Hispanic / Latino 19% Two or more races 14% Black 10% Asian 3%
- Hispanic origin (detail)
- Mexican 4% Puerto Rican 4% Cuban 2% Dominican 2%
- Common ancestry
- Romanian 3% Lithuanian 2% Hispanic 1%
- Foreign-born
- 18% · Canada, Jamaica, China
- Languages at home
- 76% English-only · Spanish 16% French/Haitian/Cajun 3% Tagalog/Filipino 2%
Political lean MEDSL · St. Lucie
- 2024 margin
- Lean R (+9.1) · D 45.1% · R 54.2%
- 2008→2024 swing
- -21.2pp toward R · 2008: 12.1pp · 2024: -9.1pp
- All cycles
- 2024: R+9.1 2020: R+1.6 2016: R+2.5 2012: D+7.9 2008: D+12.1
Not yet ingested
- Civics
- —
Market trends
- HPI YoY
- ▼ -155.80%
- Current HPI
- 371.0573
- Rent YoY
- ▲ 1.92%
- Metro
- Port St. Lucie, FL
- State GDP YoY
- ▲ 3.28%
- F500 in state
- 36
Industry mix (Fortune 500 HQ in FL)
| Industry | F500 HQs | Revenue |
|---|---|---|
| Industrial Technology | 2 | $29B |
|
||
| Insurance | 2 | $17B |
|
||
| Retail | 1 | $60B |
|
||
| Technology Distribution | 1 | $58B |
|
||
| Homebuilding | 1 | $35B |
|
||
| Technology Manufacturing | 1 | $35B |
|
||
Price history
-27.5% since first listed6 events — show timeline
- 2026-04-24 Listed $85,500 Beaches MLS
- 2026-04-20 Listing Removed — Beaches MLS
- 2026-01-27 Price Changed $89,000 Beaches MLS
- 2025-11-05 Price Changed $99,000 Beaches MLS
- 2025-05-07 Price Changed $115,000 Beaches MLS
- 2025-04-08 Listed $118,000 Beaches MLS
Cash-flow waterfall
monthlySold comps — $/sqft
last 12 mo · ≤1 miLoading sold comps…