 Multi-family
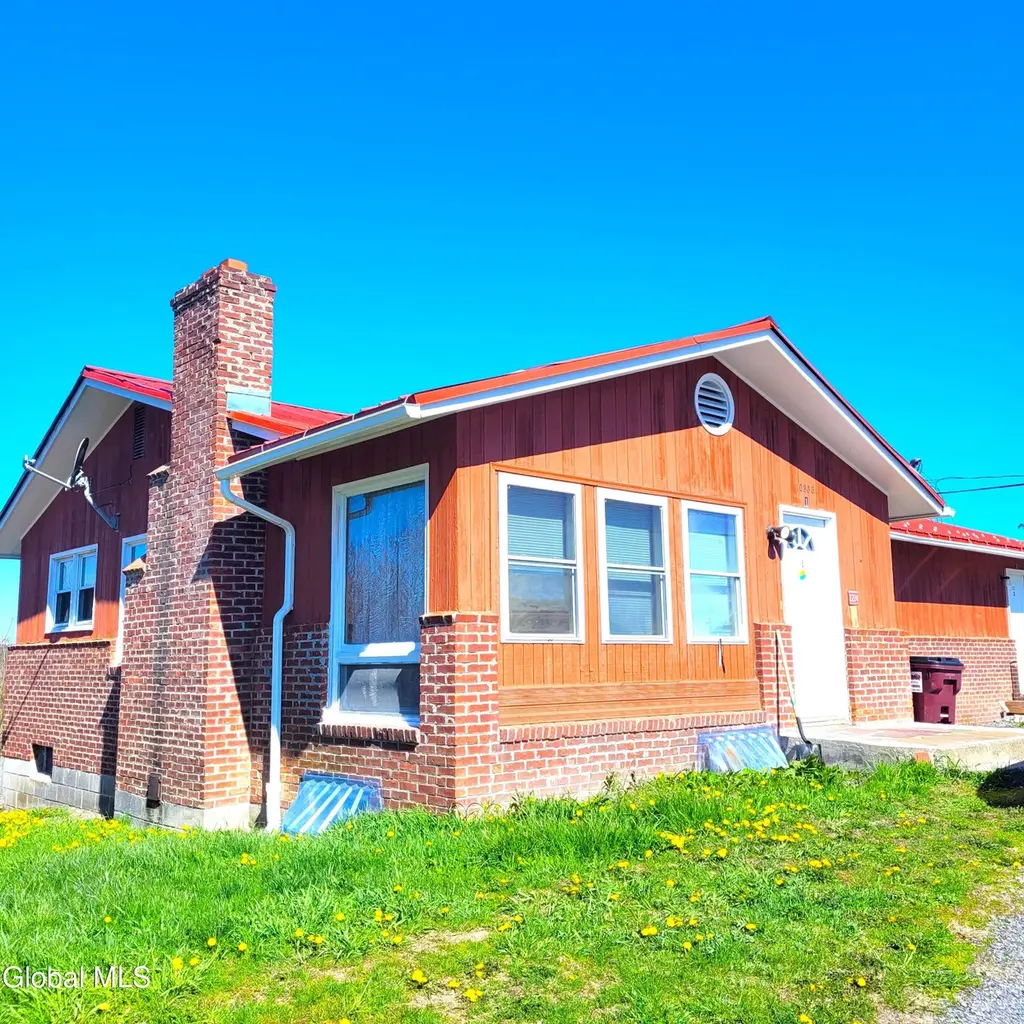
10803 New York 32 · Greenville, NY
Flood risk 1/10 · Minimal
- FEMA flood zone
- X (unshaded)
- Chance of flooding over 30 yrs
- 0.0%
- Est. flood insurance / yr
- $473 – $860
Fire risk 4/10 · Minor
- Est. fire insurance / yr
- $691 – $1,283
Heat risk 3/10 · Minor
- Hot days now (above 95°F)
- 7 days/yr
- Hot days in 30 yrs
- 16 days/yr
Wind risk 3/10 · Minor
- Chance of severe wind over 30 yrs
- 6.0%
Air-quality risk 2/10 · Minimal
- Unhealthy air days now
- 0 days/yr
- Unhealthy air days in 30 yrs
- 1 days/yr
Risk factors via First Street. Map © Google.
Why this score? — see what drove the C grade
The composite is a weighted blend of 9 inputs, each scored 0–100. Each bar is that input's sub-score; the figure is the points it added to the 100-point composite (weight × sub-score).
- Cash flow +19.2/30.0
- Appreciation +10.0/10.0
- ARV discount +7.5/15.0
- DSCR +6.0/10.0
- Schools +4.5/10.0
- 1% rule +4.4/10.0
- Livability +3.2/5.0
- Rent growth +2.5/5.0
- Condition / age +2.5/5.0
$499,999
🖨 Deal sheet 📄 Offer letter ✓ Due diligence
Multi-family units
County records classify this as Multi-Family (2-4 Unit). Listing-text estimate: 1 unit. estimate disagrees with records
Listing remarks MLS
This versatile income-producing property offers a rare opportunity to own a well-maintained multi-family compound set on 3.5 scenic acres just minutes from the heart of Greenville. The property features 3-4 residential apartments, ideal for steady rental income or a mix of owner-occupied and investment use. Adding to its appeal is a separate commercial building, currently leased and operating as a clothing retail space, providing an additional stream of income from an established tenant. The expansive lot offers plenty of room for outdoor enjoyment or added amenities. Perfectly positioned for convenience and lifestyle, this property is just moments from local shopping, dining, and everyday essentials. Enjoy the unique charm of being within walking distance to the nostalgic Hi-Way Drive-In Theatre as well as nearby restaurant, making it an attractive location for both tenants and visitors. Whether you're an investor seeking strong cash flow or an owner looking for a property with multiple revenue streams, this offering combines location, versatility, and long-term potential.
Key facts
- 3.5 acre lot
- 10 parking spots
- Built 1970
Neighborhood map
What this means for you Summary
Snapshot
- This is a 5-bed/3.0-bath multifamily listed at $500k.
Deal economics
- At list price, monthly cash flow is $537 ($6k/yr) — positive.
- The deal already cash-flows at list — no discount required.
- To meet the 1% rule (rent ≥ 1% of price), the offer needs to be $470k (6.0% below list).
- Recommended offer: $470k (6.0% below list) — sets the bar for 1% rule.
- Cap rate 7.6% vs local median 3.1% in Greenville — top-decile yield for the area; either an underpriced asset or a hidden risk that comps aren't pricing in. Stress-test before assuming the spread holds.
Location & tenants
- Location reads 65/100 on livability (#713 in NY) — a middle-class / working-renter tenant base. Strengths: crime A+, employment A+, schools B+; Watch: amenities F, commute F, cost of living F.
- Greenville Central School District (rural): math 48% / reading 55% proficiency, ranked #338 of 590 in NY (top 57%) — acceptable for families but not a draw, mixed tenant base, ~2y average lease.
- Market conditions: 32 active listings in the ZIP; 97 units permitted in Greene County in 2024 (0 in 5+ unit buildings).
Forward outlook
- In year one you build about $53k of equity ($3k loan paydown + $50k appreciation (10.0% local appreciation)).
- Greene County population projected at -22% by 2050 — secular population decline; favor cash flow + early exit over multi-decade hold.
- At projected returns (10.0% appreciation + 3.0% rent growth), your $140k cash investment doubles in ~3 years — after that, you're playing with house money.
- By year 2, paydown + projected appreciation supports a ~$86k cash-out refi (75% LTV) — recoverable capital for the next deal without selling this one.
Negotiation context
- It's been on market 44 days — a 3% lower offer ($485k) is reasonable based on typical stale-listing flexibility.
- 3 sale attempts since 6y ago with the ask held roughly flat each time — persistent listings suggest the price (not the market) is what's stuck; bring a comps-based counter.
Questions for the listing agent
- It's been on market 44 days. Have you received any prior offers? Is the seller open to a 6% concession, seller financing, or rate buy-down credit?
- Built in 1970 — when were the roof, HVAC, electrical panel, plumbing, and water heater last replaced?
- Is there a deadline driving the sale (1031 exchange, divorce, estate, relocation)? That informs how much negotiation room exists.
- Schools are B-rated — typically a magnet for longer-tenancy family renters. What's the average tenant stay here, and is there a school-zone premium baked into asking?
- What's the average days-on-market for RENTAL listings here right now (not sales)? A rising rental-DOM trend means longer vacancies and softer asking-rent achievability than the comps imply.
- What's the recent tenant-quality profile in this submarket — average credit score on applications, eviction rate, late-payment / NSF rate, and stable-employment percentage? A property-management company in the area should have these aggregated.
- How much new apartment / multifamily construction is in the pipeline within 1–3 miles? Heavy new supply (>2% of stock underway) typically softens rents 12–24 months out; light construction supports rent growth.
Investment metrics
- 1% rule
- 0.94% ✗
- Cap rate
- 7.58%
- Cash-on-cash
- 4.60%
- DSCR
- 1.20
- GRM
- 8.9
CMA / ARV
- ARV (median comp)
- $224,398
- List price
- $499,999
- Delta
- 122.82%
- Verdict
- OVERPRICED
- Comps
- 1 within 2.0 mi
Projected returns pro-forma
10.0% appreciation · 3.0% rent growth · sell at horizon
- IRR
- 27.6%
- Equity multiple
- 3.19×
- Total profit
- $306,397
- Equity at exit
- $450,439
- IRR
- 24.1%
- Equity multiple
- 7.25×
- Total profit
- $875,204
- Equity at exit
- $971,388
Cash invested: $140,000 (down + closing). Projections, not guarantees.
Landlord ↔ Tenant lean methodology
- Overall (STATE)
- 15 Strongly Tenant-Friendly
- State New York
- 15 Strongly Tenant-Friendly · D+10
- County
- — inherits STATE
- City
- — inherits STATE
ZIP-level market 12083
- Home prices YoY
- 16.0%
- Active inventory
- 32
- Price-to-rent
- 26.6×
Monthly cashflow live
- Estimated rent
- $4,699 medium interval (Pro) →
- Mortgage (P&I)
- −$2,622
- Tax from tax record
- −$345 /mo · $4,141/yr
- Insurance
- −$208
- HOA
- −$0
- Vacancy / Maint / Mgmt
- −$987
- Net cashflow
- $537
Break-even live
3-unit breakdown (identical units grouped — click to expand)
| Units | Beds | Baths | Est. rent |
|---|---|---|---|
| 3× units | 2 | 1 | $4,698 |
| #1 | 2 | 1 | $1,566 |
| #2 | 2 | 1 | $1,566 |
| #3 | 2 | 1 | $1,566 |
| Total (3 units) | $4,699 | ||
UW: 25.0% down · 7.5% · 30yr · 1.5% tax · 5.0% vac · 8.0% maint · 8.0% mgmt
Financing live
Cash to close
- Down payment
- $125,000
- Closing costs
- $15,000
- Reserves months
- —
- Total cash needed
- —
Loan-product check · same deal, 3 products live
Conventional
25% down · 7.5% · 30yr
- Down + closing
- —
- Monthly P&I
- —
- Monthly cashflow
- —
- DSCR
- —
- Eligible?
- —
Personal DTI + credit; lowest rate.
DSCR
20% down · 8.5% · 30yr
- Down + closing
- —
- Monthly P&I
- —
- Monthly cashflow
- —
- DSCR
- —
- Eligible?
- —
No personal income docs; deal must DSCR.
Hard money
10% down · 12.0% · 12mo
- Down + closing
- —
- Monthly P&I
- —
- Monthly cashflow
- —
- DSCR
- —
- Eligible?
- —
Short-term bridge; refi at stabilization.
Listing history 18 events
-
2026-06-18days on market $499,999 Active 44 DOM
-
2026-06-17days on market $499,999 Active 43 DOM
-
2026-06-16days on market $499,999 Active 42 DOM
-
2026-06-15days on market $499,999 Active 41 DOM
-
2026-06-13days on market $499,999 Active 39 DOM
-
2026-06-12days on market $499,999 Active 38 DOM
-
2026-06-09days on market $499,999 Active 35 DOM
-
2026-06-08days on market $499,999 Active 34 DOM
-
2026-06-07days on market $499,999 Active 33 DOM
-
2026-06-07days on market $499,999 Active 32 DOM
-
2026-06-04days on market $499,999 Active 29 DOM
-
2026-06-02days on market $499,999 Active 28 DOM
-
2026-06-01days on market $499,999 Active 27 DOM
-
2026-05-31days on market $499,999 Active 26 DOM
-
2026-05-04$499,999 Active 1091-char remark
Show marketing remark (1090 chars)
This versatile income-producing property offers a rare opportunity to own a well-maintained multi-family compound set on 3.5 scenic acres just minutes from the heart of Greenville. The property features 3-4 residential apartments, ideal for steady rental income or a mix of owner-occupied and investment use. Adding to its appeal is a separate commercial building, currently leased and operating as a clothing retail space, providing an additional stream of income from an established tenant. The expansive lot offers plenty of room for outdoor enjoyment or added amenities. Perfectly positioned for convenience and lifestyle, this property is just moments from local shopping, dining, and everyday essentials. Enjoy the unique charm of being within walking distance to the nostalgic Hi-Way Drive-In Theatre as well as nearby restaurant, making it an attractive location for both tenants and visitors. Whether you're an investor seeking strong cash flow or an owner looking for a property with multiple revenue streams, this offering combines location, versatility, and long-term potential.
-
2026-05-04$499,999 Active 1090-char remark
Show marketing remark (1090 chars)
This versatile income-producing property offers a rare opportunity to own a well-maintained multi-family compound set on 3.5 scenic acres just minutes from the heart of Greenville. The property features 3-4 residential apartments, ideal for steady rental income or a mix of owner-occupied and investment use. Adding to its appeal is a separate commercial building, currently leased and operating as a clothing retail space, providing an additional stream of income from an established tenant. The expansive lot offers plenty of room for outdoor enjoyment or added amenities. Perfectly positioned for convenience and lifestyle, this property is just moments from local shopping, dining, and everyday essentials. Enjoy the unique charm of being within walking distance to the nostalgic Hi-Way Drive-In Theatre as well as nearby restaurant, making it an attractive location for both tenants and visitors. Whether you're an investor seeking strong cash flow or an owner looking for a property with multiple revenue streams, this offering combines location, versatility, and long-term potential.
-
2020-07-31historical
-
2020-01-09$299,000
ⓘ Source: listings_history table (triggers on properties + properties_extension) + one-shot
backfill from property_details.listing_events for pre-trigger history.
Tax reassessment forecast NY · Partial reset (capped growth)
- Current annual tax
- $4,141 · $345/mo
- Projected year-2 tax
- $6,296 · $525/mo
- Expected delta
- +$2,154/yr (+$180/mo · 52.0%)
ⓘ Screening estimate from a state-policy table — verify with the county assessor before closing.
Climate risk First Street
- Flood 1/10 Low FEMA zone X (unshaded) · 0% chance over 30 yrs
- Wildfire 4/10 Moderate
- Heat 3/10 Moderate 7 d/yr ≥95°F today · 16 d/yr by 30 yrs out
- Wind 3/10 Moderate 6% chance of damaging wind over 30 yrs
- Air quality 2/10 Low 0 unhealthy d/yr today · 1 by 30 yrs out
Nearby sold comps map
Loading sold comps map…
Walkable amenities ~0.75 mi
Loading nearby amenities…
Taxation est. · year 1
- Rental income
- $56,388
- − Mortgage interest
- −$28,008
- − Property taxes
- −$4,141
- − Insurance
- −$2,500
- − Repairs & maintenance
- −$4,511
- − Management
- −$4,511
- − Depreciation
- −$14,545
- Taxable loss
- −$1,828
- Est. tax savings @ 24.0%
- +$439
- After-tax cash flow
- $6,880/yr
For passive investors: Depreciation is non-cash, so a rental often shows a tax loss while cash-flowing — sheltering income. Rental losses are passive: they offset passive income freely, and up to $25,000/yr can offset ordinary (W-2) income if you actively participate and your MAGI is under $100k (phasing out to $0 by $150k); unused losses carry forward. On sale, claimed depreciation is recaptured at up to 25%, and gains may owe capital-gains tax (a 1031 exchange can defer both). Figures are a year-1 estimate at your 24.0% rate — not tax advice; consult a CPA.
Schools (NCES district)
- District
- Greenville Central School District
- NCES district ID
- 3612870
- Math proficiency
- 48% ▲ 5.00%
- Reading proficiency
- 55% ▲ 16.00%
- Median HH income
- $58,430
- Composite
- 44.81/100
- National rank
- #2740
- State rank
- #338 of 590 in NY
Livability — Greenville
- Score
- 65/100
- State rank
- #713
- US rank
- #13570
Category grades
Schools grade is shown separately in the Schools card above.
Census & demographics
- Census place
- Greenville, NY
- City population
- 3,648
- Population (ZIP)
- 3,648
Population outlook (Greene County) Hauer SSP2
- Today (2025)
- 44,963 people
- By 2030
- 43,126 · -4.1%
- By 2040
- 38,756 · -13.8%
- By 2050
- 34,913 · -22.4%
- By 2075
- 28,156 · -37.4%
- By 2100
- 22,296 · -50.4%
Race, ethnicity, and origin ACS 2023
- Neighborhood character
- Predominantly White (91%)
- Race & ethnicity
- White 91% Hispanic / Latino 5% Asian 3% Two or more races 2%
- Common ancestry
- Slovak 5% Romanian 5% Iranian 2%
- Foreign-born
- 4% · Canada
- Languages at home
- 95% English-only · Spanish 2% Chinese 1% Other Indo-European 1%
Political lean MEDSL · Greene
- 2024 margin
- R (+17.0) · D 41.5% · R 58.5%
- 2008→2024 swing
- -7.1pp toward R · 2008: -9.9pp · 2024: -17.0pp
- All cycles
- 2024: R+17.0 2020: R+15.6 2016: R+27.4 2012: R+11.1 2008: R+9.9
Not yet ingested
- Civics
- —
Market trends
- HPI YoY
- ▲ 52.23%
- Current HPI
- 378.8518
- Rent YoY
- —
- Metro
- —
- State GDP YoY
- ▲ 2.60%
- F500 in state
- 92
Industry mix (Fortune 500 HQ in NY)
| Industry | F500 HQs | Revenue |
|---|---|---|
| Financial Services | 10 | $950B |
|
||
| Consumer Goods | 9 | $162B |
|
||
| Insurance | 4 | $225B |
|
||
| Telecommunications | 2 | $144B |
|
||
| Pharmaceuticals | 2 | $112B |
|
||
| Media / Entertainment | 2 | $69B |
|
||
Price history
+67.2% since first listed4 events — show timeline
- 2026-05-04 Listed $499,999 Global MLS
- 2026-05-04 Listed $499,999 HVCRMLS
- 2020-07-31 Listing Removed — Global MLS
- 2020-01-09 Listed $299,000 Global MLS
Property tax history
+1.8%/yrLatest (2025): $4,141 · +1.9% YoY. Source: county tax records.
Cash-flow waterfall
monthlySold comps — $/sqft
last 12 mo · ≤1 miLoading sold comps…