 🏗️ New Construction
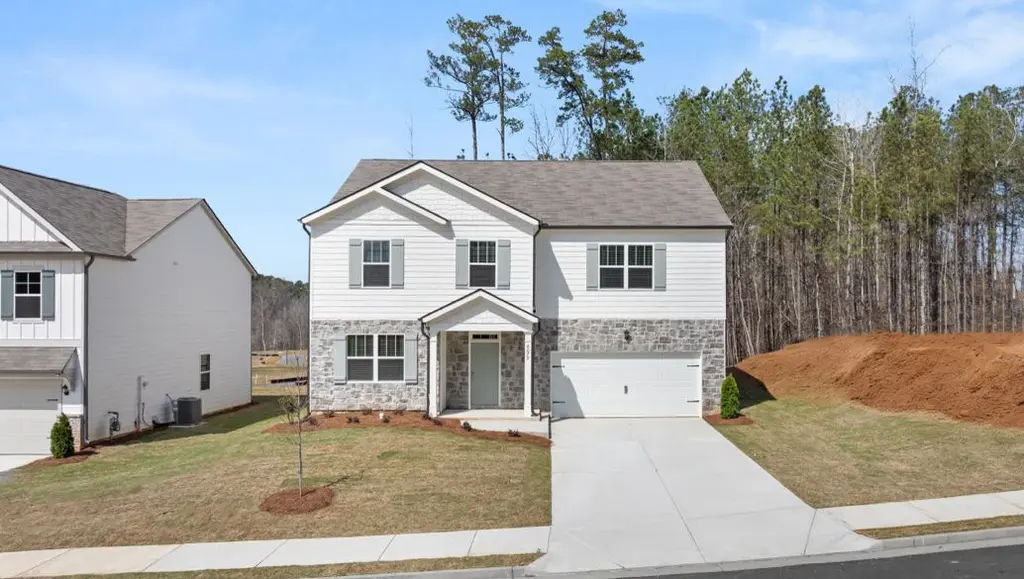
Halton Plan · Union City, GA
Flood risk No data
- FEMA flood zone
- —
- Chance of flooding over 30 yrs
- —
- Est. flood insurance / yr
- —
Fire risk No data
- Est. fire insurance / yr
- —
Heat risk No data
- Hot days now (above threshold)
- —
- Hot days in 30 yrs
- —
Wind risk No data
- Chance of severe wind over 30 yrs
- —
Air-quality risk No data
- Unhealthy air days now
- —
- Unhealthy air days in 30 yrs
- —
Risk factors via First Street. Map © Google.
Why this score? — see what drove the D grade
The composite is a weighted blend of 9 inputs, each scored 0–100. Each bar is that input's sub-score; the figure is the points it added to the 100-point composite (weight × sub-score).
- Appreciation +10.0/10.0
- Cash flow +8.7/30.0
- ARV discount +7.5/15.0
- Schools +4.5/10.0
- Rent growth +3.1/5.0
- Livability +2.9/5.0
- 1% rule +2.7/10.0
- Condition / age +2.5/5.0
- DSCR +2.4/10.0
$442,990
🖨 Deal sheet 📄 Offer letter ✓ Due diligence
Listing remarks
The 3,209 sq. ft. Halton plan is one of the two-story home offerings in South Wind, a community in Union City, GA and is available in 2 unique elevations. Boasting 5 bedrooms and 3 bathrooms, including a spectacular primary suite, there's no question why this is one of our best-selling plans. A spacious foyer leads you into the home, with access to the stairs, a hallway leading into the living room, and an entryway into the flex room at the front of the home. Through the flex room you'll enter a butler's pantry that acts as a pass-through and provides access to the roomy walk-in pantry. The large kitchen feels boundless with seamless flow into the attached dining area and adjacent living ro
Key facts
- Ample laundry room
- Butler's pantry
- Oversized island
Tags
Property features AI
Finance
- Other: Living area approximately 3,209 (unit not shown)
- Financial info: List price $442,990
Exterior
- Home design: New construction plan; Designed as the Halton plan
- Construction: Built as part of 2026 inventory
- Exterior features: Plan home (Halton)
Interior
- Kitchen: Standard kitchen (appliances not specified)
- Bedrooms: 5 bedrooms
- Bathrooms: 3 full bathrooms
- Interior features: Open living areas
- Laundry & utility: Laundry area (details not specified)
Neighborhood map
What this means for you Summary
Snapshot
- This is a 5-bed/3.0-bath single-family listed at $443k.
Deal economics
- At list price, monthly cash flow is $-335 ($-4k/yr) — negative.
- To cash-flow at today's rent, offer at most $346k (21.9% below list).
- To meet the 1% rule (rent ≥ 1% of price), the offer needs to be $303k (31.7% below list).
- Recommended offer: $303k (31.7% below list) — sets the bar for 1% rule.
Location & tenants
- Location reads 58/100 on livability (#443 in GA) — a working-class tenant base; expect higher turnover. Strengths: cost of living A+, housing A+; Watch: crime D+, schools F, amenities F.
- Fulton County (suburban): math 49% / reading 53% proficiency, ranked #12 of 174 in GA (top 7%) — acceptable for families but not a draw, mixed tenant base, ~2y average lease.
- Market conditions: Rents rising (+2.2%/yr); 167 active listings in the ZIP; 9 comparable units currently listed for rent nearby; rentals leasing fast (median 13d on market — plan ~1-2 weeks tenant-placement turnaround); 11,565 units permitted in Fulton County in 2024 (8,159 in 5+ unit buildings).
- At $3,027/mo this rent would consume 75% of the median local household income ($48k/yr) (locally 1778% of renters already pay >50% of income on rent) — very limited rent-growth headroom before tenants either downsize or default.
Forward outlook
- In year one you build about $42k of equity ($3k loan paydown + $39k appreciation (10.0% local appreciation)).
- Fulton County population projected at +38% by 2050 — long-run rental-demand tailwind backs the buy-and-hold thesis.
- By year 2, paydown + projected appreciation supports a ~$68k cash-out refi (75% LTV) — recoverable capital for the next deal without selling this one.
Negotiation context
- It's been on market 48 days — a 3% lower offer ($430k) is reasonable based on typical stale-listing flexibility.
Questions for the listing agent
- What do current leases actually rent for vs. the listed asking? Can we see a recent rent roll and the last 12 months of T-12 income?
- It's been on market 48 days. Have you received any prior offers? Is the seller open to a 32% concession, seller financing, or rate buy-down credit?
- Is there a deadline driving the sale (1031 exchange, divorce, estate, relocation)? That informs how much negotiation room exists.
- Schools are F-rated, which usually means shorter tenancies and higher turnover. Who's the typical renter profile here, and what's been the actual vacancy rate?
- Crime grade is D in this area — have there been break-ins, vandalism, or insurance claims at this property in the last 3 years? What carrier currently insures it and at what premium?
- The area grade is low — what's the realistic commute time and amenity access for the typical tenant pool here? Any planned neighborhood developments (good or bad) we should know about?
- What's the average days-on-market for RENTAL listings here right now (not sales)? A rising rental-DOM trend means longer vacancies and softer asking-rent achievability than the comps imply.
- What's the recent tenant-quality profile in this submarket — average credit score on applications, eviction rate, late-payment / NSF rate, and stable-employment percentage? A property-management company in the area should have these aggregated.
- How much new for-sale + rental construction is in the pipeline within 1–3 miles? Heavy new supply typically softens prices + rents 12–24 months out; constrained supply supports both.
Investment metrics
- 1% rule
- 0.77% ✗
- Cap rate
- 5.28%
- Cash-on-cash
- -3.63%
- DSCR
- 0.84
- GRM
- 10.9
CMA / ARV
- ARV (median comp)
- $394,481
- List price
- $442,990
- Delta
- 12.30%
- Verdict
- OVERPRICED
- Comps
- 20 within 1.0 mi
Show comp detail 5 sales within ~0.75 mi
| Address | Dist | Beds/Ba | Sqft | Sold | Price | $/sf | Match |
|---|---|---|---|---|---|---|---|
| 6021 Airedale Dr | 0.07mi | 5/3.0 | 3,209 (0%) | 2mo | $453,479 | $141 | 95 |
| 6014 Muirfield Pt | 0.08mi | 5/3.0 | 3,209 (0%) | 4mo | $451,990 | $141 | 93 |
| 5389 Rosewood Pl | 0.72mi | 4/3.0 (-1) | 3,021 (-6%) | 5mo | $474,990 | $157 | 48 |
| 468 Lake Ridge Ln | 0.61mi | 5/3.0 | 2,830 (-12%) | 12mo | $350,000 | $124 | 42 |
| 6645 Oak Hill Pass | 0.63mi | 4/3.0 (-1) | 2,860 (-11%) | 13mo | $355,900 | $124 | 37 |
Match score weights: distance 35% · size 25% · config 20% · recency 20%. Top-matched comps best support the ARV.
Projected returns pro-forma
10.0% appreciation · 2.2% rent growth · sell at horizon
- IRR
- 21.5%
- Equity multiple
- 2.73×
- Total profit
- $191,166
- Equity at exit
- $355,379
- IRR
- 19.2%
- Equity multiple
- 6.21×
- Total profit
- $575,051
- Equity at exit
- $766,389
Cash invested: $110,455 (down + closing). Projections, not guarantees.
Landlord ↔ Tenant lean methodology
- Overall (STATE)
- 90 Strongly Landlord-Friendly
- State Georgia
- 90 Strongly Landlord-Friendly · R+3
- County
- — inherits STATE
- City
- — inherits STATE
ZIP-level market 30291
- Home prices YoY
- 11.1%
- Rents YoY
- 2.2%
- Active inventory
- 167
- Price-to-rent
- 12.2×
Monthly cashflow live
- Estimated rent
- $3,027 high interval (Pro) →
- Mortgage (P&I)
- −$2,069
- Tax est. 1.5%
- −$493 /mo · $5,917/yr
- Insurance
- −$164
- HOA
- −$0
- Vacancy / Maint / Mgmt
- −$636
- Net cashflow
- $-335
Break-even live
UW: 25.0% down · 7.5% · 30yr · 1.5% tax · 5.0% vac · 8.0% maint · 8.0% mgmt
Financing live
Cash to close
- Down payment
- $98,620
- Closing costs
- $11,834
- Reserves months
- —
- Total cash needed
- —
Loan-product check · same deal, 3 products live
Conventional
25% down · 7.5% · 30yr
- Down + closing
- —
- Monthly P&I
- —
- Monthly cashflow
- —
- DSCR
- —
- Eligible?
- —
Personal DTI + credit; lowest rate.
DSCR
20% down · 8.5% · 30yr
- Down + closing
- —
- Monthly P&I
- —
- Monthly cashflow
- —
- DSCR
- —
- Eligible?
- —
No personal income docs; deal must DSCR.
Hard money
10% down · 12.0% · 12mo
- Down + closing
- —
- Monthly P&I
- —
- Monthly cashflow
- —
- DSCR
- —
- Eligible?
- —
Short-term bridge; refi at stabilization.
Rent comps 9 comps
| Address | Beds | Baths | Sqft | Rent | $/sqft | DOM | Units | Dist |
|---|---|---|---|---|---|---|---|---|
| 4407 Sparrow Cir Atlanta, GA | 3.0–5.0 | 2.5–3.0 | 2055 | $2,700 | $1.31 | 1d | 10 | 0.52mi |
| 5405 Rosewood Pl Fairburn, GA | 5.0 | 4.0 | 3405 | $4,800 | $1.41 | 43d | 1 | 0.72mi |
| 1008 Eldon Ln Fairburn, GA | 4.0 | 3.0 | 2402 | $2,539 | $1.06 | 11d | 1 | 0.75mi |
| 1013 Eldon Ln Fairburn, GA | 4.0 | 2.5 | 2440 | $2,379 | $0.97 | 16d | 1 | 0.76mi |
| 538 Jadetree Ln Atlanta, GA | 5.0 | 3.0 | 2576 | $2,900 | $1.13 | 1d | 1 | 0.78mi |
| 438 Lake Ridge Ln Fairburn, GA | 5.0 | 3.0 | 2964 | $3,049 | $1.03 | 1d | 1 | 0.81mi |
| 801 Lake Chase Fairburn, GA | 4.0 | 2.0 | 2636 | $2,570 | $0.97 | 24d | 1 | 0.82mi |
| 6015 Deer Run St Union City, GA | 5.0 | 2.5 | 2360 | $2,700 | $1.14 | 24d | 1 | 1.10mi |
| 6155 Dodson Rd Fairburn, GA | 4.0 | 2.5 | 2400 | $2,600 | $1.08 | 12d | 1 | 1.26mi |
Listing history 13 events
-
2026-06-18days on market $442,990 Active 48 DOM
-
2026-06-17days on market $442,990 Active 47 DOM
-
2026-06-16days on market $442,990 Active 46 DOM
-
2026-06-15days on market $442,990 Active 45 DOM
-
2026-06-13days on market $442,990 Active 43 DOM
-
2026-06-09days on market $442,990 Active 39 DOM
-
2026-06-08days on market $442,990 Active 38 DOM
-
2026-06-08days on market $442,990 Active 37 DOM
-
2026-06-04days on market $442,990 Active 34 DOM
-
2026-06-03days on market $442,990 Active 33 DOM
-
2026-06-01days on market $442,990 Active 31 DOM
-
2026-05-31days on market $442,990 Active 30 DOM
-
2026-05-01$442,990 Active 1465-char remark
ⓘ Source: listings_history table (triggers on properties + properties_extension) + one-shot
backfill from property_details.listing_events for pre-trigger history.
Nearby sold comps map
Loading sold comps map…
Walkable amenities ~0.75 mi
Loading nearby amenities…
Taxation est. · year 1
- Rental income
- $36,329
- − Mortgage interest
- −$22,097
- − Property taxes
- −$5,917
- − Insurance
- −$1,972
- − Repairs & maintenance
- −$2,906
- − Management
- −$2,906
- − Depreciation
- −$11,476
- Taxable loss
- −$10,946
- Est. tax savings @ 24.0%
- +$2,627
- After-tax cash flow
- $-1,387/yr
For passive investors: Depreciation is non-cash, so a rental often shows a tax loss while cash-flowing — sheltering income. Rental losses are passive: they offset passive income freely, and up to $25,000/yr can offset ordinary (W-2) income if you actively participate and your MAGI is under $100k (phasing out to $0 by $150k); unused losses carry forward. On sale, claimed depreciation is recaptured at up to 25%, and gains may owe capital-gains tax (a 1031 exchange can defer both). Figures are a year-1 estimate at your 24.0% rate — not tax advice; consult a CPA.
Schools (NCES district)
- District
- Fulton County
- NCES district ID
- 1302280
- Math proficiency
- 49% ▼ -2.00%
- Reading proficiency
- 53% ▬ 0.00%
- Median HH income
- $68,035
- Composite
- 45.33/100
- National rank
- #2640
- State rank
- #12 of 174 in GA
Livability — Union City
- Score
- 58/100
- State rank
- #443
- US rank
- #21281
Category grades
Schools grade is shown separately in the Schools card above.
Census & demographics
- Census place
- Union City, GA
- County
- Fulton County · 1,094,430 people
- City population
- 25,130
- Metro
- Atlanta-Sandy Springs-Alpharetta, GA
- Population (ZIP)
- 25,130
- Household income
- $48,184
- Rent vs Own
- Severe rent burden
- 1778.0
Population outlook (Fulton County) Hauer SSP2
- Today (2025)
- 1,203,707 people
- By 2030
- 1,299,706 · +8.0%
- By 2040
- 1,488,256 · +23.6%
- By 2050
- 1,664,580 · +38.3%
- By 2075
- 2,036,072 · +69.2%
- By 2100
- 2,222,402 · +84.6%
Race, ethnicity, and origin ACS 2023
- Neighborhood character
- Predominantly Black (86%)
- Race & ethnicity
- Black 86% Hispanic / Latino 7% Two or more races 6% White 3%
- Hispanic origin (detail)
- Mexican 4%
- Common ancestry
- Italian 1%
- Foreign-born
- 5% · Canada
- Languages at home
- 92% English-only · Spanish 6%
Political lean MEDSL · Fulton
- 2024 margin
- Solid D (+44.9) · D 71.9% · R 27.0% · Other 1.1%
- 2008→2024 swing
- +9.8pp toward D · 2008: 35.0pp · 2024: 44.9pp
- All cycles
- 2024: D+44.9 2020: D+46.4 2016: D+42.1 2012: D+29.6 2008: D+35.0
Not yet ingested
- Civics
- —
Market trends
- HPI YoY
- ▲ 23.98%
- Current HPI
- 239.3471
- Rent YoY
- ▲ 2.20%
- Metro
- Atlanta-Sandy Springs-Alpharetta, GA
- State GDP YoY
- ▲ 2.66%
- F500 in state
- 28
Industry mix (Fortune 500 HQ in GA)
| Industry | F500 HQs | Revenue |
|---|---|---|
| Paper / Packaging | 2 | $29B |
|
||
| Retail | 1 | $160B |
|
||
| Transportation / Logistics | 1 | $91B |
|
||
| Airlines | 1 | $62B |
|
||
| Consumer Goods | 1 | $47B |
|
||
| Utilities | 1 | $25B |
|
||
Cash-flow waterfall
monthlySold comps — $/sqft
last 12 mo · ≤1 miLoading sold comps…