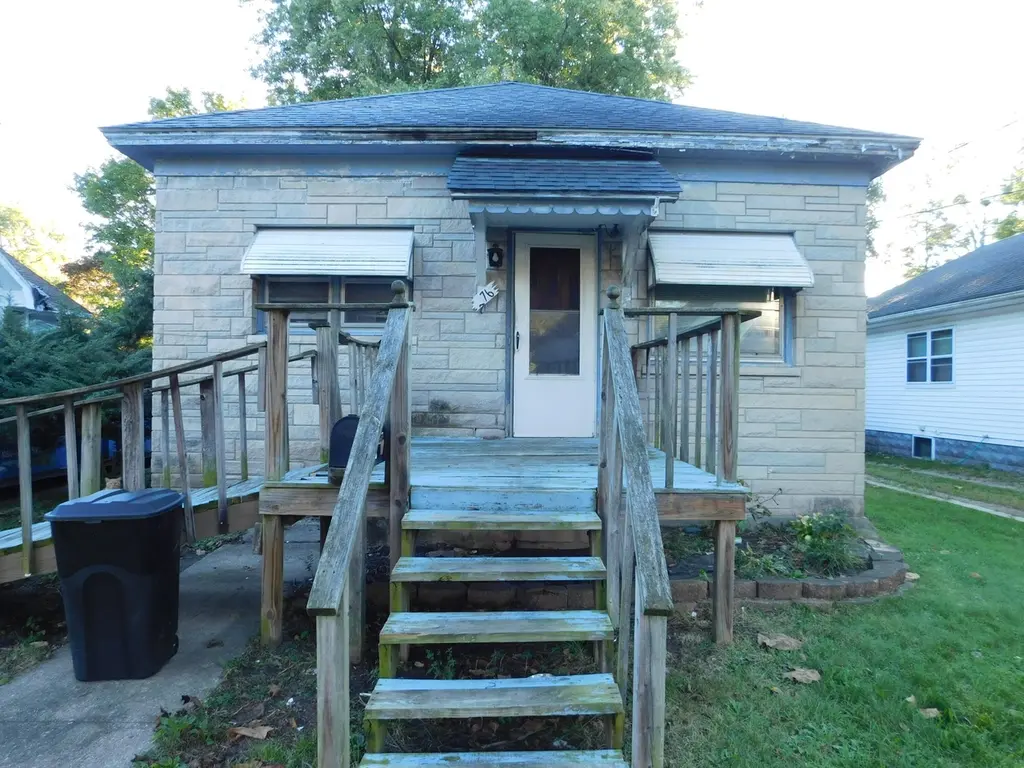
276 Mckinley Ave N · Battle Creek, MI
Flood risk 1/10 · Minimal
- FEMA flood zone
- X (unshaded)
- Chance of flooding over 30 yrs
- 0.0%
- Est. flood insurance / yr
- $473 – $860
Fire risk 1/10 · Minimal
- Est. fire insurance / yr
- $784 – $1,456
Heat risk 2/10 · Minimal
- Hot days now (above 97°F)
- 7 days/yr
- Hot days in 30 yrs
- 16 days/yr
Wind risk 2/10 · Minimal
- Chance of severe wind over 30 yrs
- —
Air-quality risk 3/10 · Minor
- Unhealthy air days now
- 2 days/yr
- Unhealthy air days in 30 yrs
- 3 days/yr
Risk factors via First Street. Map © Google.
Why this score? — see what drove the C grade
The composite is a weighted blend of 9 inputs, each scored 0–100. Each bar is that input's sub-score; the figure is the points it added to the 100-point composite (weight × sub-score).
- Cash flow +18.5/30.0
- ARV discount +15.0/15.0
- 1% rule +6.0/10.0
- DSCR +5.8/10.0
- Livability +3.7/5.0
- Rent growth +2.5/5.0
- Condition / age +2.5/5.0
- Schools +1.1/10.0
- Appreciation +0.0/10.0
$99,000
🖨 Deal sheet 📄 Offer letter ✓ Due diligence
Key facts
- 7,013 sq ft lot
- 2 garage spots
- Built 1920
Neighborhood map
What this means for you Summary
Snapshot
- This is a 2-bed/1.0-bath single-family listed at $99k.
Deal economics
- At list price, monthly cash flow is $94 ($1k/yr) — positive.
- The deal already cash-flows at list — no discount required.
- Meets the 1% rule at list price ($1k rent vs $99k).
- Recommended offer: $87k (12.0% below list) — sets the bar for market timing.
- Cap rate 7.4% vs local median 5.2% in Battle Creek — top-decile yield for the area; either an underpriced asset or a hidden risk that comps aren't pricing in. Stress-test before assuming the spread holds.
Location & tenants
- Location reads 73/100 on livability (#198 in MI) — a middle-class / working-renter tenant base. Strengths: cost of living A+, housing A+, health & safety A+; Watch: schools C-, amenities C-, crime F.
- Battle Creek Public Schools (urban): math 8% / reading 19% proficiency, ranked #510 of 540 in MI (top 94%) — low school quality limits family demand, transient renter base, plan for 1-2y turnover; 75% free/reduced lunch — lower-income household profile, screen leases tightly.
- Market conditions: 148 active listings in the ZIP; 6 comparable units currently listed for rent nearby; rentals lingering (median 44d on market — plan ~5-8 weeks vacancy on turnover, expect pricing pressure); 83% of comp listings sitting > 30 days — soft ceiling on asking rent; 132 units permitted in Calhoun County in 2024 (0 in 5+ unit buildings).
Forward outlook
- Local home prices are declining (-3.0%/yr); year-one equity from $684 of loan paydown is wiped out by about $3k of value loss. Plan a longer hold.
- Calhoun County population projected at -16% by 2050 — secular population decline; favor cash flow + early exit over multi-decade hold.
Negotiation context
- It's been on market 253 days — a 12% lower offer ($87k) is reasonable based on typical stale-listing flexibility.
- 7 sale attempts since 26y ago with the ask held roughly flat each time — persistent listings suggest the price (not the market) is what's stuck; bring a comps-based counter.
- Current owner paid $75k; 32% above their basis — modest negotiation headroom, anchor on the comps not their cost.
Risks & watch-outs
- Watch-outs: property tax is 2.5% of price; built in 1920 — expect roof / HVAC / electrical / plumbing capex.
Questions for the listing agent
- It's been on market 253 days. Have you received any prior offers? Is the seller open to a 12% concession, seller financing, or rate buy-down credit?
- Built in 1920 — when were the roof, HVAC, electrical panel, plumbing, and water heater last replaced?
- Property tax is high relative to price — has the assessment been appealed recently, and will the sale trigger a re-assessment?
- Why hasn't it sold? Are there any deal-killer items the seller is aware of (foundation, flood, title, zoning, code violations)?
- Is there a deadline driving the sale (1031 exchange, divorce, estate, relocation)? That informs how much negotiation room exists.
- Crime grade is F in this area — have there been break-ins, vandalism, or insurance claims at this property in the last 3 years? What carrier currently insures it and at what premium?
- What's the average days-on-market for RENTAL listings here right now (not sales)? A rising rental-DOM trend means longer vacancies and softer asking-rent achievability than the comps imply.
- What's the recent tenant-quality profile in this submarket — average credit score on applications, eviction rate, late-payment / NSF rate, and stable-employment percentage? A property-management company in the area should have these aggregated.
- How much new for-sale + rental construction is in the pipeline within 1–3 miles? Heavy new supply typically softens prices + rents 12–24 months out; constrained supply supports both.
Investment metrics
- 1% rule
- 1.10% ✓
- Cap rate
- 7.43%
- Cash-on-cash
- 4.05%
- DSCR
- 1.18
- GRM
- 7.5
CMA / ARV
- ARV (median comp)
- $127,707
- List price
- $99,000
- Delta
- -22.48%
- Verdict
- UNDERPRICED
- Comps
- 20 within 1.0 mi
Show comp detail 12 sales within ~0.75 mi
| Address | Dist | Beds/Ba | Sqft | Sold | Price | $/sf | Match |
|---|---|---|---|---|---|---|---|
| 334 Cornell Dr | 0.16mi | 2/1.5 | 840 (+0%) | 11mo | $145,000 | $173 | 81 |
| 207 Laurel Dr | 0.09mi | 2/1.0 | 890 (+6%) | 10mo | $103,000 | $116 | 77 |
| 101 Maple Ter | 0.38mi | 2/1.0 | 816 (-2%) | 4mo | $165,000 | $202 | 75 |
| 425 Cornell Dr | 0.25mi | 2/2.0 | 832 (-0%) | 10mo | $150,000 | $180 | 75 |
| 102 Yale St | 0.42mi | 2/1.0 | 874 (+4%) | 3mo | $100,000 | $114 | 71 |
| 21 Charlotte St | 0.51mi | 2/1.0 | 860 (+3%) | 4mo | $52,000 | $60 | 68 |
| 145 Van Armon Ave | 0.56mi | 1/1.0 (-1) | 808 (-3%) | 5mo | $123,000 | $152 | 59 |
| 433 Cornell Dr | 0.28mi | 2/1.0 | 720 (-14%) | 9mo | $139,900 | $194 | 57 |
| 86 E Ave S | 0.74mi | 2/1.0 | 792 (-5%) | 1mo | $162,000 | $205 | 56 |
| 208 Central St | 0.42mi | 3/1.0 (+1) | 765 (-8%) | 9mo | $36,900 | $48 | 54 |
| 13 Fairview Ave | 0.67mi | 2/1.0 | 726 (-13%) | 6mo | $97,250 | $134 | 42 |
| 50 Montford St | 0.57mi | 3/1.0 (+1) | 936 (+12%) | 9mo | $70,000 | $75 | 41 |
Match score weights: distance 35% · size 25% · config 20% · recency 20%. Top-matched comps best support the ARV.
Projected returns pro-forma
-3.0% appreciation · 3.0% rent growth · sell at horizon
- IRR
- -9.9%
- Equity multiple
- 0.64×
- Total profit
- $-10,012
- Equity at exit
- $14,761
- IRR
- -0.4%
- Equity multiple
- 0.97×
- Total profit
- $-762
- Equity at exit
- $8,560
Cash invested: $27,720 (down + closing). Projections, not guarantees.
Landlord ↔ Tenant lean methodology
- Overall (STATE)
- 62 Landlord-Friendly
- State Michigan
- 62 Landlord-Friendly · EVEN
- County
- — inherits STATE
- City
- — inherits STATE
ZIP-level market 49017
- Home prices YoY
- -32.2%
- Active inventory
- 148
- Price-to-rent
- 7.5×
Monthly cashflow live
- Estimated rent
- $1,093 high interval (Pro) →
- Mortgage (P&I)
- −$519
- Tax from tax record
- −$209 /mo · $2,514/yr
- Insurance
- −$41
- HOA
- −$0
- Vacancy / Maint / Mgmt
- −$230
- Net cashflow
- $94
Break-even live
UW: 25.0% down · 7.5% · 30yr · 1.5% tax · 5.0% vac · 8.0% maint · 8.0% mgmt
Financing live
Cash to close
- Down payment
- $24,750
- Closing costs
- $2,970
- Reserves months
- —
- Total cash needed
- —
Loan-product check · same deal, 3 products live
Conventional
25% down · 7.5% · 30yr
- Down + closing
- —
- Monthly P&I
- —
- Monthly cashflow
- —
- DSCR
- —
- Eligible?
- —
Personal DTI + credit; lowest rate.
DSCR
20% down · 8.5% · 30yr
- Down + closing
- —
- Monthly P&I
- —
- Monthly cashflow
- —
- DSCR
- —
- Eligible?
- —
No personal income docs; deal must DSCR.
Hard money
10% down · 12.0% · 12mo
- Down + closing
- —
- Monthly P&I
- —
- Monthly cashflow
- —
- DSCR
- —
- Eligible?
- —
Short-term bridge; refi at stabilization.
Rent comps 6 comps
| Address | Beds | Baths | Sqft | Rent | $/sqft | DOM | Units | Dist |
|---|---|---|---|---|---|---|---|---|
| 138 Yale St Battle Creek, MI | 2.0 | 1.0 | 877 | $1,275 | $1.45 | 43d | 1 | 0.42mi |
| 775 Wagner Dr Battle Creek, MI | 1.0–2.0 | 1.0 | 772 | $1,085 | $1.40 | 43d | 6 | 0.69mi |
| 595 Wagner Dr Unit 22 Battle Creek, MI | 1.0 | 1.0 | 750 | $1,050 | $1.40 | 43d | 1 | 0.76mi |
| 54 Springview Dr Battle Creek, MI | 1.0–3.0 | 1.0–2.0 | 900 | $925 | $1.03 | 21d | 3 | 0.87mi |
| 115 West St Battle Creek, MI | 2.0–3.0 | 1.0–2.0 | 1090 | $1,350 | $1.24 | 43d | 3 | 0.99mi |
| 98 Van Buren St E Battle Creek, MI | 2.0 | 1.0 | 1118 | $950 | $0.85 | 43d | 1 | 1.07mi |
Listing history 28 events
-
2026-06-19days on market $99,000 Active 253 DOM
-
2026-06-18days on market $99,000 Active 252 DOM
-
2026-06-17days on market $99,000 Active 251 DOM
-
2026-06-16days on market $99,000 Active 250 DOM
-
2026-06-15days on market $99,000 Active 249 DOM
-
2026-06-14days on market $99,000 Active 247 DOM
-
2026-06-13days on market $99,000 Active 246 DOM
-
2026-06-10days on market $99,000 Active 244 DOM
-
2026-06-09days on market $99,000 Active 243 DOM
-
2026-06-08days on market $99,000 Active 242 DOM
-
2026-06-07days on market $99,000 Active 241 DOM
-
2026-06-05days on market $99,000 Active 238 DOM
-
2026-06-02days on market $99,000 Active 236 DOM
-
2026-06-01days on market $99,000 Active 235 DOM
-
2026-05-31days on market $99,000 Active 234 DOM
-
2026-05-30days on market $99,000 Active 233 DOM
-
2025-10-09$99,000 Active
-
2025-10-09$99,000 Active
-
2025-10-09$99,000 Active
-
2006-09-28soldstatus $74,900
-
2006-09-11soldstatus $74,900
-
2006-09-11soldstatus $74,900
-
2006-04-20$74,900
-
2006-04-20$74,900
-
2000-03-09soldstatus $56,900
-
2000-03-09soldstatus $56,900
-
2000-02-15$56,900
-
2000-02-15$56,900
ⓘ Source: listings_history table (triggers on properties + properties_extension) + one-shot
backfill from property_details.listing_events for pre-trigger history.
Tax reassessment forecast MI · Partial reset (capped growth)
- Current annual tax
- $2,514 · $209/mo
- Projected year-2 tax
- $2,514 · $209/mo
- Expected delta
- $0/yr ($0/mo · 0.0%)
ⓘ Screening estimate from a state-policy table — verify with the county assessor before closing.
Climate risk First Street
- Flood 1/10 Low FEMA zone X (unshaded) · 0% chance over 30 yrs
- Wildfire 1/10 Low
- Heat 2/10 Low 7 d/yr ≥97°F today · 16 d/yr by 30 yrs out
- Wind 2/10 Low
- Air quality 3/10 Moderate 2 unhealthy d/yr today · 3 by 30 yrs out
Nearby sold comps map
Loading sold comps map…
Walkable amenities ~0.75 mi
Loading nearby amenities…
Taxation est. · year 1
- Rental income
- $13,116
- − Mortgage interest
- −$5,546
- − Property taxes
- −$2,514
- − Insurance
- −$495
- − Repairs & maintenance
- −$1,049
- − Management
- −$1,049
- − Depreciation
- −$2,880
- Taxable loss
- −$417
- Est. tax savings @ 24.0%
- +$100
- After-tax cash flow
- $1,223/yr
For passive investors: Depreciation is non-cash, so a rental often shows a tax loss while cash-flowing — sheltering income. Rental losses are passive: they offset passive income freely, and up to $25,000/yr can offset ordinary (W-2) income if you actively participate and your MAGI is under $100k (phasing out to $0 by $150k); unused losses carry forward. On sale, claimed depreciation is recaptured at up to 25%, and gains may owe capital-gains tax (a 1031 exchange can defer both). Figures are a year-1 estimate at your 24.0% rate — not tax advice; consult a CPA.
Schools (NCES district)
- District
- Battle Creek Public Schools
- NCES district ID
- 2600005
- Math proficiency
- 8% ▼ -2.00%
- Reading proficiency
- 19% ▬ 0.00%
- Median HH income
- $31,697
- Composite
- 10.73/100
- National rank
- #9769
- State rank
- #510 of 540 in MI
Livability — Battle Creek
- Score
- 73/100
- State rank
- #198
- US rank
- #5031
Category grades
Schools grade is shown separately in the Schools card above.
Census & demographics
- Census place
- Battle Creek, MI
- County
- Calhoun County · 91,590 people
- City population
- 91,590
- Metro
- Battle Creek, MI
- Population (ZIP)
- 21,295
- Household income
- $60,885
- Rent vs Own
- Severe rent burden
- 697.0
Population outlook (Calhoun County) Hauer SSP2
- Today (2025)
- 130,157 people
- By 2030
- 126,691 · -2.7%
- By 2040
- 118,517 · -8.9%
- By 2050
- 109,855 · -15.6%
- By 2075
- 90,486 · -30.5%
- By 2100
- 70,766 · -45.6%
Race, ethnicity, and origin ACS 2023
- Neighborhood character
- Predominantly White (78%)
- Race & ethnicity
- White 78% Black 9% Two or more races 8% Hispanic / Latino 6%
- Hispanic origin (detail)
- Mexican 4%
- Common ancestry
- Slovak 3% Iranian 3% Romanian 2%
- Foreign-born
- 3% · Canada, Philippines
- Languages at home
- 95% English-only · Spanish 2% Other Asian/Pacific 1% Arabic 1%
Political lean MEDSL · Calhoun
- 2024 margin
- R (+14.1) · D 42.3% · R 56.4% · Other 1.3%
- 2008→2024 swing
- -23.4pp toward R · 2008: 9.4pp · 2024: -14.1pp
- All cycles
- 2024: R+14.1 2020: R+11.1 2016: R+12.5 2012: D+1.6 2008: D+9.4
Not yet ingested
- Civics
- —
Market trends
- HPI YoY
- ▼ -115.68%
- Current HPI
- 243.5008
- Rent YoY
- —
- Metro
- Battle Creek, MI
- State GDP YoY
- ▲ 1.37%
- F500 in state
- 28
Industry mix (Fortune 500 HQ in MI)
| Industry | F500 HQs | Revenue |
|---|---|---|
| Automotive Parts | 3 | $48B |
|
||
| Automotive | 2 | $372B |
|
||
| Chemicals | 1 | $45B |
|
||
| Automotive Retail | 1 | $29B |
|
||
| Healthcare / Medical Devices | 1 | $23B |
|
||
| Automotive Technology | 1 | $20B |
|
||
Price history
+74.0% since first listed12 events — show timeline
- 2025-10-09 Listed $99,000 REALCOMP
- 2025-10-09 Listed $99,000 SW Michigan MLS
- 2025-10-09 Listed $99,000 MiRealSource-MiMLS
- 2006-09-28 Sold (Public Records) $74,900 Public Records
- 2006-09-11 Sold (MLS) $74,900 REALCOMP
- 2006-09-11 Sold (MLS) $74,900 SW Michigan MLS
- 2006-04-20 Listed $74,900 REALCOMP
- 2006-04-20 Listed $74,900 SW Michigan MLS
- 2000-03-09 Sold (MLS) $56,900 REALCOMP
- 2000-03-09 Sold (MLS) $56,900 SW Michigan MLS
- 2000-02-15 Listed $56,900 REALCOMP
- 2000-02-15 Listed $56,900 SW Michigan MLS
Property tax history
+20.7%/yrLatest (2025): $2,514 · +90.9% YoY. Source: county tax records.
Cash-flow waterfall
monthlySold comps — $/sqft
last 12 mo · ≤1 miLoading sold comps…