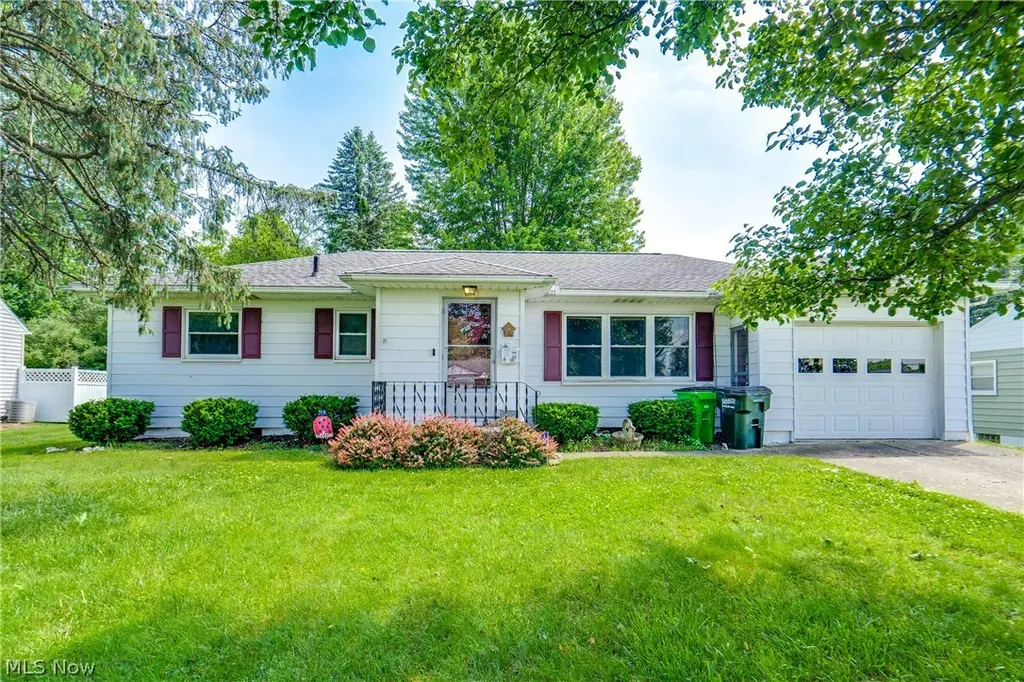
344 Morgan St · Barberton, OH
Flood risk 1/10 · Minimal
- FEMA flood zone
- X (unshaded)
- Chance of flooding over 30 yrs
- 0.0%
- Est. flood insurance / yr
- $473 – $860
Fire risk 1/10 · Minimal
- Est. fire insurance / yr
- $713 – $1,323
Heat risk 3/10 · Minor
- Hot days now (above 98°F)
- 7 days/yr
- Hot days in 30 yrs
- 17 days/yr
Wind risk 1/10 · Minimal
- Chance of severe wind over 30 yrs
- —
Air-quality risk 2/10 · Minimal
- Unhealthy air days now
- 0 days/yr
- Unhealthy air days in 30 yrs
- 1 days/yr
Risk factors via First Street. Map © Google.
Why this score? — see what drove the F grade
The composite is a weighted blend of 9 inputs, each scored 0–100. Each bar is that input's sub-score; the figure is the points it added to the 100-point composite (weight × sub-score).
- Cash flow +12.7/30.0
- Schools +4.1/10.0
- Rent growth +4.0/5.0
- DSCR +3.8/10.0
- Livability +3.6/5.0
- 1% rule +3.1/10.0
- Condition / age +2.5/5.0
- ARV discount +0.0/15.0
- Appreciation +0.0/10.0
$179,900
🖨 Deal sheet 📄 Offer letter ✓ Due diligence
Listing remarks MLS
Wonderful North end location. One story living with many nice updates. Spacious back yard. Move right in!
Key facts
- Shed
- Covered back deck
- Eat-in kitchen
Tags
Property features AI
Exterior
- Parking: Attached garage with direct access and garage door opener; Paved driveway
- Utilities: Public water; Public sewer
- Home design: Single-story home; Below-grade finished living area
- Construction: Aluminum siding; Asphalt/fiberglass roof; Built per public records
- Exterior features: Covered porch; Deck
Interior
- Kitchen: Range; Microwave; Refrigerator; Dishwasher
- Bedrooms: Three main-level bedrooms
- Bathrooms: Two full bathrooms, one on the main level
- Heating & cooling: Forced-air gas heating; Central air conditioning
- Interior features: Full, partially finished basement
- Laundry & utility: Washer and dryer on the main level
Neighborhood map
What this means for you Summary
Snapshot
- This is a 3-bed/2.0-bath single-family listed at $180k.
Deal economics
- At list price, monthly cash flow is $-21 ($-250/yr) — negative.
- To cash-flow at today's rent, offer at most $176k (2.0% below list).
- To meet the 1% rule (rent ≥ 1% of price), the offer needs to be $146k (18.8% below list).
- Recommended offer: $146k (18.8% below list) — sets the bar for 1% rule.
Location & tenants
- Location reads 71/100 on livability (#428 in OH) — a middle-class / working-renter tenant base. Strengths: cost of living A+, housing A+, health & safety A+; Watch: crime C-, amenities F, commute F.
- Barberton City (suburban): math 47% / reading 51% proficiency, ranked #466 of 656 in OH (top 71%) — families likely to look elsewhere, expect single-tenant / working-renter base with shorter leases; 62% free/reduced lunch — lower-income household profile, screen leases tightly.
- Market conditions: Rents rising fast (+5.9%/yr); 219 active listings in the ZIP; 6 comparable units currently listed for rent nearby; rentals at typical pace (median 14d on market — plan ~3-4 weeks tenant-placement turnaround); 1,114 units permitted in Summit County in 2024 (397 in 5+ unit buildings).
Forward outlook
- Local home prices are declining (-3.0%/yr); year-one equity from $1k of loan paydown is wiped out by about $5k of value loss. Plan a longer hold.
- Summit County population projected to shrink 6% by 2050 — rents likely to lag national; underwrite the cash flow, not the appreciation.
Negotiation context
- Only 5 days on market — expect competitive offers; lowballing is unlikely to land.
- 4 sale attempts since 5y ago with the ask held roughly flat each time — persistent listings suggest the price (not the market) is what's stuck; bring a comps-based counter.
- Current owner paid $151k; 19% above their basis — modest negotiation headroom, anchor on the comps not their cost.
Risks & watch-outs
- Watch-outs: built in 1955 — expect roof / HVAC / electrical / plumbing capex.
Questions for the listing agent
- What do current leases actually rent for vs. the listed asking? Can we see a recent rent roll and the last 12 months of T-12 income?
- Built in 1955 — when were the roof, HVAC, electrical panel, plumbing, and water heater last replaced?
- Is there a deadline driving the sale (1031 exchange, divorce, estate, relocation)? That informs how much negotiation room exists.
- The area grade is low — what's the realistic commute time and amenity access for the typical tenant pool here? Any planned neighborhood developments (good or bad) we should know about?
- What's the average days-on-market for RENTAL listings here right now (not sales)? A rising rental-DOM trend means longer vacancies and softer asking-rent achievability than the comps imply.
- What's the recent tenant-quality profile in this submarket — average credit score on applications, eviction rate, late-payment / NSF rate, and stable-employment percentage? A property-management company in the area should have these aggregated.
- How much new for-sale + rental construction is in the pipeline within 1–3 miles? Heavy new supply typically softens prices + rents 12–24 months out; constrained supply supports both.
Investment metrics
- 1% rule
- 0.81% ✗
- Cap rate
- 6.15%
- Cash-on-cash
- -0.50%
- DSCR
- 0.98
- GRM
- 10.3
CMA / ARV
- ARV (on-the-fly)
- $144,232
- Comps found
- 12
Show comp detail 12 sales within ~0.75 mi
| Address | Dist | Beds/Ba | Sqft | Sold | Price | $/sf | Match |
|---|---|---|---|---|---|---|---|
| 639 N Way St | 0.45mi | 3/2.0 | 907 (-6%) | 3mo | $107,500 | $119 | 66 |
| 441 Glenn St | 0.54mi | 3/1.0 | 962 (-1%) | 6mo | $150,000 | $156 | 65 |
| 669 N Way St | 0.50mi | 3/1.0 | 936 (-3%) | 4mo | $139,500 | $149 | 64 |
| 621 Creedmore Ave | 0.72mi | 3/1.5 | 960 (-1%) | 1mo | $79,900 | $83 | 62 |
| 146 Hermann St | 0.63mi | 3/1.0 | 926 (-4%) | 0mo | $67,000 | $72 | 59 |
| 655 N Way St | 0.48mi | 3/1.0 | 864 (-11%) | 1mo | $175,000 | $203 | 55 |
| 46 Brown St | 0.51mi | 3/1.0 | 1,068 (+10%) | 1mo | $78,754 | $74 | 54 |
| 818 N Summit St | 0.68mi | 2/1.0 (-1) | 966 (-0%) | 7mo | $122,000 | $126 | 53 |
| 162 Mitchell St | 0.41mi | 3/1.0 | 1,104 (+14%) | 2mo | $175,000 | $159 | 52 |
| 888 Orchard Ave | 0.68mi | 3/1.0 | 1,040 (+7%) | 0mo | $200,000 | $192 | 52 |
| 412 Grandview Ave | 0.68mi | 2/1.0 (-1) | 1,075 (+11%) | 8mo | $142,500 | $133 | 35 |
| 1960 Newton St | 0.72mi | 2/1.5 (-1) | 1,092 (+13%) | 8mo | $192,000 | $176 | 32 |
Match score weights: distance 35% · size 25% · config 20% · recency 20%. Top-matched comps best support the ARV.
Projected returns pro-forma
-3.0% appreciation · 5.86% rent growth · sell at horizon
- IRR
- -14.1%
- Equity multiple
- 0.48×
- Total profit
- $-26,172
- Equity at exit
- $26,824
- IRR
- -1.5%
- Equity multiple
- 0.89×
- Total profit
- $-5,753
- Equity at exit
- $15,554
Cash invested: $50,372 (down + closing). Projections, not guarantees.
Landlord ↔ Tenant lean methodology
- Overall (STATE)
- 73 Landlord-Friendly
- State Ohio
- 73 Landlord-Friendly · R+6
- County
- — inherits STATE
- City
- — inherits STATE
ZIP-level market 44203
- Rents YoY
- 5.9%
- Active inventory
- 219
- Price-to-rent
- 10.3×
Monthly cashflow live
- Estimated rent
- $1,462 high interval (Pro) →
- Mortgage (P&I)
- −$943
- Tax from tax record
- −$157 /mo · $1,886/yr
- Insurance
- −$75
- HOA
- −$0
- Vacancy / Maint / Mgmt
- −$307
- Net cashflow
- $-21
Break-even live
UW: 25.0% down · 7.5% · 30yr · 1.5% tax · 5.0% vac · 8.0% maint · 8.0% mgmt
Financing live
Cash to close
- Down payment
- $44,975
- Closing costs
- $5,397
- Reserves months
- —
- Total cash needed
- —
Loan-product check · same deal, 3 products live
Conventional
25% down · 7.5% · 30yr
- Down + closing
- —
- Monthly P&I
- —
- Monthly cashflow
- —
- DSCR
- —
- Eligible?
- —
Personal DTI + credit; lowest rate.
DSCR
20% down · 8.5% · 30yr
- Down + closing
- —
- Monthly P&I
- —
- Monthly cashflow
- —
- DSCR
- —
- Eligible?
- —
No personal income docs; deal must DSCR.
Hard money
10% down · 12.0% · 12mo
- Down + closing
- —
- Monthly P&I
- —
- Monthly cashflow
- —
- DSCR
- —
- Eligible?
- —
Short-term bridge; refi at stabilization.
Rent comps 6 comps
| Address | Beds | Baths | Sqft | Rent | $/sqft | DOM | Units | Dist |
|---|---|---|---|---|---|---|---|---|
| 543 Otterbein Ave Barberton, OH | 4.0 | 1.0 | 1100 | $1,500 | $1.36 | 14d | 1 | 0.11mi |
| 667 W Park Ave Barberton, OH | 2.0 | 1.0 | 900 | $1,350 | $1.50 | 14d | 1 | 1.10mi |
| 3953 Mount Vernon Blvd Norton, OH | 2.0 | 1.0 | 1000 | $1,318 | $1.32 | 13d | 1 | 1.35mi |
| 105 2nd St SE Barberton, OH | 2.0 | 1.0 | 728 | $895 | $1.23 | 43d | 1 | 1.40mi |
| 149 2nd St SW Unit 149 Barberton, OH | 2.0 | 1.0 | 1037 | $1,100 | $1.06 | 14d | 1 | 1.46mi |
| 3943 Long Dr Norton, OH | 2.0 | 1.0–2.0 | 1200 | $1,508 | $1.26 | 13d | 5 | 1.48mi |
Listing history 4 events
-
2026-06-14statusdays on market $179,900 Pending 5 DOM
-
2026-06-10days on market $179,900 Active 2 DOM
-
2026-06-09remarks 699-char remark
-
2026-06-09$179,900 Active 1 DOM
ⓘ Source: listings_history table (triggers on properties + properties_extension) + one-shot
backfill from property_details.listing_events for pre-trigger history.
Tax reassessment forecast OH · Partial reset (capped growth)
- Current annual tax
- $1,886 · $157/mo
- Projected year-2 tax
- $2,346 · $196/mo
- Expected delta
- +$460/yr (+$38/mo · 24.4%)
ⓘ Screening estimate from a state-policy table — verify with the county assessor before closing.
Climate risk First Street
- Flood 1/10 Low FEMA zone X (unshaded) · 0% chance over 30 yrs
- Wildfire 1/10 Low
- Heat 3/10 Moderate 7 d/yr ≥98°F today · 17 d/yr by 30 yrs out
- Wind 1/10 Low
- Air quality 2/10 Low 0 unhealthy d/yr today · 1 by 30 yrs out
Nearby sold comps map
Loading sold comps map…
Walkable amenities ~0.75 mi
Loading nearby amenities…
Taxation est. · year 1
- Rental income
- $17,540
- − Mortgage interest
- −$10,077
- − Property taxes
- −$1,886
- − Insurance
- −$900
- − Repairs & maintenance
- −$1,403
- − Management
- −$1,403
- − Depreciation
- −$5,233
- Taxable loss
- −$3,363
- Est. tax savings @ 24.0%
- +$807
- After-tax cash flow
- $557/yr
For passive investors: Depreciation is non-cash, so a rental often shows a tax loss while cash-flowing — sheltering income. Rental losses are passive: they offset passive income freely, and up to $25,000/yr can offset ordinary (W-2) income if you actively participate and your MAGI is under $100k (phasing out to $0 by $150k); unused losses carry forward. On sale, claimed depreciation is recaptured at up to 25%, and gains may owe capital-gains tax (a 1031 exchange can defer both). Figures are a year-1 estimate at your 24.0% rate — not tax advice; consult a CPA.
Schools (NCES district)
- District
- Barberton City
- NCES district ID
- 3904353
- Math proficiency
- 47% ▼ -9.00%
- Reading proficiency
- 51% ▼ -9.00%
- Median HH income
- $37,660
- Composite
- 40.77/100
- National rank
- #3646
- State rank
- #466 of 656 in OH
Livability — Barberton
- Score
- 71/100
- State rank
- #428
- US rank
- #7016
Category grades
Schools grade is shown separately in the Schools card above.
Census & demographics
- Census place
- Barberton, OH
- County
- Summit County · 440,783 people
- City population
- 38,701
- Metro
- Akron, OH
- Population (ZIP)
- 38,701
- Household income
- $63,759
- Rent vs Own
- Severe rent burden
- 805.0
Population outlook (Summit County) Hauer SSP2
- Today (2025)
- 546,583 people
- By 2030
- 544,028 · -0.5%
- By 2040
- 531,363 · -2.8%
- By 2050
- 514,923 · -5.8%
- By 2075
- 481,765 · -11.9%
- By 2100
- 432,265 · -20.9%
Race, ethnicity, and origin ACS 2023
- Neighborhood character
- Predominantly White (86%)
- Race & ethnicity
- White 86% Black 7% Two or more races 5% Hispanic / Latino 1%
- Common ancestry
- Romanian 3% Slovak 2% Italian 1%
- Foreign-born
- 2% · Canada
- Languages at home
- 97% English-only · Russian/Polish/Slavic 1% Spanish 1%
Political lean MEDSL · Summit
- 2024 margin
- Lean D (+7.0) · D 53.0% · R 46.0%
- 2008→2024 swing
- -9.6pp toward R · 2008: 16.6pp · 2024: 7.0pp
- All cycles
- 2024: D+7.0 2020: D+9.6 2016: D+8.2 2012: D+14.8 2008: D+16.6
Not yet ingested
- Civics
- —
Market trends
- HPI YoY
- ▼ -224.82%
- Current HPI
- 199.8143
- Rent YoY
- ▲ 5.86%
- Metro
- Akron, OH
- State GDP YoY
- ▲ 1.98%
- F500 in state
- 48
Industry mix (Fortune 500 HQ in OH)
| Industry | F500 HQs | Revenue |
|---|---|---|
| Insurance | 3 | $145B |
|
||
| Industrial Machinery | 3 | $49B |
|
||
| Financial Services | 3 | $24B |
|
||
| Consumer Goods | 2 | $93B |
|
||
| Aerospace / Defense | 2 | $47B |
|
||
| Utilities | 2 | $33B |
|
||
Price history
+102.1% since first listed13 events — show timeline
- 2026-06-08 Listed $179,900 MLSNOW
- 2022-07-12 Sold (Public Records) $151,000 Public Records
- 2022-07-12 Sold (MLS) $151,000 MLSNOW
- 2022-06-12 Pending — MLSNOW
- 2022-06-07 Listed $159,900 MLSNOW
- 2021-07-01 Listing Removed — MLSNOW
- 2021-06-28 Price Changed $155,900 MLSNOW
- 2021-06-04 Relisted — MLSNOW
- 2021-05-28 Pending — MLSNOW
- 2021-05-24 Price Changed $159,900 MLSNOW
- 2021-05-12 Listed $169,900 MLSNOW
- 2021-05-03 Coming Soon — MLSNOW
- 2002-12-20 Sold (Public Records) $89,000 Public Records
Property tax history
+6.7%/yrLatest (2025): $1,886 · -2.2% YoY. Source: county tax records.
Cash-flow waterfall
monthlySold comps — $/sqft
last 12 mo · ≤1 miLoading sold comps…