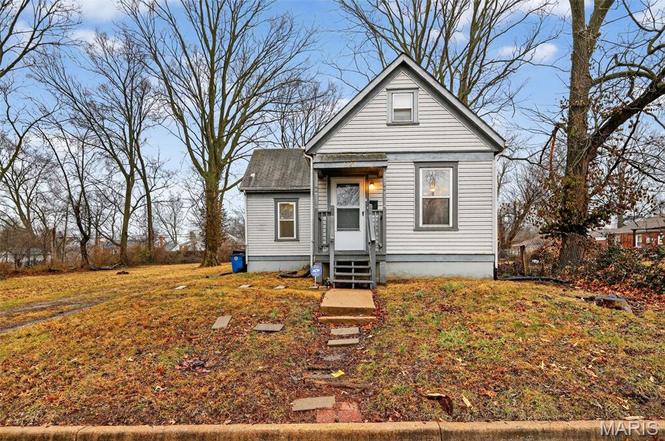
7724 Trenton Ave · University City, MO
Flood risk 1/10 · Minimal
- FEMA flood zone
- X (unshaded)
- Chance of flooding over 30 yrs
- 0.0%
- Est. flood insurance / yr
- $473 – $860
Fire risk 1/10 · Minimal
- Est. fire insurance / yr
- $1,054 – $1,958
Heat risk 5/10 · Moderate
- Hot days now (above 107°F)
- 7 days/yr
- Hot days in 30 yrs
- 21 days/yr
Wind risk 2/10 · Minimal
- Chance of severe wind over 30 yrs
- 1.0%
Air-quality risk 4/10 · Minor
- Unhealthy air days now
- 4 days/yr
- Unhealthy air days in 30 yrs
- 5 days/yr
Risk factors via First Street. Map © Google.
Why this score? — see what drove the B grade
The composite is a weighted blend of 9 inputs, each scored 0–100. Each bar is that input's sub-score; the figure is the points it added to the 100-point composite (weight × sub-score).
- Cash flow +29.6/30.0
- ARV discount +11.1/15.0
- DSCR +10.0/10.0
- 1% rule +8.2/10.0
- Livability +3.7/5.0
- Rent growth +3.4/5.0
- Condition / age +2.5/5.0
- Schools +1.9/10.0
- Appreciation +0.0/10.0
$109,900
🖨 Deal sheet 📄 Offer letter ✓ Due diligence
Listing remarks
Charming 1.5-story home in University City with inviting curb appeal and a covered front entry! Inside, you’ll find neutral colors and abundant natural light that create a warm and welcoming atmosphere throughout. The home features a spacious living room that flows into an open dining area, providing a comfortable layout for both everyday living and entertaining. The kitchen includes a refrigerator and range and offers space for a breakfast table, making it a bright and functional spot for casual meals. The primary bedroom suite is conveniently located on the main floor, offering privacy and comfort. Upstairs, you’ll find two additional bedrooms and a full bathroom, providing fl
Key facts
- Open dining area
- Partial basement
- Covered front entry
Tags
Neighborhood map
What this means for you Summary
Snapshot
- This is a 2-bed/2.0-bath single-family listed at $110k.
Deal economics
- At list price, monthly cash flow is $398 ($5k/yr) — positive.
- The deal already cash-flows at list — no discount required.
- Meets the 1% rule at list price ($1k rent vs $110k).
- Recommended offer: $107k (3.0% below list) — sets the bar for market timing.
- Cap rate 10.6% vs local median 4.9% in University City — top-decile yield for the area; either an underpriced asset or a hidden risk that comps aren't pricing in. Stress-test before assuming the spread holds.
Location & tenants
- Location reads 73/100 on livability (#84 in MO) — a middle-class / working-renter tenant base. Strengths: employment A+, housing A+, cost of living B; Watch: amenities D-, commute D-, health & safety F.
- University City (suburban): math 15% / reading 26% proficiency, ranked #297 of 324 in MO (top 92%) — low school quality limits family demand, transient renter base, plan for 1-2y turnover; 67% free/reduced lunch — lower-income household profile, screen leases tightly.
- Zoned schools: Barbara Jordan Elem. (math 8% / reading 22%, grade F, #982 of 1,115 statewide, top 89%, 310 students, 100% FRL); University City Sr. High (math 5% / reading 52%, grade F, #409 of 521 statewide, top 79%, 726 students, 100% FRL) — zoned schools average 100% FRL vs 67% district-wide (32 pts higher); higher-poverty schools than district average — tighter screening recommended.
- Market conditions: Rents rising (+3.6%/yr); 162 active listings in the ZIP; 20 comparable units currently listed for rent nearby; rentals at typical pace (median 24d on market — plan ~3-4 weeks tenant-placement turnaround); solid renter incomes; 920 units permitted in St. Louis County in 2024 (250 in 5+ unit buildings).
Forward outlook
- Local home prices are declining (-3.0%/yr); year-one equity from $760 of loan paydown is wiped out by about $3k of value loss. Plan a longer hold.
- At projected returns (-3.0% appreciation + 3.6% rent growth), your $31k cash investment doubles in ~8 years — after that, you're playing with house money.
Negotiation context
- It's been on market 39 days — a 3% lower offer ($107k) is reasonable based on typical stale-listing flexibility.
- Current owner paid $78k; 41% above their basis — modest negotiation headroom, anchor on the comps not their cost.
Risks & watch-outs
- Watch-outs: built in 1929 — expect roof / HVAC / electrical / plumbing capex.
- Climate carrying-cost: extreme-heat days projected 7→21/yr by 2055 (HVAC capex compounding) — expect insurance premiums to compound above CPI over the hold.
Questions for the listing agent
- It's been on market 39 days. Have you received any prior offers? Is the seller open to a 3% concession, seller financing, or rate buy-down credit?
- Built in 1929 — when were the roof, HVAC, electrical panel, plumbing, and water heater last replaced?
- Is there a deadline driving the sale (1031 exchange, divorce, estate, relocation)? That informs how much negotiation room exists.
- Schools are B-rated — typically a magnet for longer-tenancy family renters. What's the average tenant stay here, and is there a school-zone premium baked into asking?
- What's the average days-on-market for RENTAL listings here right now (not sales)? A rising rental-DOM trend means longer vacancies and softer asking-rent achievability than the comps imply.
- What's the recent tenant-quality profile in this submarket — average credit score on applications, eviction rate, late-payment / NSF rate, and stable-employment percentage? A property-management company in the area should have these aggregated.
- How much new for-sale + rental construction is in the pipeline within 1–3 miles? Heavy new supply typically softens prices + rents 12–24 months out; constrained supply supports both.
Investment metrics
- 1% rule
- 1.32% ✓
- Cap rate
- 10.64%
- Cash-on-cash
- 15.51%
- DSCR
- 1.69
- GRM
- 6.3
CMA / ARV
- ARV (on-the-fly)
- $119,325
- Comps found
- 12
Show comp detail 12 sales within ~0.75 mi
| Address | Dist | Beds/Ba | Sqft | Sold | Price | $/sf | Match |
|---|---|---|---|---|---|---|---|
| 7724 Trenton Ave | 0.00mi | 2/2.0 | 1,075 (0%) | 0mo | $109,900 | $102 | 100 |
| 7449 Trenton Ave | 0.33mi | 2/1.0 | 1,092 (+2%) | 4mo | $140,000 | $128 | 75 |
| 7504 Trenton | 0.30mi | 2/1.0 | 1,032 (-4%) | 2mo | $85,000 | $82 | 74 |
| 7530 Trenton Ave | 0.24mi | 3/1.0 (+1) | 1,124 (+5%) | 0mo | $125,000 | $111 | 72 |
| 1243 Fairview Ave | 0.48mi | 3/2.0 (+1) | 1,008 (-6%) | 1mo | $185,000 | $184 | 61 |
| 8305 Garfield Ave | 0.59mi | 2/1.0 | 1,014 (-6%) | 2mo | $104,900 | $103 | 58 |
| 7449 Wayne Ave | 0.35mi | 3/2.0 (+1) | 1,212 (+13%) | 2mo | $272,500 | $225 | 56 |
| 8008 Monroe Ave | 0.58mi | 3/1.0 (+1) | 1,138 (+6%) | 3mo | $69,900 | $61 | 52 |
| 7331 Wayne Ave | 0.63mi | 2/1.0 | 950 (-12%) | 1mo | $159,900 | $168 | 47 |
| 7952 Monroe Dr | 0.62mi | 2/1.0 | 960 (-11%) | 3mo | $73,900 | $77 | 46 |
| 1135 Wilshire Ave | 0.69mi | 2/1.0 | 962 (-10%) | 1mo | $190,000 | $198 | 45 |
| 8249 Appleton Dr | 0.74mi | 2/1.0 | 936 (-13%) | 2mo | $85,000 | $91 | 38 |
Match score weights: distance 35% · size 25% · config 20% · recency 20%. Top-matched comps best support the ARV.
Projected returns pro-forma
-3.0% appreciation · 3.61% rent growth · sell at horizon
- IRR
- 7.0%
- Equity multiple
- 1.27×
- Total profit
- $8,445
- Equity at exit
- $16,386
- IRR
- 16.8%
- Equity multiple
- 2.42×
- Total profit
- $43,777
- Equity at exit
- $9,502
Cash invested: $30,772 (down + closing). Projections, not guarantees.
Landlord ↔ Tenant lean methodology
- Overall (STATE)
- 81 Strongly Landlord-Friendly
- State Missouri
- 81 Strongly Landlord-Friendly · R+10
- County
- — inherits STATE
- City
- — inherits STATE
ZIP-level market 63130
- Rents YoY
- 3.6%
- Active inventory
- 162
- Price-to-rent
- 6.3×
Monthly cashflow live
- Estimated rent
- $1,453 high interval (Pro) →
- Mortgage (P&I)
- −$576
- Tax from tax record
- −$128 /mo · $1,539/yr
- Insurance
- −$46
- HOA
- −$0
- Vacancy / Maint / Mgmt
- −$305
- Net cashflow
- $398
Break-even live
UW: 25.0% down · 7.5% · 30yr · 1.5% tax · 5.0% vac · 8.0% maint · 8.0% mgmt
Financing live
Cash to close
- Down payment
- $27,475
- Closing costs
- $3,297
- Reserves months
- —
- Total cash needed
- —
Loan-product check · same deal, 3 products live
Conventional
25% down · 7.5% · 30yr
- Down + closing
- —
- Monthly P&I
- —
- Monthly cashflow
- —
- DSCR
- —
- Eligible?
- —
Personal DTI + credit; lowest rate.
DSCR
20% down · 8.5% · 30yr
- Down + closing
- —
- Monthly P&I
- —
- Monthly cashflow
- —
- DSCR
- —
- Eligible?
- —
No personal income docs; deal must DSCR.
Hard money
10% down · 12.0% · 12mo
- Down + closing
- —
- Monthly P&I
- —
- Monthly cashflow
- —
- DSCR
- —
- Eligible?
- —
Short-term bridge; refi at stabilization.
Rent comps 20 comps
| Address | Beds | Baths | Sqft | Rent | $/sqft | DOM | Units | Dist |
|---|---|---|---|---|---|---|---|---|
| 8449 Atherton Dr St. Louis, MO | 1.0–2.0 | 1.0 | 900 | $1,245 | $1.38 | 3d | 2 | 0.23mi |
| 7386 Milan Ave Saint Louis, MO | 2.0 | 1.0 | 960 | $1,400 | $1.46 | 4d | 1 | 0.48mi |
| 7430 Canton Ave Saint Louis, MO | 3.0 | 1.0 | 1075 | $1,450 | $1.35 | 23d | 1 | 0.48mi |
| 1351 N Hanley Rd Saint Louis, MO | 1.0–2.0 | 1.0–2.0 | 911 | $1,575 | $1.73 | 44d | 1 | 0.48mi |
| 1245 North and South Rd Saint Louis, MO | 2.0 | 1.0 | 860 | $1,200 | $1.40 | 15d | 1 | 0.50mi |
| 1276 Vaughan Dr Saint Louis, MO | 2.0 | 1.0 | 825 | $1,100 | $1.33 | 16d | 1 | 0.61mi |
| 1535 N Jackson Ave Saint Louis, MO | 2.0 | 1.0 | 988 | $1,450 | $1.47 | 44d | 1 | 0.65mi |
| 8246 Montreal Dr Saint Louis, MO | 2.0 | 1.0 | 850 | $1,450 | $1.71 | 44d | 1 | 0.72mi |
| 8303 Braddock Dr Saint Louis, MO | 2.0 | 1.0 | 720 | $1,075 | $1.49 | 23d | 1 | 0.72mi |
| 7361 Melrose Ave Saint Louis, MO | 3.0 | 2.0 | 1278 | $2,095 | $1.64 | 44d | 1 | 0.74mi |
| 7720 Ahern Ave University City, MO | 2.0 | 1.0 | 1080 | $1,350 | $1.25 | 44d | 1 | 0.83mi |
| 1086 Wilshire Ave Saint Louis, MO | 2.0 | 1.0 | 1080 | $1,306 | $1.21 | 4d | 1 | 0.84mi |
| 978 Warder Ave University City, MO | 3.0 | 1.5 | 1100 | $1,145 | $1.04 | 23d | 1 | 0.96mi |
| 7737 Wild Plum Ln University City, MO | 3.0 | 1.5 | 900 | $1,200 | $1.33 | 12d | 1 | 0.97mi |
| 1115 Backer St Saint Louis, MO | 3.0 | 1.0 | 984 | $1,495 | $1.52 | 23d | 1 | 1.08mi |
| 7034 Corbitt Ave Saint Louis, MO | 2.0 | 2.0 | 870 | $1,450 | $1.67 | 23d | 1 | 1.36mi |
| 910 N McKnight Rd St. Louis, MO | 2.0 | 2.0 | 1400 | $2,500 | $1.79 | 2d | 1 | 1.43mi |
| 7350 Amherst Ave Unit 1E University City, MO | 2.0 | 1.0 | 1100 | $1,795 | $1.63 | 18d | 1 | 1.45mi |
| 7254 Tulane Ave #1 University City, MO | 2.0 | 1.0 | 1144 | $1,600 | $1.40 | 18d | 1 | 1.49mi |
| 8669 Old Towne Dr St. Louis, MO | 1.0–3.0 | 1.0–2.0 | 1335 | $1,602 | $1.20 | 2d | 9 | 1.49mi |
Listing history 8 events
-
2026-04-15status Pending
-
2026-03-06$109,900 Active
-
2022-02-23soldstatus $77,980
-
2013-04-22soldstatus $966,000
-
2002-07-01soldstatus $50,000
-
2000-08-01soldstatus $10,500
-
1997-10-27soldstatus
-
1997-04-16soldstatus
ⓘ Source: listings_history table (triggers on properties + properties_extension) + one-shot
backfill from property_details.listing_events for pre-trigger history.
Tax reassessment forecast MO · Resets to sale price
- Current annual tax
- $1,539 · $128/mo
- Projected year-2 tax
- $1,539 · $128/mo
- Expected delta
- $0/yr ($0/mo · 0.0%)
ⓘ Screening estimate from a state-policy table — verify with the county assessor before closing.
Climate risk First Street
- Flood 1/10 Low FEMA zone X (unshaded) · 0% chance over 30 yrs
- Wildfire 1/10 Low
- Heat 5/10 Major 7 d/yr ≥107°F today · 21 d/yr by 30 yrs out
- Wind 2/10 Low 100% chance of damaging wind over 30 yrs
- Air quality 4/10 Moderate 4 unhealthy d/yr today · 5 by 30 yrs out
Nearby sold comps map
Loading sold comps map…
Walkable amenities ~0.75 mi
Loading nearby amenities…
Taxation est. · year 1
- Rental income
- $17,441
- − Mortgage interest
- −$6,156
- − Property taxes
- −$1,539
- − Insurance
- −$550
- − Repairs & maintenance
- −$1,395
- − Management
- −$1,395
- − Depreciation
- −$3,197
- Taxable income
- $3,209
- Est. tax owed @ 24.0%
- −$770
- After-tax cash flow
- $4,004/yr
For passive investors: Depreciation is non-cash, so a rental often shows a tax loss while cash-flowing — sheltering income. Rental losses are passive: they offset passive income freely, and up to $25,000/yr can offset ordinary (W-2) income if you actively participate and your MAGI is under $100k (phasing out to $0 by $150k); unused losses carry forward. On sale, claimed depreciation is recaptured at up to 25%, and gains may owe capital-gains tax (a 1031 exchange can defer both). Figures are a year-1 estimate at your 24.0% rate — not tax advice; consult a CPA.
Schools (NCES district)
- District
- University City
- NCES district ID
- 2930660
- Math proficiency
- 15% ▼ -10.00%
- Reading proficiency
- 26% ▼ -7.00%
- Median HH income
- $52,927
- Composite
- 18.57/100
- National rank
- #8910
- State rank
- #297 of 324 in MO
Livability — University City
- Score
- 73/100
- State rank
- #84
- US rank
- #5618
Category grades
Schools grade is shown separately in the Schools card above.
Census & demographics
- Census place
- University City, MO
- County
- Saint Louis County · 888,823 people
- City population
- 28,910
- Metro
- St. Louis, MO-IL
- Population (ZIP)
- 28,910
- Household income
- $85,823
- Rent vs Own
- Severe rent burden
- 893.0
Population outlook (St. Louis County) Hauer SSP2
- Today (2025)
- 1,025,227 people
- By 2030
- 1,028,023 · +0.3%
- By 2040
- 1,020,940 · -0.4%
- By 2050
- 1,007,280 · -1.8%
- By 2075
- 987,277 · -3.7%
- By 2100
- 921,984 · -10.1%
Race, ethnicity, and origin ACS 2023
- Neighborhood character
- Diverse neighborhood (Simpson 0.61)
- Race & ethnicity
- White 54% Black 31% Asian 6% Two or more races 6% Hispanic / Latino 4%
- Common ancestry
- Italian 3% Romanian 3% Lithuanian 2%
- Foreign-born
- 11% · China, Canada, Vietnam
- Languages at home
- 89% English-only · Chinese 4% Spanish 2% French/Haitian/Cajun 1%
Political lean MEDSL · St. Louis
- 2024 margin
- Strong D (+23.4) · D 60.8% · R 37.4% · Other 1.7%
- 2008→2024 swing
- +3.5pp toward D · 2008: 19.9pp · 2024: 23.4pp
- All cycles
- 2024: D+23.4 2020: D+24.0 2016: D+16.2 2012: D+13.7 2008: D+19.9
Not yet ingested
- Civics
- —
Market trends
- HPI YoY
- ▼ -436.88%
- Current HPI
- 185.599
- Rent YoY
- ▲ 3.61%
- Metro
- St. Louis, MO-IL
- State GDP YoY
- ▲ 1.84%
- F500 in state
- 20
Industry mix (Fortune 500 HQ in MO)
| Industry | F500 HQs | Revenue |
|---|---|---|
| Healthcare | 1 | $163B |
|
||
| Insurance | 1 | $21B |
|
||
| Industrial Technology | 1 | $17B |
|
||
| Retail | 1 | $16B |
|
||
| Industrial Distribution | 1 | $10B |
|
||
| Utilities | 1 | $9B |
|
||
Price history
+946.7% since first listed8 events — show timeline
- 2026-04-15 Pending — MARIS as Distributed by MLS Grid
- 2026-03-06 Listed $109,900 MARIS as Distributed by MLS Grid
- 2022-02-23 Sold (Public Records) $77,980 Public Records
- 2013-04-22 Sold (Public Records) $966,000 Public Records
- 2002-07-01 Sold (Public Records) $50,000 Public Records
- 2000-08-01 Sold (Public Records) $10,500 Public Records
- 1997-10-27 Sold (Public Records) — Public Records
- 1997-04-16 Sold (Public Records) — Public Records
Property tax history
+16.0%/yrLatest (2022): $1,539 · +1.0% YoY. Source: county tax records.
Cash-flow waterfall
monthlySold comps — $/sqft
last 12 mo · ≤1 miLoading sold comps…