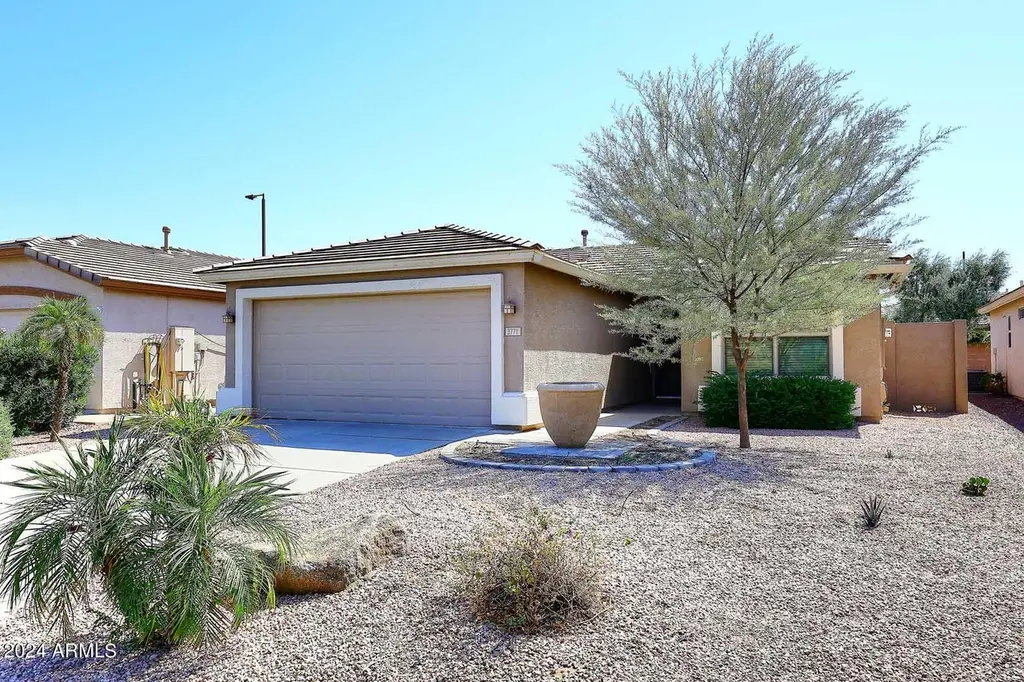
3771 E Hazeltine Way · Chandler, AZ
Flood risk 1/10 · Minimal
- FEMA flood zone
- X (shaded)
- Chance of flooding over 30 yrs
- 0.0%
- Est. flood insurance / yr
- $507 – $1,088
Fire risk 7/10 · Major
- Est. fire insurance / yr
- $610 – $1,132
Heat risk 9/10 · Severe
- Hot days now (above 112°F)
- 7 days/yr
- Hot days in 30 yrs
- 19 days/yr
Wind risk 1/10 · Minimal
- Chance of severe wind over 30 yrs
- —
Air-quality risk 1/10 · Minimal
- Unhealthy air days now
- 0 days/yr
- Unhealthy air days in 30 yrs
- 0 days/yr
Risk factors via First Street. Map © Google.
Why this score? — see what drove the D grade
The composite is a weighted blend of 9 inputs, each scored 0–100. Each bar is that input's sub-score; the figure is the points it added to the 100-point composite (weight × sub-score).
- Cash flow +10.7/30.0
- ARV discount +9.8/15.0
- Schools +4.8/10.0
- Livability +3.9/5.0
- Rent growth +3.3/5.0
- DSCR +3.1/10.0
- 1% rule +2.6/10.0
- Condition / age +2.5/5.0
- Appreciation +0.0/10.0
$385,000
🖨 Deal sheet (PDF) 📄 Offer letter ✓ Due diligence
Listing remarks MLS
Single story GEM in the heart of the Solera Springfield Lakes adult community. Features include: 9+ ceiling in great room, tiled entry, extended covered patio in the south facing backyard & low maintenance landscaping. Neutral paint in this 2 bed/2 bath popular split floorplan features easy living. A great lock & leave for the seasonal owner. OR...perfect for a full time resident. Community has public golf course, lakes, rec center, walking paths and more. Welcome Home!
Key facts
- Public golf course
- Walking paths
- 4,464 sq ft lot
Tags
Neighborhood map
What this means for you Summary
Snapshot
- This is a 2-bed/3.0-bath single-family listed at $385k.
Deal economics
- At list price, monthly cash flow is $-185 ($-2k/yr) — negative.
- To cash-flow at today's rent, offer at most $352k (8.5% below list).
- To meet the 1% rule (rent ≥ 1% of price), the offer needs to be $293k (23.8% below list).
- Recommended offer: $293k (23.8% below list) — sets the bar for 1% rule.
- Cap rate 5.7% vs local median 3.3% in Chandler — top-decile yield for the area; either an underpriced asset or a hidden risk that comps aren't pricing in. Stress-test before assuming the spread holds.
Location & tenants
- Location reads 78/100 on livability (#9 in AZ, #2,508 nationally) — a middle-class / working-renter tenant base. Strengths: employment A+, housing A+, crime A-; Watch: health & safety D, cost of living D-.
- Chandler Unified District #80 (4242) (suburban): math 49% / reading 57% proficiency, ranked #31 of 249 in AZ (top 12%) — acceptable for families but not a draw, mixed tenant base, ~2y average lease.
- Zoned schools: Knox Gifted Academy (math 90% / reading 97%, grade A+, #1 of 1,109 statewide, top 0%, 672 students, 6% FRL); Willie & Coy Payne Jr. High (math 47% / reading 53%, grade C, #26 of 218 statewide, top 12%, 1,143 students, 11% FRL); Arizona College Prep High School (math 91% / reading 83%, grade A, #2 of 381 statewide, top 0%, 1,775 students, 7% FRL) — zoned schools average 8% FRL vs 25% district-wide (17 pts lower); this property's tenant base skews higher-income than the district average.
- Zoned-school proficiency averages 77% at this address vs 53% district-wide (+24 pts) — the actual schools serving this property are materially stronger than the Chandler Unified District #80 (4242) average implies; a family-tenant draw the district grade alone would hide.
- Market conditions: Rents rising (+3.0%/yr); 298 active listings in the ZIP; 6 comparable units currently listed for rent nearby; rentals at typical pace (median 17d on market — plan ~3-4 weeks tenant-placement turnaround); high-income renter base; 36,011 units permitted in Maricopa County in 2024 (12,801 in 5+ unit buildings).
Forward outlook
- Local home prices are declining (-3.0%/yr); year-one equity from $3k of loan paydown is wiped out by about $12k of value loss. Plan a longer hold.
- Maricopa County population projected at +38% by 2050 — long-run rental-demand tailwind backs the buy-and-hold thesis.
Negotiation context
- It's been on market 116 days — a 9% lower offer ($350k) is reasonable based on typical stale-listing flexibility.
- 4 sale attempts since 11y ago with the ask held roughly flat each time — persistent listings suggest the price (not the market) is what's stuck; bring a comps-based counter.
Risks & watch-outs
- Climate carrying-cost: major wildfire risk; extreme-heat days projected 7→19/yr by 2055 (HVAC capex compounding) — expect insurance premiums to compound above CPI over the hold.
Questions for the listing agent
- What do current leases actually rent for vs. the listed asking? Can we see a recent rent roll and the last 12 months of T-12 income?
- It's been on market 116 days. Have you received any prior offers? Is the seller open to a 24% concession, seller financing, or rate buy-down credit?
- What does the HOA fee cover, when was the last increase, and are there any pending special assessments or reserve-fund shortfalls?
- Why hasn't it sold? Are there any deal-killer items the seller is aware of (foundation, flood, title, zoning, code violations)?
- Is there a deadline driving the sale (1031 exchange, divorce, estate, relocation)? That informs how much negotiation room exists.
- Schools are B-rated — typically a magnet for longer-tenancy family renters. What's the average tenant stay here, and is there a school-zone premium baked into asking?
- The area grade is low — what's the realistic commute time and amenity access for the typical tenant pool here? Any planned neighborhood developments (good or bad) we should know about?
- What's the average days-on-market for RENTAL listings here right now (not sales)? A rising rental-DOM trend means longer vacancies and softer asking-rent achievability than the comps imply.
- What's the recent tenant-quality profile in this submarket — average credit score on applications, eviction rate, late-payment / NSF rate, and stable-employment percentage? A property-management company in the area should have these aggregated.
- How much new for-sale + rental construction is in the pipeline within 1–3 miles? Heavy new supply typically softens prices + rents 12–24 months out; constrained supply supports both.
Investment metrics
- 1% rule
- 0.76% ✗
- Cap rate
- 5.72%
- Cash-on-cash
- -2.06%
- DSCR
- 0.91
- GRM
- 10.9
CMA / ARV
- ARV (median comp)
- $405,889
- List price
- $385,000
- Delta
- -5.15%
- Verdict
- FAIR
- Comps
- 20 within 1.0 mi
Show comp detail 12 sales within ~0.75 mi
| Address | Dist | Beds/Ba | Sqft | Sold | Price | $/sf | Match |
|---|---|---|---|---|---|---|---|
| 3590 E Gleneagle Pl | 0.14mi | 2/2.0 | 1,149 (-1%) | 3mo | $409,900 | $357 | 85 |
| 3649 E Hazeltine Way | 0.11mi | 2/2.0 | 1,158 (0%) | 8mo | $373,500 | $323 | 84 |
| 3739 E Hazeltine Way | 0.03mi | 2/2.0 | 1,200 (+4%) | 6mo | $375,000 | $313 | 83 |
| 3688 E Peach Tree Dr | 0.16mi | 2/2.0 | 1,158 (0%) | 19mo | $375,000 | $324 | 72 |
| 3959 E LA Costa Dr | 0.50mi | 2/2.0 | 1,158 (0%) | 1mo | $419,000 | $362 | 72 |
| 3529 E Hazeltine Way | 0.19mi | 2/2.0 | 1,149 (-1%) | 18mo | $385,500 | $336 | 70 |
| 6634 S Pinnacle Ct | 0.31mi | 2/2.0 | 1,158 (0%) | 15mo | $435,000 | $376 | 69 |
| 6954 S Whetstone Pl | 0.30mi | 2/2.0 | 1,158 (0%) | 17mo | $410,000 | $354 | 68 |
| 3450 E Firestone Dr | 0.27mi | 2/2.0 | 1,158 (0%) | 19mo | $410,000 | $354 | 68 |
| 6317 S Pinaleno Pl | 0.66mi | 2/2.0 | 1,158 (0%) | 1mo | $367,000 | $317 | 64 |
| 3920 E Runaway Bay Pl | 0.62mi | 2/2.0 | 1,158 (0%) | 4mo | $390,000 | $337 | 64 |
| 3056 E Palm Beach Dr | 0.59mi | 2/2.0 | 1,149 (-1%) | 11mo | $384,500 | $335 | 58 |
Match score weights: distance 35% · size 25% · config 20% · recency 20%. Top-matched comps best support the ARV.
Projected returns pro-forma
-3.0% appreciation · 3.05% rent growth · sell at horizon
- IRR
- -19.7%
- Equity multiple
- 0.31×
- Total profit
- $-74,069
- Equity at exit
- $57,405
- IRR
- -12.4%
- Equity multiple
- 0.26×
- Total profit
- $-79,272
- Equity at exit
- $33,288
Cash invested: $107,800 (down + closing). Projections, not guarantees.
Landlord ↔ Tenant lean methodology
- Overall (STATE)
- 87 Strongly Landlord-Friendly
- State Arizona
- 87 Strongly Landlord-Friendly · R+3
- County
- — inherits STATE
- City
- — inherits STATE
ZIP-level market 85249
- Home prices YoY
- -13.6%
- Rents YoY
- 3.0%
- Active inventory
- 298
- Price-to-rent
- 10.9×
Monthly cashflow live
- Estimated rent
- $2,933 high interval (Pro) →
- Mortgage (P&I)
- −$2,019
- Tax from tax record
- −$149 /mo · $1,787/yr
- Insurance
- −$160
- HOA
- −$174
- Vacancy / Maint / Mgmt
- −$616
- Net cashflow
- $-185
Break-even live
Sensitivity live
| Price | -10% $33 | -5% $-76 | +0% $-185 | +5% $-294 | +10% $-403 |
|---|---|---|---|---|---|
| Rent | -10% $-417 | -5% $-301 | +0% $-185 | +5% $-69 | +10% $47 |
| Rate | -1.0pp $9 | -0.5pp $-87 | base $-185 | +0.5pp $-285 | +1.0pp $-386 |
UW: 25.0% down · 7.5% · 30yr · 1.5% tax · 5.0% vac · 8.0% maint · 8.0% mgmt
Financing live
Cash to close
- Down payment
- $96,250
- Closing costs
- $11,550
- Reserves months
- —
- Total cash needed
- —
Loan-product check · same deal, 3 products live
Conventional
25% down · 7.5% · 30yr
- Down + closing
- —
- Monthly P&I
- —
- Monthly cashflow
- —
- DSCR
- —
- Eligible?
- —
Personal DTI + credit; lowest rate.
DSCR
20% down · 8.5% · 30yr
- Down + closing
- —
- Monthly P&I
- —
- Monthly cashflow
- —
- DSCR
- —
- Eligible?
- —
No personal income docs; deal must DSCR.
Hard money
10% down · 12.0% · 12mo
- Down + closing
- —
- Monthly P&I
- —
- Monthly cashflow
- —
- DSCR
- —
- Eligible?
- —
Short-term bridge; refi at stabilization.
Rent comps 6 comps
| Address | Beds | Baths | Sqft | Rent | $/sqft | DOM | Units | Dist |
|---|---|---|---|---|---|---|---|---|
| 6457 S Pinaleno Pl Chandler, AZ | 2.0 | 2.0 | 1149 | $2,500 | $2.18 | 45d | 1 | 0.53mi |
| 3352 E Cherry Hills Pl Chandler, AZ | 2.0 | 2.0 | 1344 | $3,500 | $2.60 | 3d | 1 | 0.83mi |
| 4133 E Cherry Hills Dr Chandler, AZ | 3.0 | 2.0 | 1374 | $2,600 | $1.89 | 20d | 1 | 0.84mi |
| 6075 S Gilbert Rd Chandler, AZ | 1.0–2.0 | 1.0–2.0 | 837 | $2,295 | $2.74 | 0d | 10 | 0.98mi |
| 6450 S Nash Way Chandler, AZ | 2.0 | 2.0 | 1240 | $2,300 | $1.85 | 16d | 1 | 1.21mi |
| 5900 S Gilbert Rd Chandler, AZ | 3.0 | 2.0 | 1500 | $6,800 | $4.53 | 0d | 1 | 1.25mi |
HOA detail
- Monthly dues
- $174 · $2,088/yr
- Likely covers
- landscaping
Listing history 23 events
-
2026-06-10days on market $385,000 Active 116 DOM
-
2026-06-07days on market $385,000 Active 115 DOM
-
2026-06-04days on market $385,000 Active 112 DOM
-
2026-06-03days on market $385,000 Active 111 DOM
-
2026-06-02days on market $385,000 Active 110 DOM
-
2026-06-01days on market $385,000 Active 109 DOM
-
2026-05-31days on market $385,000 Active 108 DOM
-
2026-02-12$385,000 Active 485-char remark
Show marketing remark (485 chars)
Single story GEM in the heart of the Solera Springfield Lakes adult community. Features include: 9+ ceiling in great room, tiled entry, extended covered patio in the south facing backyard & low maintenance landscaping. Neutral paint in this 2 bed/2 bath popular split floorplan features easy living. A great lock & leave for the seasonal owner. OR...perfect for a full time resident. Community has public golf course, lakes, rec center, walking paths and more. Welcome Home!
-
2025-12-09historical
-
2025-06-25price $409,000
-
2025-03-25price $414,000
-
2024-09-30$419,000 Active
-
2024-04-22soldstatus $370,000 Closed
-
2024-04-22soldstatus $370,000
-
2024-04-10status Pending
-
2024-02-09price $399,000
-
2024-01-17price $404,000
-
2024-01-02$415,000 Active
-
2015-05-07soldstatus $185,000 Closed
-
2015-05-07soldstatus $185,000
-
2015-04-21status Pending
-
2015-03-29historical Under Contract Accepting Backups
-
2015-01-20$189,900 Active
ⓘ Source: listings_history table (triggers on properties + properties_extension) + one-shot
backfill from property_details.listing_events for pre-trigger history.
Tax reassessment forecast AZ · Resets to sale price
- Current annual tax
- $1,787 · $149/mo
- Projected year-2 tax
- $2,541 · $212/mo
- Expected delta
- +$754/yr (+$63/mo · 42.2%)
ⓘ Screening estimate from a state-policy table — verify with the county assessor before closing.
Climate risk First Street
- Flood 1/10 Low FEMA zone X (shaded) · 0% chance over 30 yrs
- Wildfire 7/10 Severe
- Heat 9/10 Extreme 7 d/yr ≥112°F today · 19 d/yr by 30 yrs out
- Wind 1/10 Low
- Air quality 1/10 Low 0 unhealthy d/yr today · 0 by 30 yrs out
Nearby sold comps map
Loading sold comps map…
Walkable amenities ~0.75 mi
Loading nearby amenities…
Taxation est. · year 1
- Rental income
- $35,202
- − Mortgage interest
- −$21,566
- − Property taxes
- −$1,787
- − Insurance
- −$1,925
- − Repairs & maintenance
- −$2,816
- − Management
- −$2,816
- − HOA
- −$2,088
- − Depreciation
- −$11,200
- Taxable loss
- −$8,997
- Est. tax savings @ 24.0%
- +$2,159
- After-tax cash flow
- $-60/yr
For passive investors: Depreciation is non-cash, so a rental often shows a tax loss while cash-flowing — sheltering income. Rental losses are passive: they offset passive income freely, and up to $25,000/yr can offset ordinary (W-2) income if you actively participate and your MAGI is under $100k (phasing out to $0 by $150k); unused losses carry forward. On sale, claimed depreciation is recaptured at up to 25%, and gains may owe capital-gains tax (a 1031 exchange can defer both). Figures are a year-1 estimate at your 24.0% rate — not tax advice; consult a CPA.
Schools (NCES district)
- District
- Chandler Unified District #80 (4242)
- NCES district ID
- 0401870
- Math proficiency
- 49% ▼ -8.00%
- Reading proficiency
- 57% ▼ -2.00%
- Median HH income
- $74,048
- Composite
- 47.54/100
- National rank
- #2268
- State rank
- #31 of 249 in AZ
Livability — Chandler
- Score
- 78/100
- State rank
- #9
- US rank
- #2508
Category grades
Schools grade is shown separately in the Schools card above.
Census & demographics
- Census place
- Chandler, AZ
- County
- Maricopa County · 4,537,380 people
- City population
- 299,016
- Metro
- Phoenix-Mesa-Chandler, AZ
- Population (ZIP)
- 48,746
- Household income
- $153,633
- Rent vs Own
- Severe rent burden
- 304.0
Population outlook (Maricopa County) Hauer SSP2
- Today (2025)
- 4,979,203 people
- By 2030
- 5,378,229 · +8.0%
- By 2040
- 6,156,598 · +23.6%
- By 2050
- 6,872,376 · +38.0%
- By 2075
- 8,401,270 · +68.7%
- By 2100
- 9,247,439 · +85.7%
Race, ethnicity, and origin ACS 2023
- Neighborhood character
- Predominantly White (66%)
- Race & ethnicity
- White 66% Hispanic / Latino 12% Asian 12% Two or more races 11% Black 3% Native American 1%
- Hispanic origin (detail)
- Mexican 8%
- Common ancestry
- Romanian 3% Slovak 2% Lithuanian 2%
- Foreign-born
- 13% · China, Canada, Vietnam
- Languages at home
- 84% English-only · Spanish 4% Chinese 3% Other Indo-European 3%
Political lean MEDSL · Maricopa
- 2024 margin
- Toss-up / Even · D 47.7% · R 51.2% · Other 1.1%
- 2008→2024 swing
- +7.1pp toward D · 2008: -10.6pp · 2024: -3.5pp
- All cycles
- 2024: R+3.5 2020: D+2.2 2016: R+3.5 2012: R+12.0 2008: R+10.6
Not yet ingested
- Civics
- —
Market trends
- HPI YoY
- ▼ -47.22%
- Current HPI
- 299.4196
- Rent YoY
- ▲ 3.05%
- Metro
- Phoenix-Mesa-Chandler, AZ
- State GDP YoY
- ▲ 4.54%
- F500 in state
- 20
Industry mix (Fortune 500 HQ in AZ)
| Industry | F500 HQs | Revenue |
|---|---|---|
| Technology | 2 | $13B |
|
||
| Mining / Metals | 1 | $23B |
|
||
| Environmental Services | 1 | $16B |
|
||
| Metals / Steel | 1 | $14B |
|
||
| Technology Distribution | 1 | $9B |
|
||
| Homebuilding | 1 | $8B |
|
||
Price history
+102.7% since first listed16 events — show timeline
- 2026-02-12 Listed $385,000 ARMLS
- 2025-12-09 Listing Removed — ARMLS
- 2025-06-25 Price Changed $409,000 ARMLS
- 2025-03-25 Price Changed $414,000 ARMLS
- 2024-09-30 Listed $419,000 ARMLS
- 2024-04-22 Sold (Public Records) $370,000 Public Records
- 2024-04-22 Sold (MLS) $370,000 ARMLS
- 2024-04-10 Pending — ARMLS
- 2024-02-09 Price Changed $399,000 ARMLS
- 2024-01-17 Price Changed $404,000 ARMLS
- 2024-01-02 Listed $415,000 ARMLS
- 2015-05-07 Sold (Public Records) $185,000 Public Records
- 2015-05-07 Sold (MLS) $185,000 ARMLS
- 2015-04-21 Pending — ARMLS
- 2015-03-29 Contingent — ARMLS
- 2015-01-20 Listed $189,900 ARMLS
Property tax history
+2.6%/yrLatest (2025): $1,787 · +1.4% YoY. Source: county tax records.
Cash-flow waterfall
monthlySold comps — $/sqft
last 12 mo · ≤1 miLoading sold comps…