 🏗️ New Construction
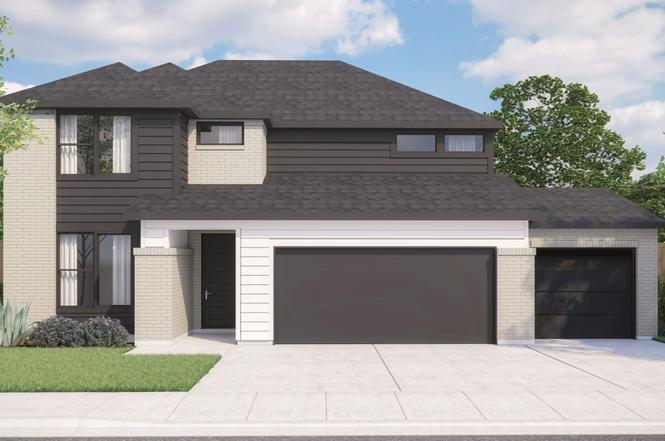
Sawyer - Bear Ridge Plan · Burleson, TX
Flood risk No data
- FEMA flood zone
- —
- Chance of flooding over 30 yrs
- —
- Est. flood insurance / yr
- —
Fire risk No data
- Est. fire insurance / yr
- —
Heat risk No data
- Hot days now (above threshold)
- —
- Hot days in 30 yrs
- —
Wind risk No data
- Chance of severe wind over 30 yrs
- —
Air-quality risk No data
- Unhealthy air days now
- —
- Unhealthy air days in 30 yrs
- —
Risk factors via First Street. Map © Google.
Why this score? — see what drove the C- grade
The composite is a weighted blend of 9 inputs, each scored 0–100. Each bar is that input's sub-score; the figure is the points it added to the 100-point composite (weight × sub-score).
- Cash flow +18.3/30.0
- ARV discount +7.5/15.0
- DSCR +5.7/10.0
- 1% rule +4.9/10.0
- Condition / age +4.8/5.0
- Schools +4.5/10.0
- Livability +4.0/5.0
- Rent growth +2.9/5.0
- Appreciation +0.0/10.0
$494,900
🖨 Deal sheet 📄 Offer letter ✓ Due diligence
Listing remarks
Now Pre-Selling! Introducing Bear Ridge-where elevated living is thoughtfully designed and beautifully built. From extended garage space to carefully selected finishes and enduring materials, every detail reflects intentional craftsmanship and everyday livability. Ideally located near shopping, dining, and daily conveniences, Bear Ridge offers timeless design, modern comfort, and a location that supports the way you live today-and for years to come.
Key facts
- Modern comfort
- Enduring materials
- Timeless design
Tags
Property features AI
Finance
- Financial info: List price $494,900
Exterior
- Parking: 3 parking spaces (3-car garage)
- Home design: New construction plan; Plan: Sawyer - Bear Ridge
- Construction: Living area approximately 2960; Built as part of 2026 inventory (Plan)
- Exterior features: Property is a plan model; Located on SW Wilshire Blvd, Burleson, TX
Interior
- Bedrooms: 4 bedrooms
- Bathrooms: 2 full bathrooms and 1 half bathroom (2.5 total)
- Interior features: Open living spaces (plan model); Plan name: Sawyer - Bear Ridge
Neighborhood map
What this means for you Summary
Snapshot
- This is a 4-bed/2.5-bath single-family listed at $495k. Condition is rated excellent.
Deal economics
- At list price, monthly cash flow is $492 ($6k/yr) — positive.
- The deal already cash-flows at list — no discount required.
- Meets the 1% rule at list price ($5k rent vs $495k).
- Cap rate 7.4% vs local median 3.5% in Burleson — top-decile yield for the area; either an underpriced asset or a hidden risk that comps aren't pricing in. Stress-test before assuming the spread holds.
Location & tenants
- Location reads 79/100 on livability (#53 in TX, #2,133 nationally) — a middle-class / working-renter tenant base. Strengths: employment A+, cost of living A+, housing A+; Watch: amenities F, commute F.
- Joshua ISD (rural): math 52% / reading 50% proficiency, ranked #139 of 826 in TX (top 17%) — acceptable for families but not a draw, mixed tenant base, ~2y average lease.
- Market conditions: Rents rising (+1.8%/yr); 679 active listings in the ZIP; 5 comparable units currently listed for rent nearby; rentals at typical pace (median 22d on market — plan ~3-4 weeks tenant-placement turnaround); solid renter incomes; 2,152 units permitted in Johnson County in 2024 (76 in 5+ unit buildings).
- At $5,361/mo this rent would consume 64% of the median local household income ($101k/yr) (locally 1117% of renters already pay >50% of income on rent) — very limited rent-growth headroom before tenants either downsize or default.
Forward outlook
- Local home prices are declining (-3.0%/yr); year-one equity from $4k of loan paydown is wiped out by about $16k of value loss. Plan a longer hold.
- Johnson County population projected at +24% by 2050 — long-run rental-demand tailwind backs the buy-and-hold thesis.
Negotiation context
- Only 2 days on market — expect competitive offers; lowballing is unlikely to land.
Questions for the listing agent
- Is there a deadline driving the sale (1031 exchange, divorce, estate, relocation)? That informs how much negotiation room exists.
- What's the average days-on-market for RENTAL listings here right now (not sales)? A rising rental-DOM trend means longer vacancies and softer asking-rent achievability than the comps imply.
- What's the recent tenant-quality profile in this submarket — average credit score on applications, eviction rate, late-payment / NSF rate, and stable-employment percentage? A property-management company in the area should have these aggregated.
- How much new for-sale + rental construction is in the pipeline within 1–3 miles? Heavy new supply typically softens prices + rents 12–24 months out; constrained supply supports both.
Investment metrics
- 1% rule
- 0.99% ✗
- Cap rate
- 7.38%
- Cash-on-cash
- 3.89%
- DSCR
- 1.17
- GRM
- 8.4
CMA / ARV
- ARV (on-the-fly)
- $541,680
- Comps found
- 12
Show comp detail 12 sales within ~0.75 mi
| Address | Dist | Beds/Ba | Sqft | Sold | Price | $/sf | Match |
|---|---|---|---|---|---|---|---|
| 2609 Steve St | 0.60mi | 4/3.5 | 3,124 (+6%) | 0mo | $549,900 | $176 | 58 |
| 2605 Lila St | 0.54mi | 5/4.0 (+1) | 2,873 (-3%) | 3mo | $524,900 | $183 | 57 |
| 300 Ben Thomas St | 0.75mi | 4/2.5 | 3,118 (+5%) | 1mo | $449,999 | $144 | 55 |
| 2621 Lila St | 0.57mi | 4/3.0 | 2,752 (-7%) | 7mo | $474,900 | $173 | 54 |
| 2717 River Path Ct | 0.70mi | 3/2.5 (-1) | 3,005 (+2%) | 8mo | $540,000 | $180 | 53 |
| 333 Tony St | 0.71mi | 4/3.0 | 2,791 (-6%) | 6mo | $529,900 | $190 | 50 |
| 2605 Steve St | 0.59mi | 4/2.5 | 2,589 (-12%) | 5mo | $474,900 | $183 | 47 |
| 305 Aurora Hills Trl | 0.51mi | 4/3.0 | 2,527 (-15%) | 4mo | $449,900 | $178 | 47 |
| 2613 Lee St | 0.67mi | 4/3.0 | 2,646 (-11%) | 6mo | $499,900 | $189 | 44 |
| 328 Alina St | 0.61mi | 3/2.5 (-1) | 2,589 (-12%) | 3mo | $484,990 | $187 | 43 |
| 2747 Elmwood Dr | 0.75mi | 4/3.0 | 3,364 (+14%) | 1mo | $514,900 | $153 | 40 |
| 2636 Lila St | 0.63mi | 3/3.0 (-1) | 2,527 (-15%) | 1mo | $499,900 | $198 | 38 |
Match score weights: distance 35% · size 25% · config 20% · recency 20%. Top-matched comps best support the ARV.
Projected returns pro-forma
-3.0% appreciation · 1.78% rent growth · sell at horizon
- IRR
- -11.6%
- Equity multiple
- 0.59×
- Total profit
- $-62,873
- Equity at exit
- $80,766
- IRR
- -4.2%
- Equity multiple
- 0.74×
- Total profit
- $-40,119
- Equity at exit
- $46,835
Cash invested: $151,670 (down + closing). Projections, not guarantees.
Landlord ↔ Tenant lean methodology
- Overall (STATE)
- 87 Strongly Landlord-Friendly
- State Texas
- 87 Strongly Landlord-Friendly · R+5
- County
- — inherits STATE
- City
- — inherits STATE
ZIP-level market 76028
- Home prices YoY
- -33.4%
- Rents YoY
- 1.8%
- Active inventory
- 679
- Price-to-rent
- 7.7×
Monthly cashflow live
- Estimated rent
- $5,361 medium interval (Pro) →
- Mortgage (P&I)
- −$2,841
- Tax est. 1.5%
- −$677 /mo · $8,125/yr
- Insurance
- −$226
- HOA
- −$0
- Vacancy / Maint / Mgmt
- −$1,126
- Net cashflow
- $492
Break-even live
UW: 25.0% down · 7.5% · 30yr · 1.5% tax · 5.0% vac · 8.0% maint · 8.0% mgmt
Financing live
Cash to close
- Down payment
- $135,420
- Closing costs
- $16,250
- Reserves months
- —
- Total cash needed
- —
Loan-product check · same deal, 3 products live
Conventional
25% down · 7.5% · 30yr
- Down + closing
- —
- Monthly P&I
- —
- Monthly cashflow
- —
- DSCR
- —
- Eligible?
- —
Personal DTI + credit; lowest rate.
DSCR
20% down · 8.5% · 30yr
- Down + closing
- —
- Monthly P&I
- —
- Monthly cashflow
- —
- DSCR
- —
- Eligible?
- —
No personal income docs; deal must DSCR.
Hard money
10% down · 12.0% · 12mo
- Down + closing
- —
- Monthly P&I
- —
- Monthly cashflow
- —
- DSCR
- —
- Eligible?
- —
Short-term bridge; refi at stabilization.
Rent comps 5 comps
| Address | Beds | Baths | Sqft | Rent | $/sqft | DOM | Units | Dist |
|---|---|---|---|---|---|---|---|---|
| 2435 Castle Pines Dr Burleson, TX | 4.0 | 3.0 | 3064 | $2,950 | $0.96 | 1d | 1 | 0.39mi |
| 2516 Castle Pines Dr Unit 1287532P Burleson, TX | 5.0 | 3.0 | 2507 | $16,227 | $6.47 | 22d | 1 | 0.46mi |
| 2516 Castle Pines Dr Burleson, TX | 5.0 | 3.0 | 2518 | $8,950 | $3.55 | 24d | 1 | 0.46mi |
| 2752 Elmwood Dr Burleson, TX | 4.0 | 2.0 | 2032 | $2,800 | $1.38 | 43d | 1 | 0.74mi |
| 1733 Trinity St Burleson, TX | 4.0 | 2.0 | 2213 | $4,900 | $2.21 | 3d | 1 | 1.01mi |
Listing history 3 events
-
2026-06-18days on market $494,900 Active 2 DOM
-
2026-06-17remarks 453-char remark
-
2026-06-17$494,900 Active 1 DOM
ⓘ Source: listings_history table (triggers on properties + properties_extension) + one-shot
backfill from property_details.listing_events for pre-trigger history.
Nearby sold comps map
Loading sold comps map…
Walkable amenities ~0.75 mi
Loading nearby amenities…
Taxation est. · year 1
- Rental income
- $64,333
- − Mortgage interest
- −$30,343
- − Property taxes
- −$8,125
- − Insurance
- −$2,708
- − Repairs & maintenance
- −$5,147
- − Management
- −$5,147
- − Depreciation
- −$15,758
- Taxable loss
- −$2,894
- Est. tax savings @ 24.0%
- +$695
- After-tax cash flow
- $6,596/yr
For passive investors: Depreciation is non-cash, so a rental often shows a tax loss while cash-flowing — sheltering income. Rental losses are passive: they offset passive income freely, and up to $25,000/yr can offset ordinary (W-2) income if you actively participate and your MAGI is under $100k (phasing out to $0 by $150k); unused losses carry forward. On sale, claimed depreciation is recaptured at up to 25%, and gains may owe capital-gains tax (a 1031 exchange can defer both). Figures are a year-1 estimate at your 24.0% rate — not tax advice; consult a CPA.
Condition & rehab AI · 6 photos
This home is in excellent condition with modern finishes and a well-maintained exterior. It offers a high ROI with minimal updates needed to enhance its resale and rental value.
Value-add opportunities
- Both Painting the exterior — Fresh paint can enhance curb appeal and property value.
- Both Landscaping improvements — Enhanced landscaping can increase curb appeal and property value.
- Resale Kitchen appliances — Upgrading appliances can attract more buyers.
- Resale Bathroom fixtures — Modern fixtures can appeal to a broader range of buyers.
- Both Flooring replacement — Replacing worn-out flooring can improve the overall appearance and functionality of the home.
Renovation cost estimate screening
Value-add ROI direction
- Both Painting the exterior — Fresh paint can enhance curb appeal and property value. ↑
- Both Landscaping improvements — Enhanced landscaping can increase curb appeal and property value. ↑
- Resale Kitchen appliances — Upgrading appliances can attract more buyers. ↑
- Resale Bathroom fixtures — Modern fixtures can appeal to a broader range of buyers. ↑
- Both Flooring replacement — Replacing worn-out flooring can improve the overall appearance and functionality of the home. ↑
ⓘ Cost ranges are severity-bucket heuristics (US national rule-of-thumb). Get contractor quotes + a written scope before underwriting a rehab budget.
Schools (NCES district)
- District
- Joshua ISD
- NCES district ID
- 4824930
- Math proficiency
- 52% ▼ -7.00%
- Reading proficiency
- 50% ▼ -1.00%
- Median HH income
- $60,696
- Composite
- 44.65/100
- National rank
- #2769
- State rank
- #139 of 826 in TX
Livability — Burleson
- Score
- 79/100
- State rank
- #53
- US rank
- #2133
Category grades
Schools grade is shown separately in the Schools card above.
Census & demographics
- Census place
- Burleson, TX
- County
- Johnson County · 147,987 people
- City population
- 81,549
- Metro
- Dallas-Fort Worth-Arlington, TX
- Population (ZIP)
- 81,549
- Household income
- $101,138
- Rent vs Own
- Severe rent burden
- 1117.0
Population outlook (Johnson County) Hauer SSP2
- Today (2025)
- 179,678 people
- By 2030
- 189,208 · +5.3%
- By 2040
- 207,261 · +15.4%
- By 2050
- 223,064 · +24.1%
- By 2075
- 259,979 · +44.7%
- By 2100
- 275,395 · +53.3%
Race, ethnicity, and origin ACS 2023
- Neighborhood character
- Predominantly White (69%)
- Race & ethnicity
- White 69% Hispanic / Latino 19% Two or more races 11% Black 6% Asian 1%
- Hispanic origin (detail)
- Mexican 17%
- Common ancestry
- Lithuanian 2% Italian 2% Slovak 2%
- Foreign-born
- 5% · Canada
- Languages at home
- 88% English-only · Spanish 10% Other Indo-European 1%
Political lean MEDSL · Johnson
- 2024 margin
- Solid R (+51.4) · D 23.9% · R 75.3%
- 2008→2024 swing
- -3.9pp toward R · 2008: -47.5pp · 2024: -51.4pp
- All cycles
- 2024: R+51.4 2020: R+53.0 2016: R+58.3 2012: R+55.6 2008: R+47.5
Not yet ingested
- Civics
- —
Market trends
- HPI YoY
- ▼ -141.44%
- Current HPI
- 282.466
- Rent YoY
- ▲ 1.78%
- Metro
- Dallas-Fort Worth-Arlington, TX
- State GDP YoY
- ▲ 3.95%
- F500 in state
- 110
Industry mix (Fortune 500 HQ in TX)
| Industry | F500 HQs | Revenue |
|---|---|---|
| Energy | 16 | $1,198B |
|
||
| Technology | 5 | $198B |
|
||
| Engineering / Construction | 4 | $72B |
|
||
| Energy Services | 3 | $60B |
|
||
| Utilities | 3 | $41B |
|
||
| Healthcare | 2 | $330B |
|
||
Cash-flow waterfall
monthlySold comps — $/sqft
last 12 mo · ≤1 miLoading sold comps…