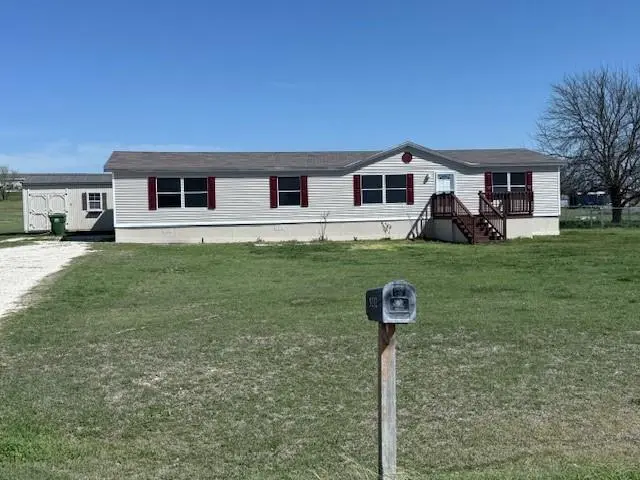
9212 Idaho St · Godley, TX
Flood risk 1/10 · Minimal
- FEMA flood zone
- X (unshaded)
- Chance of flooding over 30 yrs
- 0.0%
- Est. flood insurance / yr
- $507 – $1,088
Fire risk 6/10 · Moderate
- Est. fire insurance / yr
- $1,222 – $2,270
Heat risk 7/10 · Major
- Hot days now (above 110°F)
- 7 days/yr
- Hot days in 30 yrs
- 24 days/yr
Wind risk 6/10 · Moderate
- Chance of severe wind over 30 yrs
- 27.0%
Air-quality risk 3/10 · Minor
- Unhealthy air days now
- 2 days/yr
- Unhealthy air days in 30 yrs
- 3 days/yr
Risk factors via First Street. Map © Google.
Why this score? — see what drove the D grade
The composite is a weighted blend of 9 inputs, each scored 0–100. Each bar is that input's sub-score; the figure is the points it added to the 100-point composite (weight × sub-score).
- Cash flow +14.0/30.0
- ARV discount +8.4/15.0
- DSCR +4.2/10.0
- 1% rule +3.9/10.0
- Livability +3.7/5.0
- Schools +3.2/10.0
- Rent growth +2.5/5.0
- Condition / age +2.5/5.0
- Appreciation +0.0/10.0
$233,900
🖨 Deal sheet (PDF) 📄 Offer letter ✓ Due diligence
Listing remarks MLS
This beautiful home is ready for its next family — and their pets. Nestled on over an acre, the property includes a storage building and a dedicated dog run. Step inside to open, light-filled living spaces anchored by dramatic, deep-cherry stained pillars. The open living room, family room, dining area, and stately kitchen are designed to impress, with a stone-look accent in the kitchen. The oversized primary bedroom features an ensuite with double sinks and a separate shower. Move-in ready — schedule a showing and fall in love.
Key facts
- Open living spaces
- Dedicated dog run
- Separate shower
Tags
Neighborhood map
What this means for you Summary
Snapshot
- This is a 3-bed/2.0-bath manufactured listed at $234k.
Deal economics
- At list price, monthly cash flow is $28 ($335/yr) — positive.
- The deal already cash-flows at list — no discount required.
- To meet the 1% rule (rent ≥ 1% of price), the offer needs to be $208k (10.9% below list).
- Recommended offer: $208k (10.9% below list) — sets the bar for 1% rule.
- Cap rate 6.4% vs local median 2.8% in Godley — top-decile yield for the area; either an underpriced asset or a hidden risk that comps aren't pricing in. Stress-test before assuming the spread holds.
Location & tenants
- Location reads 73/100 on livability (#226 in TX) — a middle-class / working-renter tenant base. Strengths: crime A+, cost of living A+, housing A+; Watch: health & safety D+, amenities F, commute F.
- Godley ISD (rural): math 34% / reading 38% proficiency, ranked #466 of 826 in TX (top 56%) — families likely to look elsewhere, expect single-tenant / working-renter base with shorter leases.
- Zoned schools: Legacy El (math 39% / reading 37%, grade F, #1,709 of 4,322 statewide, top 40%, 408 students, 32% FRL); Godley H S (math 27% / reading 51%, grade F, #859 of 1,632 statewide, top 53%, 777 students, 42% FRL).
- Market conditions: 421 active listings in the ZIP; 2,152 units permitted in Johnson County in 2024 (76 in 5+ unit buildings).
Forward outlook
- Local home prices are declining (-3.0%/yr); year-one equity from $2k of loan paydown is wiped out by about $7k of value loss. Plan a longer hold.
- Johnson County population projected at +24% by 2050 — long-run rental-demand tailwind backs the buy-and-hold thesis.
Negotiation context
- It's been on market 99 days — a 9% lower offer ($213k) is reasonable based on typical stale-listing flexibility.
- 2 sale attempts since 15y ago; this cycle's ask has dropped $16k (6%) from the opening price — seller is motivated, your offer sets the floor, not the list.
Risks & watch-outs
- Climate carrying-cost: major wind risk, 27% chance of damaging wind over 30y; major wildfire risk; extreme-heat days projected 7→24/yr by 2055 (HVAC capex compounding) — expect insurance premiums to compound above CPI over the hold.
Questions for the listing agent
- It's been on market 99 days. Have you received any prior offers? Is the seller open to a 11% concession, seller financing, or rate buy-down credit?
- Why hasn't it sold? Are there any deal-killer items the seller is aware of (foundation, flood, title, zoning, code violations)?
- Is there a deadline driving the sale (1031 exchange, divorce, estate, relocation)? That informs how much negotiation room exists.
- Schools are D-rated, which usually means shorter tenancies and higher turnover. Who's the typical renter profile here, and what's been the actual vacancy rate?
- The area grade is low — what's the realistic commute time and amenity access for the typical tenant pool here? Any planned neighborhood developments (good or bad) we should know about?
- What's the average days-on-market for RENTAL listings here right now (not sales)? A rising rental-DOM trend means longer vacancies and softer asking-rent achievability than the comps imply.
- What's the recent tenant-quality profile in this submarket — average credit score on applications, eviction rate, late-payment / NSF rate, and stable-employment percentage? A property-management company in the area should have these aggregated.
- How much new for-sale + rental construction is in the pipeline within 1–3 miles? Heavy new supply typically softens prices + rents 12–24 months out; constrained supply supports both.
Investment metrics
- 1% rule
- 0.89% ✗
- Cap rate
- 6.44%
- Cash-on-cash
- 0.51%
- DSCR
- 1.02
- GRM
- 9.4
CMA / ARV
- ARV (median comp)
- $238,795
- List price
- $233,900
- Delta
- -2.05%
- Verdict
- FAIR
- Comps
- 20 within 1.0 mi
Show comp detail 10 sales within ~0.75 mi
| Address | Dist | Beds/Ba | Sqft | Sold | Price | $/sf | Match |
|---|---|---|---|---|---|---|---|
| 9204 Montana St | 0.15mi | 3/2.0 | 1,716 (0%) | 3mo | $265,000 | $154 | 91 |
| 9201 Montana St | 0.14mi | 3/2.0 | 1,568 (-9%) | 17mo | $229,900 | $147 | 65 |
| 5912 Kentucky St | 0.36mi | 3/2.0 | 1,568 (-9%) | 4mo | $249,000 | $159 | 65 |
| 9316 Colorado St | 0.42mi | 3/2.0 | 1,792 (+4%) | 14mo | $189,900 | $106 | 62 |
| 9100 Montana St | 0.37mi | 4/2.0 (+1) | 1,874 (+9%) | 6mo | $218,000 | $116 | 57 |
| 9104 Montana St | 0.36mi | 3/2.0 | 1,848 (+8%) | 22mo | $249,900 | $135 | 52 |
| 9204 Kansas St | 0.44mi | 3/2.0 | 1,920 (+12%) | 13mo | $229,900 | $120 | 49 |
| 9220 Montana St | 0.13mi | 4/2.0 (+1) | 1,960 (+14%) | 20mo | $169,900 | $87 | 49 |
| 9201 1st St | 0.64mi | 3/2.0 | 1,568 (-9%) | 13mo | $229,000 | $146 | 45 |
| 5520 Texas St | 0.62mi | 3/2.0 | 1,848 (+8%) | 23mo | $219,900 | $119 | 39 |
Match score weights: distance 35% · size 25% · config 20% · recency 20%. Top-matched comps best support the ARV.
Projected returns pro-forma
-3.0% appreciation · 3.0% rent growth · sell at horizon
- IRR
- -15.5%
- Equity multiple
- 0.45×
- Total profit
- $-36,094
- Equity at exit
- $34,875
- IRR
- -6.9%
- Equity multiple
- 0.56×
- Total profit
- $-29,012
- Equity at exit
- $20,223
Cash invested: $65,492 (down + closing). Projections, not guarantees.
Landlord ↔ Tenant lean methodology
- Overall (STATE)
- 87 Strongly Landlord-Friendly
- State Texas
- 87 Strongly Landlord-Friendly · R+5
- County
- — inherits STATE
- City
- — inherits STATE
ZIP-level market 76058
- Home prices YoY
- -24.5%
- Active inventory
- 421
- Price-to-rent
- 9.4×
Monthly cashflow live
- Estimated rent
- $2,083 medium interval (Pro) →
- Mortgage (P&I)
- −$1,227
- Tax from tax record
- −$294 /mo · $3,523/yr
- Insurance
- −$97
- HOA
- −$0
- Vacancy / Maint / Mgmt
- −$437
- Net cashflow
- $28
Break-even live
Sensitivity live
| Price | -10% $160 | -5% $94 | +0% $28 | +5% $-38 | +10% $-105 |
|---|---|---|---|---|---|
| Rent | -10% $-137 | -5% $-54 | +0% $28 | +5% $110 | +10% $192 |
| Rate | -1.0pp $146 | -0.5pp $87 | base $28 | +0.5pp $-33 | +1.0pp $-94 |
UW: 25.0% down · 7.5% · 30yr · 1.5% tax · 5.0% vac · 8.0% maint · 8.0% mgmt
Financing live
Cash to close
- Down payment
- $58,475
- Closing costs
- $7,017
- Reserves months
- —
- Total cash needed
- —
Loan-product check · same deal, 3 products live
Conventional
25% down · 7.5% · 30yr
- Down + closing
- —
- Monthly P&I
- —
- Monthly cashflow
- —
- DSCR
- —
- Eligible?
- —
Personal DTI + credit; lowest rate.
DSCR
20% down · 8.5% · 30yr
- Down + closing
- —
- Monthly P&I
- —
- Monthly cashflow
- —
- DSCR
- —
- Eligible?
- —
No personal income docs; deal must DSCR.
Hard money
10% down · 12.0% · 12mo
- Down + closing
- —
- Monthly P&I
- —
- Monthly cashflow
- —
- DSCR
- —
- Eligible?
- —
Short-term bridge; refi at stabilization.
Listing history 22 events
-
2026-06-21days on market $233,900 Active 99 DOM
-
2026-06-18price $233,900 Active 96 DOM
-
2026-06-18days on market $244,900 Active 96 DOM
-
2026-06-17days on market $244,900 Active 95 DOM
-
2026-06-16days on market $244,900 Active 94 DOM
-
2026-06-15days on market $244,900 Active 93 DOM
-
2026-06-13days on market $244,900 Active 91 DOM
-
2026-06-13days on market $244,900 Active 90 DOM
-
2026-06-09days on market $244,900 Active 87 DOM
-
2026-06-08days on market $244,900 Active 86 DOM
-
2026-06-07days on market $244,900 Active 85 DOM
-
2026-06-04days on market $244,900 Active 82 DOM
-
2026-06-03days on market $244,900 Active 81 DOM
-
2026-06-02days on market $244,900 Active 80 DOM
-
2026-06-01days on market $244,900 Active 79 DOM
-
2026-05-31days on market $244,900 Active 78 DOM
-
2026-04-29price $244,900 546-char remark
Show marketing remark (546 chars)
This beautiful home is ready for its next family — and their pets. Nestled on over an acre, the property includes a storage building and a dedicated dog run. Step inside to open, light-filled living spaces anchored by dramatic, deep-cherry stained pillars. The open living room, family room, dining area, and stately kitchen are designed to impress, with a stone-look accent in the kitchen. The oversized primary bedroom features an ensuite with double sinks and a separate shower. Move-in ready — schedule a showing and fall in love.
-
2026-03-14$249,900 Active 546-char remark
Show marketing remark (546 chars)
This beautiful home is ready for its next family — and their pets. Nestled on over an acre, the property includes a storage building and a dedicated dog run. Step inside to open, light-filled living spaces anchored by dramatic, deep-cherry stained pillars. The open living room, family room, dining area, and stately kitchen are designed to impress, with a stone-look accent in the kitchen. The oversized primary bedroom features an ensuite with double sinks and a separate shower. Move-in ready — schedule a showing and fall in love.
-
2011-06-23soldstatus
-
2011-03-25soldstatus Closed 365-char remark
Show marketing remark (365 chars)
Well maintained 3-2 manufactured home on just over an acre. This one has all the bells and whistles. Fabulous kitchen with breakfast area and lots of cabinet space. Large Master and secondary bedrooms. Awaiting new owners! Property to be sold AS IS. Buyer or Buyer's Agent to verify all info in MLS. SQ FT info from FHA appraisal deemed reliable but not guaranteed
-
2011-02-14status Pending 365-char remark
Show marketing remark (365 chars)
Well maintained 3-2 manufactured home on just over an acre. This one has all the bells and whistles. Fabulous kitchen with breakfast area and lots of cabinet space. Large Master and secondary bedrooms. Awaiting new owners! Property to be sold AS IS. Buyer or Buyer's Agent to verify all info in MLS. SQ FT info from FHA appraisal deemed reliable but not guaranteed
-
2011-01-07$38,000 Active 365-char remark
Show marketing remark (365 chars)
Well maintained 3-2 manufactured home on just over an acre. This one has all the bells and whistles. Fabulous kitchen with breakfast area and lots of cabinet space. Large Master and secondary bedrooms. Awaiting new owners! Property to be sold AS IS. Buyer or Buyer's Agent to verify all info in MLS. SQ FT info from FHA appraisal deemed reliable but not guaranteed
ⓘ Source: listings_history table (triggers on properties + properties_extension) + one-shot
backfill from property_details.listing_events for pre-trigger history.
Tax reassessment forecast TX · Resets to sale price
- Current annual tax
- $3,523 · $294/mo
- Projected year-2 tax
- $4,280 · $357/mo
- Expected delta
- +$757/yr (+$63/mo · 21.5%)
ⓘ Screening estimate from a state-policy table — verify with the county assessor before closing.
Climate risk First Street
- Flood 1/10 Low FEMA zone X (unshaded) · 0% chance over 30 yrs
- Wildfire 6/10 Major
- Heat 7/10 Severe 7 d/yr ≥110°F today · 24 d/yr by 30 yrs out
- Wind 6/10 Major 27% chance of damaging wind over 30 yrs
- Air quality 3/10 Moderate 2 unhealthy d/yr today · 3 by 30 yrs out
Nearby sold comps map
Loading sold comps map…
Walkable amenities ~0.75 mi
Loading nearby amenities…
Taxation est. · year 1
- Rental income
- $24,995
- − Mortgage interest
- −$13,102
- − Property taxes
- −$3,523
- − Insurance
- −$1,170
- − Repairs & maintenance
- −$2,000
- − Management
- −$2,000
- − Depreciation
- −$6,804
- Taxable loss
- −$3,603
- Est. tax savings @ 24.0%
- +$865
- After-tax cash flow
- $1,199/yr
For passive investors: Depreciation is non-cash, so a rental often shows a tax loss while cash-flowing — sheltering income. Rental losses are passive: they offset passive income freely, and up to $25,000/yr can offset ordinary (W-2) income if you actively participate and your MAGI is under $100k (phasing out to $0 by $150k); unused losses carry forward. On sale, claimed depreciation is recaptured at up to 25%, and gains may owe capital-gains tax (a 1031 exchange can defer both). Figures are a year-1 estimate at your 24.0% rate — not tax advice; consult a CPA.
Schools (NCES district)
- District
- Godley ISD
- NCES district ID
- 4820960
- Math proficiency
- 34% ▼ -4.00%
- Reading proficiency
- 38% ▲ 2.00%
- Median HH income
- $59,332
- Composite
- 32.06/100
- National rank
- #5820
- State rank
- #466 of 826 in TX
Livability — Godley
- Score
- 73/100
- State rank
- #226
- US rank
- #5528
Category grades
Schools grade is shown separately in the Schools card above.
Census & demographics
- Population (ZIP)
- 21,531
Population outlook (Johnson County) Hauer SSP2
- Today (2025)
- 179,678 people
- By 2030
- 189,208 · +5.3%
- By 2040
- 207,261 · +15.4%
- By 2050
- 223,064 · +24.1%
- By 2075
- 259,979 · +44.7%
- By 2100
- 275,395 · +53.3%
Race, ethnicity, and origin ACS 2023
- Neighborhood character
- Predominantly White (67%)
- Race & ethnicity
- White 67% Hispanic / Latino 28% Two or more races 11% Black 2%
- Hispanic origin (detail)
- Mexican 26%
- Common ancestry
- Italian 2% Slovak 2% Portuguese 1%
- Foreign-born
- 7% · Canada
- Languages at home
- 80% English-only · Spanish 18% German/W. Germanic 1%
Political lean MEDSL · Johnson
- 2024 margin
- Solid R (+51.4) · D 23.9% · R 75.3%
- 2008→2024 swing
- -3.9pp toward R · 2008: -47.5pp · 2024: -51.4pp
- All cycles
- 2024: R+51.4 2020: R+53.0 2016: R+58.3 2012: R+55.6 2008: R+47.5
Not yet ingested
- Civics
- —
Market trends
- HPI YoY
- ▼ -86.22%
- Current HPI
- 265.6513
- Rent YoY
- —
- Metro
- —
- State GDP YoY
- ▲ 3.95%
- F500 in state
- 110
Industry mix (Fortune 500 HQ in TX)
| Industry | F500 HQs | Revenue |
|---|---|---|
| Energy | 16 | $1,198B |
|
||
| Technology | 5 | $198B |
|
||
| Engineering / Construction | 4 | $72B |
|
||
| Energy Services | 3 | $60B |
|
||
| Utilities | 3 | $41B |
|
||
| Healthcare | 2 | $330B |
|
||
Price history
+544.5% since first listed6 events — show timeline
- 2026-04-29 Price Changed $244,900 NTREIS
- 2026-03-14 Listed $249,900 NTREIS
- 2011-06-23 Sold (Public Records) — Public Records
- 2011-03-25 Sold (MLS) — NTREIS
- 2011-02-14 Pending — NTREIS
- 2011-01-07 Listed $38,000 NTREIS
Property tax history
+5.8%/yrLatest (2025): $3,523 · -13.4% YoY. Source: county tax records.
Cash-flow waterfall
monthlySold comps — $/sqft
last 12 mo · ≤1 miLoading sold comps…