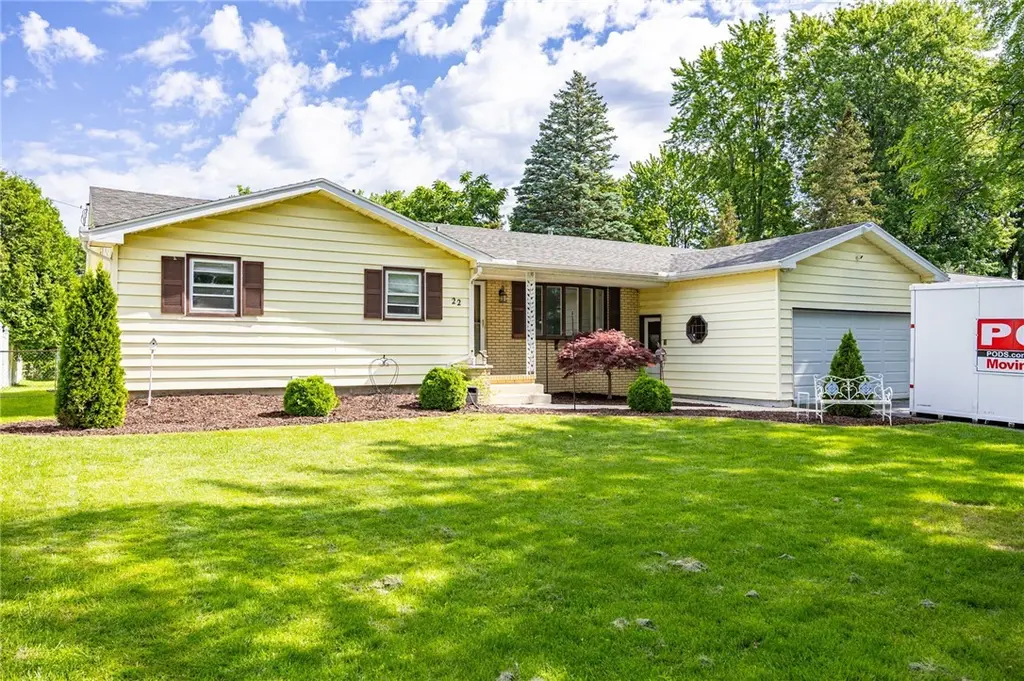
22 Glen Oaks Dr · Gates, NY
Flood risk 1/10 · Minimal
- FEMA flood zone
- X (unshaded)
- Chance of flooding over 30 yrs
- 0.0%
- Est. flood insurance / yr
- $473 – $860
Fire risk 1/10 · Minimal
- Est. fire insurance / yr
- $691 – $1,283
Heat risk 2/10 · Minimal
- Hot days now (above 95°F)
- 7 days/yr
- Hot days in 30 yrs
- 15 days/yr
Wind risk 1/10 · Minimal
- Chance of severe wind over 30 yrs
- —
Air-quality risk 2/10 · Minimal
- Unhealthy air days now
- 1 days/yr
- Unhealthy air days in 30 yrs
- 2 days/yr
Risk factors via First Street. Map © Google.
Why this score? — see what drove the C grade
The composite is a weighted blend of 9 inputs, each scored 0–100. Each bar is that input's sub-score; the figure is the points it added to the 100-point composite (weight × sub-score).
- Cash flow +18.0/30.0
- ARV discount +15.0/15.0
- 1% rule +7.2/10.0
- DSCR +5.6/10.0
- Schools +3.6/10.0
- Livability +3.4/5.0
- Rent growth +2.5/5.0
- Condition / age +2.5/5.0
- Appreciation +0.0/10.0
$189,900
🖨 Deal sheet 📄 Offer letter ✓ Due diligence
Listing remarks MLS
Welcome home to this 3 bed, 1.5 bath Ranch with recently refinished gleaming hardwoods throughout! Many, Many Updates! Furnace & A/C 2015, Tear-off Roof 2011. Full bath remodeled 2016, New garage door. Huge master bedroom with 2 closets; one walk-in and one double wide! Electric fireplace in family room. This home has both a living room (currently used as dining) and a family room. Sliding glass doors lead to huge 3 season enclosed sunroom (not included in square footage) . Fully fenced backyard & patio. Sidewalks on both sides of the street. Delayed Negotiations until Tuesday 9/8/2020 @ 2pm. Call Today! Don't Miss This One!
Key facts
- 3 season room
- Gas stove
- 2 living areas
Tags
Property features AI
Exterior
- Parking: Attached garage with garage door opener; Driveway; 2-car garage
- Utilities: High-speed internet available; Public water connected; Sewer connected; Circuit breaker electric
- Home design: Single-story; Resale property; Rectangular residential lot; City street frontage
- Construction: Asphalt roof; Vinyl siding; Blown-in insulation; Copper plumbing; Block foundation; Existing (no new construction)
- Exterior features: Blacktop driveway; Enclosed porch; Porch; Patio; Private yard; Fully fenced yard; See remarks
Interior
- Kitchen: Dishwasher; Gas oven; Gas range; Range hood; Exhaust fan; Refrigerator; Eat-in kitchen
- Bedrooms: 3 main-level bedrooms; Main-level primary bedroom; Bedroom on main level
- Flooring: Hardwood; Tile; Vinyl; Varied flooring
- Bathrooms: 1 full bathroom; 1 half bathroom; 2 main-level bathrooms
- Heating & cooling: Gas forced-air heating; Central air conditioning
- Interior features: Ceiling fan(s); Eat-in kitchen; Separate/formal living room; Sliding glass door(s); Programmable thermostat; Storm windows; Sliding doors; Accessible bedroom and no stairs
- Laundry & utility: Laundry in basement; Gas water heater
Neighborhood map
What this means for you Summary
Snapshot
- This is a 3-bed/1.5-bath single-family listed at $190k.
Deal economics
- At list price, monthly cash flow is $163 ($2k/yr) — positive.
- The deal already cash-flows at list — no discount required.
- Meets the 1% rule at list price ($2k rent vs $190k).
- Cap rate 7.3% vs local median 5.9% in Gates — meaningfully above typical; check what's discounted (condition, days-on-market, listing class) to confirm the premium yield is real.
Location & tenants
- Location reads 67/100 on livability (#582 in NY) — a middle-class / working-renter tenant base. Strengths: housing A+, health & safety A+; Watch: amenities F, commute F.
- Gates-Chili Central School District (suburban): math 41% / reading 42% proficiency, ranked #491 of 590 in NY (top 83%) — families likely to look elsewhere, expect single-tenant / working-renter base with shorter leases.
- Market conditions: 127 active listings in the ZIP; solid renter incomes; 1,169 units permitted in Monroe County in 2024 (591 in 5+ unit buildings).
- This rent runs 32% of the median local income ($88k/yr) — at the standard rent-burdened threshold; future hikes will face affordability resistance.
Forward outlook
- Local home prices are declining (-3.0%/yr); year-one equity from $1k of loan paydown is wiped out by about $6k of value loss. Plan a longer hold.
- Monroe County population projected to shrink 6% by 2050 — rents likely to lag national; underwrite the cash flow, not the appreciation.
Negotiation context
- Only 1 days on market — expect competitive offers; lowballing is unlikely to land.
- 3 sale attempts since 11y ago with the ask held roughly flat each time — persistent listings suggest the price (not the market) is what's stuck; bring a comps-based counter.
- Current owner paid $155k; 23% above their basis — modest negotiation headroom, anchor on the comps not their cost.
Risks & watch-outs
- Watch-outs: property tax is 3.8% of price.
Questions for the listing agent
- Built in 1967 — when were the roof, HVAC, electrical panel, plumbing, and water heater last replaced?
- Property tax is high relative to price — has the assessment been appealed recently, and will the sale trigger a re-assessment?
- Is there a deadline driving the sale (1031 exchange, divorce, estate, relocation)? That informs how much negotiation room exists.
- Schools are B-rated — typically a magnet for longer-tenancy family renters. What's the average tenant stay here, and is there a school-zone premium baked into asking?
- What's the average days-on-market for RENTAL listings here right now (not sales)? A rising rental-DOM trend means longer vacancies and softer asking-rent achievability than the comps imply.
- What's the recent tenant-quality profile in this submarket — average credit score on applications, eviction rate, late-payment / NSF rate, and stable-employment percentage? A property-management company in the area should have these aggregated.
- How much new for-sale + rental construction is in the pipeline within 1–3 miles? Heavy new supply typically softens prices + rents 12–24 months out; constrained supply supports both.
Investment metrics
- 1% rule
- 1.22% ✓
- Cap rate
- 7.33%
- Cash-on-cash
- 3.69%
- DSCR
- 1.16
- GRM
- 6.8
CMA / ARV
- ARV (on-the-fly)
- $268,100
- Comps found
- 12
Show comp detail 12 sales within ~0.75 mi
| Address | Dist | Beds/Ba | Sqft | Sold | Price | $/sf | Match |
|---|---|---|---|---|---|---|---|
| 41 Shadywood Dr | 0.41mi | 3/1.5 | 1,496 (-2%) | 1mo | $255,000 | $170 | 76 |
| 137 Rahway Rd | 0.39mi | 3/1.5 | 1,567 (+2%) | 6mo | $270,000 | $172 | 73 |
| 47 Bramblewood Ln W | 0.30mi | 4/2.0 (+1) | 1,560 (+2%) | 7mo | $273,000 | $175 | 70 |
| 67 Rahway Ln | 0.56mi | 3/2.5 | 1,563 (+2%) | 1mo | $475,000 | $304 | 65 |
| 38 Debby Ln | 0.59mi | 3/1.0 | 1,528 (-0%) | 6mo | $200,000 | $131 | 65 |
| 31 Appian Dr | 0.62mi | 4/1.5 (+1) | 1,478 (-4%) | 1mo | $280,000 | $189 | 60 |
| 87 Bru Mar Dr | 0.48mi | 3/2.0 | 1,364 (-11%) | 1mo | $305,000 | $224 | 57 |
| 48 Bramblewood Ln W | 0.27mi | 3/2.0 | 1,306 (-15%) | 7mo | $265,000 | $203 | 55 |
| 87 Simmons St | 0.73mi | 4/1.5 (+1) | 1,520 (-1%) | 6mo | $175,000 | $115 | 54 |
| 2381 Long Pond Rd | 0.51mi | 3/1.5 | 1,696 (+11%) | 6mo | $225,000 | $133 | 53 |
| 41 Appian Dr | 0.69mi | 3/2.0 | 1,436 (-6%) | 3mo | $300,000 | $209 | 52 |
| 21 W Crest Dr | 0.67mi | 3/1.0 | 1,327 (-13%) | 6mo | $220,000 | $166 | 40 |
Match score weights: distance 35% · size 25% · config 20% · recency 20%. Top-matched comps best support the ARV.
Projected returns pro-forma
-3.0% appreciation · 3.0% rent growth · sell at horizon
- IRR
- -10.4%
- Equity multiple
- 0.62×
- Total profit
- $-20,107
- Equity at exit
- $28,315
- IRR
- -0.8%
- Equity multiple
- 0.94×
- Total profit
- $-3,062
- Equity at exit
- $16,419
Cash invested: $53,172 (down + closing). Projections, not guarantees.
Landlord ↔ Tenant lean methodology
- Overall (STATE)
- 15 Strongly Tenant-Friendly
- State New York
- 15 Strongly Tenant-Friendly · D+10
- County
- — inherits STATE
- City
- — inherits STATE
ZIP-level market 14624
- Active inventory
- 127
- Price-to-rent
- 6.8×
Monthly cashflow live
- Estimated rent
- $2,325 medium interval (Pro) →
- Mortgage (P&I)
- −$996
- Tax from tax record
- −$599 /mo · $7,183/yr
- Insurance
- −$79
- HOA
- −$0
- Vacancy / Maint / Mgmt
- −$488
- Net cashflow
- $163
Break-even live
UW: 25.0% down · 7.5% · 30yr · 1.5% tax · 5.0% vac · 8.0% maint · 8.0% mgmt
Financing live
Cash to close
- Down payment
- $47,475
- Closing costs
- $5,697
- Reserves months
- —
- Total cash needed
- —
Loan-product check · same deal, 3 products live
Conventional
25% down · 7.5% · 30yr
- Down + closing
- —
- Monthly P&I
- —
- Monthly cashflow
- —
- DSCR
- —
- Eligible?
- —
Personal DTI + credit; lowest rate.
DSCR
20% down · 8.5% · 30yr
- Down + closing
- —
- Monthly P&I
- —
- Monthly cashflow
- —
- DSCR
- —
- Eligible?
- —
No personal income docs; deal must DSCR.
Hard money
10% down · 12.0% · 12mo
- Down + closing
- —
- Monthly P&I
- —
- Monthly cashflow
- —
- DSCR
- —
- Eligible?
- —
Short-term bridge; refi at stabilization.
Listing history 2 events
-
2026-06-18remarks 689-char remark
-
2026-06-18$189,900 Active 1 DOM
ⓘ Source: listings_history table (triggers on properties + properties_extension) + one-shot
backfill from property_details.listing_events for pre-trigger history.
Tax reassessment forecast NY · Partial reset (capped growth)
- Current annual tax
- $7,183 · $599/mo
- Projected year-2 tax
- $7,183 · $599/mo
- Expected delta
- $0/yr ($0/mo · 0.0%)
ⓘ Screening estimate from a state-policy table — verify with the county assessor before closing.
Climate risk First Street
- Flood 1/10 Low FEMA zone X (unshaded) · 0% chance over 30 yrs
- Wildfire 1/10 Low
- Heat 2/10 Low 7 d/yr ≥95°F today · 15 d/yr by 30 yrs out
- Wind 1/10 Low
- Air quality 2/10 Low 1 unhealthy d/yr today · 2 by 30 yrs out
Nearby sold comps map
Loading sold comps map…
Walkable amenities ~0.75 mi
Loading nearby amenities…
Taxation est. · year 1
- Rental income
- $27,903
- − Mortgage interest
- −$10,637
- − Property taxes
- −$7,183
- − Insurance
- −$950
- − Repairs & maintenance
- −$2,232
- − Management
- −$2,232
- − Depreciation
- −$5,524
- Taxable loss
- −$855
- Est. tax savings @ 24.0%
- +$205
- After-tax cash flow
- $2,166/yr
For passive investors: Depreciation is non-cash, so a rental often shows a tax loss while cash-flowing — sheltering income. Rental losses are passive: they offset passive income freely, and up to $25,000/yr can offset ordinary (W-2) income if you actively participate and your MAGI is under $100k (phasing out to $0 by $150k); unused losses carry forward. On sale, claimed depreciation is recaptured at up to 25%, and gains may owe capital-gains tax (a 1031 exchange can defer both). Figures are a year-1 estimate at your 24.0% rate — not tax advice; consult a CPA.
Schools (NCES district)
- District
- Gates-Chili Central School District
- NCES district ID
- 3611880
- Math proficiency
- 41% ▼ -12.00%
- Reading proficiency
- 42% ▼ -6.00%
- Median HH income
- $55,045
- Composite
- 36.23/100
- National rank
- #4719
- State rank
- #491 of 590 in NY
Livability — Gates
- Score
- 67/100
- State rank
- #582
- US rank
- #10531
Category grades
Schools grade is shown separately in the Schools card above.
Census & demographics
- Census place
- Gates, NY
- County
- Monroe County · 674,131 people
- Metro
- Rochester, NY
- Population (ZIP)
- 38,626
- Household income
- $87,989
- Rent vs Own
- Severe rent burden
- 584.0
Population outlook (Monroe County) Hauer SSP2
- Today (2025)
- 759,460 people
- By 2030
- 757,154 · -0.3%
- By 2040
- 740,644 · -2.5%
- By 2050
- 714,443 · -5.9%
- By 2075
- 645,883 · -15.0%
- By 2100
- 547,084 · -28.0%
Race, ethnicity, and origin ACS 2023
- Neighborhood character
- Predominantly White (78%)
- Race & ethnicity
- White 78% Black 9% Hispanic / Latino 6% Two or more races 5% Asian 3%
- Hispanic origin (detail)
- Puerto Rican 4%
- Common ancestry
- Romanian 6% Iranian 2% Lithuanian 2%
- Foreign-born
- 7% · Canada, China, India
- Languages at home
- 90% English-only · Spanish 3% Other Indo-European 3% Russian/Polish/Slavic 1%
Political lean MEDSL · Monroe
- 2024 margin
- D (+19.1) · D 59.5% · R 40.5%
- 2008→2024 swing
- +1.4pp toward D · 2008: 17.7pp · 2024: 19.1pp
- All cycles
- 2024: D+19.1 2020: D+21.0 2016: D+14.1 2012: D+17.4 2008: D+17.7
Not yet ingested
- Civics
- —
Market trends
- HPI YoY
- ▼ -151.26%
- Current HPI
- 267.356
- Rent YoY
- —
- Metro
- Rochester, NY
- State GDP YoY
- ▲ 2.60%
- F500 in state
- 92
Industry mix (Fortune 500 HQ in NY)
| Industry | F500 HQs | Revenue |
|---|---|---|
| Financial Services | 10 | $950B |
|
||
| Consumer Goods | 9 | $162B |
|
||
| Insurance | 4 | $225B |
|
||
| Telecommunications | 2 | $144B |
|
||
| Pharmaceuticals | 2 | $112B |
|
||
| Media / Entertainment | 2 | $69B |
|
||
Price history
+51.9% since first listed13 events — show timeline
- 2026-06-18 Listed $189,900 UNYREIS
- 2020-11-10 Sold (Public Records) $155,000 Public Records
- 2020-11-09 Sold (MLS) $155,000 UNYREIS
- 2020-10-17 Pending — UNYREIS
- 2020-09-09 Pending — UNYREIS
- 2020-09-04 Listed $149,900 UNYREIS
- 2016-01-29 Sold (Public Records) $80,000 Public Records
- 2016-01-29 Sold (MLS) $80,000 UNYREIS
- 2016-01-08 Pending — UNYREIS
- 2015-11-24 Price Changed $99,000 UNYREIS
- 2015-11-12 Price Changed $104,900 UNYREIS
- 2015-11-04 Listed $112,000 UNYREIS
- 2006-05-19 Sold (Public Records) $125,000 Public Records
Property tax history
+3.3%/yrLatest (2025): $7,183 · -1.0% YoY. Source: county tax records.
Cash-flow waterfall
monthlySold comps — $/sqft
last 12 mo · ≤1 miLoading sold comps…