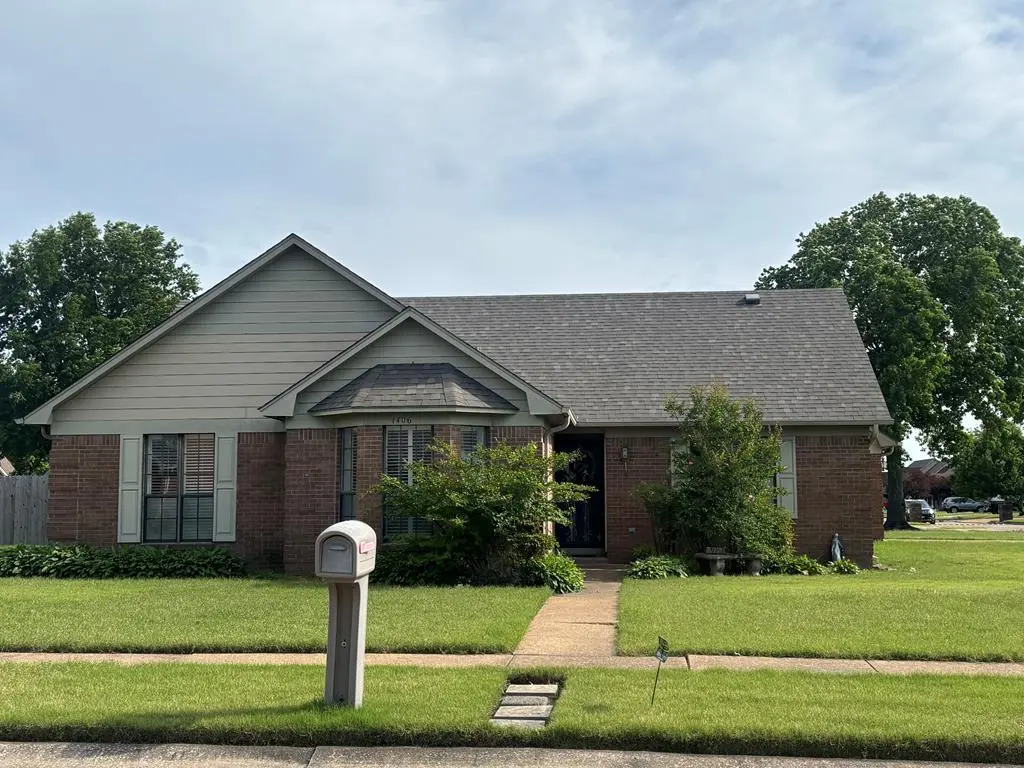
1406 Windover Ln · West Memphis, AR
Flood risk 4/10 · Minor
- FEMA flood zone
- X (shaded)
- Chance of flooding over 30 yrs
- 0.2%
- Est. flood insurance / yr
- $507 – $1,088
Fire risk 1/10 · Minimal
- Est. fire insurance / yr
- $1,499 – $2,785
Heat risk 7/10 · Major
- Hot days now (above 109°F)
- 7 days/yr
- Hot days in 30 yrs
- 21 days/yr
Wind risk 4/10 · Minor
- Chance of severe wind over 30 yrs
- 16.0%
Air-quality risk 2/10 · Minimal
- Unhealthy air days now
- 2 days/yr
- Unhealthy air days in 30 yrs
- 2 days/yr
Risk factors via First Street. Map © Google.
Why this score? — see what drove the D grade
The composite is a weighted blend of 9 inputs, each scored 0–100. Each bar is that input's sub-score; the figure is the points it added to the 100-point composite (weight × sub-score).
- ARV discount +15.0/15.0
- Cash flow +12.4/30.0
- DSCR +3.7/10.0
- Livability +2.8/5.0
- Rent growth +2.5/5.0
- Condition / age +2.5/5.0
- 1% rule +2.3/10.0
- Schools +1.2/10.0
- Appreciation +0.0/10.0
$205,000
🖨 Deal sheet (PDF) 📄 Offer letter ✓ Due diligence
Listing remarks
Check out this wonderful spacious corner lot. ! It's a corner of opportunity! This home can be filled with plenty of TLC & maybe even an investment starting point. Property will be sold AS IS! Please contact agent for questions.
Key facts
- 2 garage spots
- Built 1994
- Listed 28 days
Property features AI
Exterior
- Parking: 2 covered parking spaces; 2 total garage spaces (2-car garage); Driveway; Has open parking
- Utilities: Public water; Public sewer
- Home design: Residential property; One level; Fixer condition
- Construction: Block construction; Composition roof; Home warranty included
- Exterior features: Wood fencing; No patio or porch
Interior
- Flooring: Carpet
- Bathrooms: 2 full bathrooms
- Heating & cooling: Central air conditioning; Ceiling fan(s); Natural gas heating
- Interior features: Ceiling fans; Window coverings; Fireplace (1)
Neighborhood map
What this means for you Summary
Snapshot
- This is a 3-bed/2.0-bath single-family listed at $205k.
Deal economics
- At list price, monthly cash flow is $-34 ($-403/yr) — negative.
- To cash-flow at today's rent, offer at most $199k (2.9% below list).
- To meet the 1% rule (rent ≥ 1% of price), the offer needs to be $150k (26.8% below list).
- Recommended offer: $150k (26.8% below list) — sets the bar for 1% rule.
Location & tenants
- Location reads 55/100 on livability (#413 in AR) — a working-class tenant base; expect higher turnover. Strengths: cost of living A+, housing A; Watch: crime F, amenities F, commute F.
- West Memphis School District (suburban): math 16% / reading 15% proficiency, ranked #224 of 238 in AR (top 94%) — low school quality limits family demand, transient renter base, plan for 1-2y turnover; 96% free/reduced lunch — lower-income household profile, screen leases tightly.
- Zoned schools: Richland Elementary School (math 43% / reading 22%, grade F, #277 of 454 statewide, top 61%, 528 students, 100% FRL); West Junior High School (math 19% / reading 25%, grade F, #175 of 201 statewide, top 88%, 507 students, 100% FRL); The Academies of West Memphis Charter School (math 7% / reading 22%, grade F, #265 of 292 statewide, top 91%, 952 students, 100% FRL, charter) — zoned schools at 100% FRL track the district average.
- Market conditions: 136 active listings in the ZIP; 1 comparable units currently listed for rent nearby; 69 units permitted in Crittenden County in 2024 (0 in 5+ unit buildings).
Forward outlook
- Local home prices are declining (-3.0%/yr); year-one equity from $1k of loan paydown is wiped out by about $6k of value loss. Plan a longer hold.
- Crittenden County population projected at -26% by 2050 — secular population decline; favor cash flow + early exit over multi-decade hold.
Negotiation context
- It's been on market 28 days — a 2% lower offer ($202k) is reasonable based on typical stale-listing flexibility.
- Current owner paid $108k; list at $205k implies a 89% gain — meaningful room to come down on a strong offer.
Risks & watch-outs
- Climate carrying-cost: extreme-heat days projected 7→21/yr by 2055 (HVAC capex compounding) — expect insurance premiums to compound above CPI over the hold.
Questions for the listing agent
- What do current leases actually rent for vs. the listed asking? Can we see a recent rent roll and the last 12 months of T-12 income?
- Is there a deadline driving the sale (1031 exchange, divorce, estate, relocation)? That informs how much negotiation room exists.
- Schools are D-rated, which usually means shorter tenancies and higher turnover. Who's the typical renter profile here, and what's been the actual vacancy rate?
- Crime grade is F in this area — have there been break-ins, vandalism, or insurance claims at this property in the last 3 years? What carrier currently insures it and at what premium?
- The area grade is low — what's the realistic commute time and amenity access for the typical tenant pool here? Any planned neighborhood developments (good or bad) we should know about?
- What's the average days-on-market for RENTAL listings here right now (not sales)? A rising rental-DOM trend means longer vacancies and softer asking-rent achievability than the comps imply.
- What's the recent tenant-quality profile in this submarket — average credit score on applications, eviction rate, late-payment / NSF rate, and stable-employment percentage? A property-management company in the area should have these aggregated.
- How much new for-sale + rental construction is in the pipeline within 1–3 miles? Heavy new supply typically softens prices + rents 12–24 months out; constrained supply supports both.
Investment metrics
- 1% rule
- 0.73% ✗
- Cap rate
- 6.10%
- Cash-on-cash
- -0.70%
- DSCR
- 0.97
- GRM
- 11.4
CMA / ARV
- ARV (median comp)
- $275,307
- List price
- $205,000
- Delta
- -25.54%
- Verdict
- UNDERPRICED
- Comps
- 20 within 1.0 mi
Show comp detail 12 sales within ~0.75 mi
| Address | Dist | Beds/Ba | Sqft | Sold | Price | $/sf | Match |
|---|---|---|---|---|---|---|---|
| 1400 Windover Ln | 0.05mi | 3/2.0 | 1,870 (+14%) | 2mo | $270,000 | $144 | 72 |
| 1012 Clement Rd | 0.21mi | 4/2.0 (+1) | 1,706 (+4%) | 8mo | $280,000 | $164 | 72 |
| 1010 Clement Rd | 0.21mi | 3/2.0 | 1,510 (-8%) | 8mo | $235,000 | $156 | 70 |
| 1010 Arlington Dr | 0.37mi | 3/2.0 | 1,467 (-10%) | 3mo | $239,000 | $163 | 62 |
| 813 Pryor Dr | 0.60mi | 3/2.0 | 1,581 (-4%) | 8mo | $175,000 | $111 | 60 |
| 906 N Roselawn Dr | 0.52mi | 4/2.0 (+1) | 1,560 (-5%) | 8mo | $187,900 | $120 | 56 |
| 1403 Dover Rd | 0.36mi | 3/2.0 | 1,836 (+12%) | 8mo | $229,000 | $125 | 56 |
| 1312 Baywood Cir | 0.30mi | 4/2.0 (+1) | 1,448 (-12%) | 7mo | $230,000 | $159 | 56 |
| 908 Roselawn Dr | 0.51mi | 3/2.0 | 1,442 (-12%) | 2mo | $90,000 | $62 | 55 |
| 910 Richland Dr | 0.47mi | 4/2.0 (+1) | 1,813 (+11%) | 8mo | $235,000 | $130 | 49 |
| — | 0.66mi | 4/2.5 (+1) | 1,836 (+12%) | 0mo | $280,000 | $153 | 42 |
| 817 Dover Rd | 0.65mi | 3/2.0 | 1,877 (+15%) | 7mo | $233,000 | $124 | 39 |
Match score weights: distance 35% · size 25% · config 20% · recency 20%. Top-matched comps best support the ARV.
Projected returns pro-forma
-3.0% appreciation · 3.0% rent growth · sell at horizon
- IRR
- -17.5%
- Equity multiple
- 0.38×
- Total profit
- $-35,457
- Equity at exit
- $30,566
- IRR
- -9.7%
- Equity multiple
- 0.41×
- Total profit
- $-34,032
- Equity at exit
- $17,725
Cash invested: $57,400 (down + closing). Projections, not guarantees.
Landlord ↔ Tenant lean methodology
- Overall (STATE)
- 92 Strongly Landlord-Friendly
- State Arkansas
- 92 Strongly Landlord-Friendly · R+14
- County
- — inherits STATE
- City
- — inherits STATE
ZIP-level market 72301
- Active inventory
- 136
- Price-to-rent
- 11.4×
Monthly cashflow live
- Estimated rent
- $1,500 medium interval (Pro) →
- Mortgage (P&I)
- −$1,075
- Tax from tax record
- −$58 /mo · $698/yr
- Insurance
- −$85
- HOA
- −$0
- Vacancy / Maint / Mgmt
- −$315
- Net cashflow
- $-34
Break-even live
Sensitivity live
| Price | -10% $82 | -5% $24 | +0% $-34 | +5% $-92 | +10% $-150 |
|---|---|---|---|---|---|
| Rent | -10% $-152 | -5% $-93 | +0% $-34 | +5% $26 | +10% $85 |
| Rate | -1.0pp $70 | -0.5pp $19 | base $-34 | +0.5pp $-87 | +1.0pp $-141 |
UW: 25.0% down · 7.5% · 30yr · 1.5% tax · 5.0% vac · 8.0% maint · 8.0% mgmt
Financing live
Cash to close
- Down payment
- $51,250
- Closing costs
- $6,150
- Reserves months
- —
- Total cash needed
- —
Loan-product check · same deal, 3 products live
Conventional
25% down · 7.5% · 30yr
- Down + closing
- —
- Monthly P&I
- —
- Monthly cashflow
- —
- DSCR
- —
- Eligible?
- —
Personal DTI + credit; lowest rate.
DSCR
20% down · 8.5% · 30yr
- Down + closing
- —
- Monthly P&I
- —
- Monthly cashflow
- —
- DSCR
- —
- Eligible?
- —
No personal income docs; deal must DSCR.
Hard money
10% down · 12.0% · 12mo
- Down + closing
- —
- Monthly P&I
- —
- Monthly cashflow
- —
- DSCR
- —
- Eligible?
- —
Short-term bridge; refi at stabilization.
Rent comps 1 comps
| Address | Beds | Baths | Sqft | Rent | $/sqft | DOM | Units | Dist |
|---|---|---|---|---|---|---|---|---|
| 911 N Avalon St Unit Future applicants West Memphis, AR | 2.0 | 2.0 | 1057 | $1,500 | $1.42 | 3d | 1 | 1.23mi |
Listing history 4 events
-
2026-06-01statusdays on market $205,000 Pending 28 DOM
-
2026-05-31days on market $205,000 Active 27 DOM
-
2026-05-05$225,000 Active 234-char remark
-
2006-03-29soldstatus $108,500
ⓘ Source: listings_history table (triggers on properties + properties_extension) + one-shot
backfill from property_details.listing_events for pre-trigger history.
Tax reassessment forecast AR · Resets to sale price
- Current annual tax
- $698 · $58/mo
- Projected year-2 tax
- $1,312 · $109/mo
- Expected delta
- +$614/yr (+$51/mo · 88.1%)
ⓘ Screening estimate from a state-policy table — verify with the county assessor before closing.
Climate risk First Street
- Flood 4/10 Moderate FEMA zone X (shaded) · 20% chance over 30 yrs
- Wildfire 1/10 Low
- Heat 7/10 Severe 7 d/yr ≥109°F today · 21 d/yr by 30 yrs out
- Wind 4/10 Moderate 16% chance of damaging wind over 30 yrs
- Air quality 2/10 Low 2 unhealthy d/yr today · 2 by 30 yrs out
Nearby sold comps map
Loading sold comps map…
Walkable amenities ~0.75 mi
Loading nearby amenities…
Taxation est. · year 1
- Rental income
- $18,000
- − Mortgage interest
- −$11,483
- − Property taxes
- −$698
- − Insurance
- −$1,025
- − Repairs & maintenance
- −$1,440
- − Management
- −$1,440
- − Depreciation
- −$5,964
- Taxable loss
- −$4,049
- Est. tax savings @ 24.0%
- +$972
- After-tax cash flow
- $569/yr
For passive investors: Depreciation is non-cash, so a rental often shows a tax loss while cash-flowing — sheltering income. Rental losses are passive: they offset passive income freely, and up to $25,000/yr can offset ordinary (W-2) income if you actively participate and your MAGI is under $100k (phasing out to $0 by $150k); unused losses carry forward. On sale, claimed depreciation is recaptured at up to 25%, and gains may owe capital-gains tax (a 1031 exchange can defer both). Figures are a year-1 estimate at your 24.0% rate — not tax advice; consult a CPA.
Schools (NCES district)
- District
- West Memphis School District
- NCES district ID
- 0508040
- Math proficiency
- 16% ▼ -14.00%
- Reading proficiency
- 15% ▼ -14.00%
- Median HH income
- $29,382
- Composite
- 12.22/100
- National rank
- #9647
- State rank
- #224 of 238 in AR
Livability — West Memphis
- Score
- 55/100
- State rank
- #413
- US rank
- #23638
Category grades
Schools grade is shown separately in the Schools card above.
Census & demographics
- Census place
- West Memphis, AR
- City population
- 24,182
- Population (ZIP)
- 24,182
Population outlook (Crittenden County) Hauer SSP2
- Today (2025)
- 45,254 people
- By 2030
- 42,953 · -5.1%
- By 2040
- 38,235 · -15.5%
- By 2050
- 33,670 · -25.6%
- By 2075
- 24,315 · -46.3%
- By 2100
- 17,173 · -62.1%
Race, ethnicity, and origin ACS 2023
- Neighborhood character
- Majority Black (64%)
- Race & ethnicity
- Black 64% White 29% Two or more races 6% Hispanic / Latino 2%
- Common ancestry
- Serbian 1%
- Foreign-born
- 1% · Canada
- Languages at home
- 98% English-only · Spanish 1%
Political lean MEDSL · Crittenden
- 2024 margin
- Toss-up / Even · D 50.1% · R 47.9% · Other 2.0%
- 2008→2024 swing
- -12.4pp toward R · 2008: 14.7pp · 2024: 2.3pp
- All cycles
- 2024: D+2.3 2020: D+7.2 2016: D+9.0 2012: D+18.7 2008: D+14.7
Not yet ingested
- Civics
- —
Market trends
- HPI YoY
- ▼ -143.63%
- Current HPI
- 182.7665
- Rent YoY
- —
- Metro
- —
- State GDP YoY
- ▲ 3.80%
- F500 in state
- 10
Industry mix (Fortune 500 HQ in AR)
| Industry | F500 HQs | Revenue |
|---|---|---|
| Retail | 1 | $681B |
|
||
| Food / Agriculture | 1 | $53B |
|
||
| Retail / Energy | 1 | $22B |
|
||
| Transportation / Logistics | 1 | $12B |
|
||
| Energy | 1 | $4B |
|
||
Price history
+88.9% since first listed4 events — show timeline
- 2026-06-01 Pending — EARA
- 2026-05-29 Price Changed $205,000 EARA
- 2026-05-05 Listed $225,000 EARA
- 2006-03-29 Sold (Public Records) $108,500 Public Records
Property tax history
-1.2%/yrLatest (2025): $698 · -12.5% YoY. Source: county tax records.
Cash-flow waterfall
monthlySold comps — $/sqft
last 12 mo · ≤1 miLoading sold comps…