 🏗️ New Construction
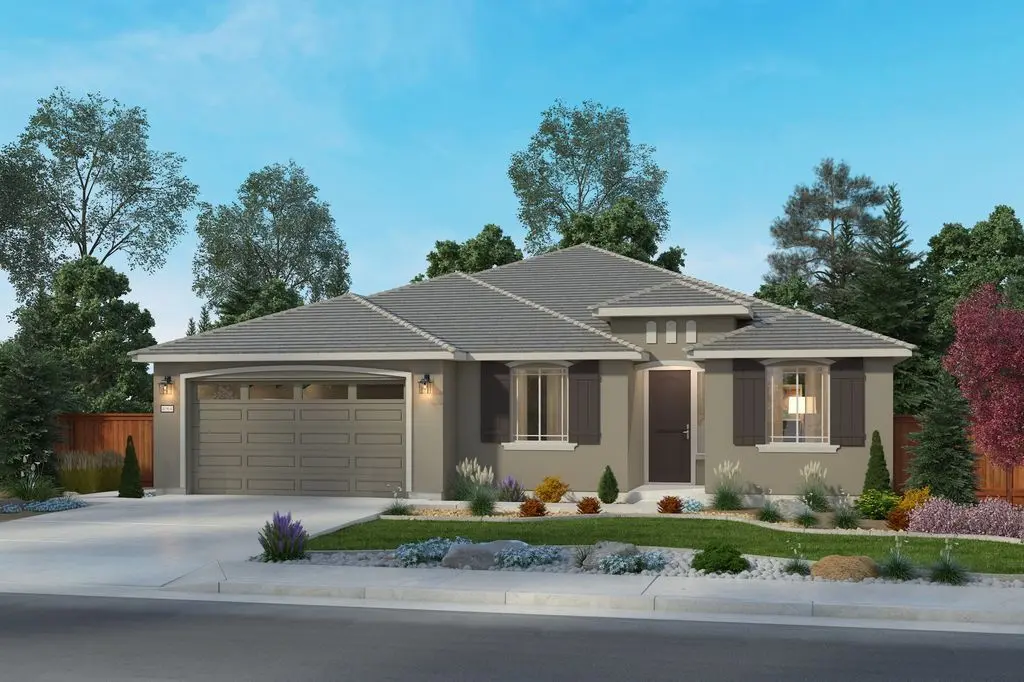
Plan 3 Plan · Spanish Springs, NV
Flood risk 1/10 · Minimal
- FEMA flood zone
- X (unshaded)
- Chance of flooding over 30 yrs
- 0.0%
- Est. flood insurance / yr
- $507 – $1,088
Fire risk 7/10 · Major
- Est. fire insurance / yr
- $490 – $910
Heat risk 5/10 · Moderate
- Hot days now (above 94°F)
- 7 days/yr
- Hot days in 30 yrs
- 20 days/yr
Wind risk 1/10 · Minimal
- Chance of severe wind over 30 yrs
- —
Air-quality risk 8/10 · Major
- Unhealthy air days now
- 15 days/yr
- Unhealthy air days in 30 yrs
- 18 days/yr
Risk factors via First Street. Map © Google.
Why this score? — see what drove the D grade
The composite is a weighted blend of 9 inputs, each scored 0–100. Each bar is that input's sub-score; the figure is the points it added to the 100-point composite (weight × sub-score).
- Cash flow +16.4/30.0
- ARV discount +7.5/15.0
- DSCR +5.1/10.0
- 1% rule +4.5/10.0
- Livability +3.4/5.0
- Schools +3.2/10.0
- Rent growth +2.5/5.0
- Condition / age +1.0/5.0
- Appreciation +0.0/10.0
$579,900
🖨 Deal sheet 📄 Offer letter ✓ Due diligence
Listing remarks MLS
If you have been thinking that the time might be right to upgrade to a newer and perhaps even larger home, the community of Silver Canyon could be just the right choice. One of the most popular features here are the large, expansive homesites which provide space to keep your recreational "toys" right at home. Situated north of Silver Canyon Drive and Pyramid Highway in Sparks, Nevada, Silver Canyon is just a 20 minute drive from a fishing, boating and myriad of recreation at Pyramid Lake - one of the largest natural lakes in the state of Nevada. Just a short drive away is all of the amenities of Sparks and Reno, including shopping, entertainment, parks, and employment opportunities. Whether you enjoy relaxing at one of the many local parks, or taking the family for a day of fun at an amusement park, there is truly something for everyone in the nearby area. There are also several excellent golf courses not far from Silver Canyon, including Kiley Links Golf Course, Wildcreek Golf Course, and, most notable, Red Hawk Golf and Resort. We take great pride in building our homes to the highest level of quality. When you purchase a home in Silver Canyon, you are not just purchasing a home. You are investing in peace of mind and the knowledge that your family will have a place to call home and build memories for many years to come. All our homes are built for comfort and style, featuring exceptional finishes. Find out more about the beautiful homes in Silver Canyon. We would be pleased to introduce you and give you a tour.
Key facts
- Amusement park
- Golf courses
- Local parks
Tags
Neighborhood map
What this means for you Summary
Snapshot
- This is a 3-bed/2.0-bath single-family listed at $580k. Condition is rated poor.
Deal economics
- At list price, monthly cash flow is $362 ($4k/yr) — positive.
- The deal already cash-flows at list — no discount required.
- Meets the 1% rule at list price ($6k rent vs $580k).
- Recommended offer: $510k (12.0% below list) — sets the bar for market timing.
- Cap rate 7.0% vs local median 3.2% in Spanish Springs — top-decile yield for the area; either an underpriced asset or a hidden risk that comps aren't pricing in. Stress-test before assuming the spread holds.
Location & tenants
- Location reads 67/100 on livability (#35 in NV) — a middle-class / working-renter tenant base. Strengths: employment A+, housing A+, crime A; Watch: schools C-, amenities F, commute F.
- Washoe County School District (urban): math 30% / reading 44% proficiency, ranked #6 of 17 in NV (top 35%) — families likely to look elsewhere, expect single-tenant / working-renter base with shorter leases.
- Market conditions: 142 active listings in the ZIP; 2 comparable units currently listed for rent nearby; 4,085 units permitted in Washoe County in 2024 (1,634 in 5+ unit buildings).
Forward outlook
- Local home prices are declining (-3.0%/yr); year-one equity from $4k of loan paydown is wiped out by about $19k of value loss. Plan a longer hold.
- Washoe County population projected at +19% by 2050 — long-run rental-demand tailwind backs the buy-and-hold thesis.
Negotiation context
- It's been on market 316 days — a 12% lower offer ($510k) is reasonable based on typical stale-listing flexibility.
Risks & watch-outs
- Climate carrying-cost: major wildfire risk; extreme-heat days projected 7→20/yr by 2055 (HVAC capex compounding) — expect insurance premiums to compound above CPI over the hold.
Questions for the listing agent
- It's been on market 316 days. Have you received any prior offers? Is the seller open to a 12% concession, seller financing, or rate buy-down credit?
- Have any recent inspections been done? Can we get a copy of the seller's disclosures and any deferred-maintenance estimates?
- Why hasn't it sold? Are there any deal-killer items the seller is aware of (foundation, flood, title, zoning, code violations)?
- Is there a deadline driving the sale (1031 exchange, divorce, estate, relocation)? That informs how much negotiation room exists.
- The area grade is low — what's the realistic commute time and amenity access for the typical tenant pool here? Any planned neighborhood developments (good or bad) we should know about?
- What's the average days-on-market for RENTAL listings here right now (not sales)? A rising rental-DOM trend means longer vacancies and softer asking-rent achievability than the comps imply.
- What's the recent tenant-quality profile in this submarket — average credit score on applications, eviction rate, late-payment / NSF rate, and stable-employment percentage? A property-management company in the area should have these aggregated.
- How much new for-sale + rental construction is in the pipeline within 1–3 miles? Heavy new supply typically softens prices + rents 12–24 months out; constrained supply supports both.
Investment metrics
- 1% rule
- 0.95% ✗
- Cap rate
- 6.97%
- Cash-on-cash
- 2.42%
- DSCR
- 1.11
- GRM
- 8.8
CMA / ARV
- ARV (median comp)
- $639,450
- List price
- $579,900
- Delta
- -9.31%
- Verdict
- FAIR
- Comps
- 20 within 1.0 mi
Show comp detail 12 sales within ~0.75 mi
| Address | Dist | Beds/Ba | Sqft | Sold | Price | $/sf | Match |
|---|---|---|---|---|---|---|---|
| 2324 Hickory Dr #61 | 0.10mi | 3/2.0 | 2,136 (0%) | 5mo | $666,239 | $312 | 91 |
| 2271 Slater Mill Dr | 0.30mi | 3/3.5 | 2,138 (+0%) | 3mo | $650,000 | $304 | 77 |
| 2282 Cloud Berry Dr | 0.19mi | 3/2.0 | 2,262 (+6%) | 7mo | $615,000 | $272 | 76 |
| 2251 Slater Mill Dr | 0.28mi | 3/3.5 | 2,226 (+4%) | 7mo | $627,000 | $282 | 68 |
| 705 Tranquil Dr | 0.70mi | 3/2.0 | 2,111 (-1%) | 1mo | $870,000 | $412 | 65 |
| 430 Calle De La Plata | 0.52mi | 3/2.0 | 2,056 (-4%) | 6mo | $1,150,000 | $559 | 64 |
| 2352 Millville Dr | 0.56mi | 4/2.5 (+1) | 2,226 (+4%) | 2mo | $707,000 | $318 | 59 |
| 742 Mallard Crest Dr | 0.62mi | 4/2.0 (+1) | 2,200 (+3%) | 3mo | $725,000 | $330 | 58 |
| 309 Coyote Xing | 0.60mi | 3/2.0 | 2,343 (+10%) | 2mo | $757,000 | $323 | 55 |
| 25 El Caballo Trl | 0.69mi | 3/2.0 | 1,964 (-8%) | 4mo | $900,000 | $458 | 51 |
| 55 Nives Ct | 0.62mi | 4/2.0 (+1) | 2,440 (+14%) | 3mo | $1,251,000 | $513 | 40 |
| 1124 Spruce Meadows Dr | 0.65mi | 4/3.0 (+1) | 2,402 (+12%) | 9mo | $636,500 | $265 | 33 |
Match score weights: distance 35% · size 25% · config 20% · recency 20%. Top-matched comps best support the ARV.
Projected returns pro-forma
-3.0% appreciation · 3.0% rent growth · sell at horizon
- IRR
- -12.4%
- Equity multiple
- 0.55×
- Total profit
- $-80,487
- Equity at exit
- $95,344
- IRR
- -3.3%
- Equity multiple
- 0.78×
- Total profit
- $-40,048
- Equity at exit
- $55,288
Cash invested: $179,046 (down + closing). Projections, not guarantees.
Landlord ↔ Tenant lean methodology
- Overall (STATE)
- 71 Landlord-Friendly
- State Nevada
- 71 Landlord-Friendly · R+1
- County
- — inherits STATE
- City
- — inherits STATE
ZIP-level market 89441
- Home prices YoY
- -18.5%
- Active inventory
- 142
- Price-to-rent
- 8.0×
Monthly cashflow live
- Estimated rent
- $6,052 medium interval (Pro) →
- Mortgage (P&I)
- −$3,353
- Tax est. 1.5%
- −$799 /mo · $9,592/yr
- Insurance
- −$266
- HOA
- −$0
- Vacancy / Maint / Mgmt
- −$1,271
- Net cashflow
- $362
Break-even live
UW: 25.0% down · 7.5% · 30yr · 1.5% tax · 5.0% vac · 8.0% maint · 8.0% mgmt
Financing live
Cash to close
- Down payment
- $159,862
- Closing costs
- $19,183
- Reserves months
- —
- Total cash needed
- —
Loan-product check · same deal, 3 products live
Conventional
25% down · 7.5% · 30yr
- Down + closing
- —
- Monthly P&I
- —
- Monthly cashflow
- —
- DSCR
- —
- Eligible?
- —
Personal DTI + credit; lowest rate.
DSCR
20% down · 8.5% · 30yr
- Down + closing
- —
- Monthly P&I
- —
- Monthly cashflow
- —
- DSCR
- —
- Eligible?
- —
No personal income docs; deal must DSCR.
Hard money
10% down · 12.0% · 12mo
- Down + closing
- —
- Monthly P&I
- —
- Monthly cashflow
- —
- DSCR
- —
- Eligible?
- —
Short-term bridge; refi at stabilization.
Rent comps 2 comps
| Address | Beds | Baths | Sqft | Rent | $/sqft | DOM | Units | Dist |
|---|---|---|---|---|---|---|---|---|
| 430 Calle de la Plata Sparks, NV | 3.0 | 2.0 | 2056 | $7,900 | $3.84 | 23d | 1 | 0.53mi |
| 640 Allerton Way Sparks, NV | 3.0 | 2.0 | 2200 | $3,200 | $1.45 | 13d | 1 | 0.83mi |
Listing history 16 events
-
2026-06-18days on market $579,900 Active 316 DOM
-
2026-06-17days on market $579,900 Active 315 DOM
-
2026-06-16days on market $579,900 Active 314 DOM
-
2026-06-15days on market $579,900 Active 313 DOM
-
2026-06-14days on market $579,900 Active 311 DOM
-
2026-06-10days on market $579,900 Active 308 DOM
-
2026-06-09days on market $579,900 Active 307 DOM
-
2026-06-08days on market $579,900 Active 306 DOM
-
2026-06-07days on market $579,900 Active 305 DOM
-
2026-06-05days on market $579,900 Active 302 DOM
-
2026-06-03days on market $579,900 Active 301 DOM
-
2026-06-02days on market $579,900 Active 300 DOM
-
2026-06-01days on market $579,900 Active 299 DOM
-
2026-05-31days on market $579,900 Active 298 DOM
-
2026-05-30days on market $579,900 Active 297 DOM
-
2025-08-06$579,900 Active 1548-char remark
Show marketing remark (1548 chars)
If you have been thinking that the time might be right to upgrade to a newer and perhaps even larger home, the community of Silver Canyon could be just the right choice. One of the most popular features here are the large, expansive homesites which provide space to keep your recreational "toys" right at home. Situated north of Silver Canyon Drive and Pyramid Highway in Sparks, Nevada, Silver Canyon is just a 20 minute drive from a fishing, boating and myriad of recreation at Pyramid Lake - one of the largest natural lakes in the state of Nevada. Just a short drive away is all of the amenities of Sparks and Reno, including shopping, entertainment, parks, and employment opportunities. Whether you enjoy relaxing at one of the many local parks, or taking the family for a day of fun at an amusement park, there is truly something for everyone in the nearby area. There are also several excellent golf courses not far from Silver Canyon, including Kiley Links Golf Course, Wildcreek Golf Course, and, most notable, Red Hawk Golf and Resort. We take great pride in building our homes to the highest level of quality. When you purchase a home in Silver Canyon, you are not just purchasing a home. You are investing in peace of mind and the knowledge that your family will have a place to call home and build memories for many years to come. All our homes are built for comfort and style, featuring exceptional finishes. Find out more about the beautiful homes in Silver Canyon. We would be pleased to introduce you and give you a tour.
ⓘ Source: listings_history table (triggers on properties + properties_extension) + one-shot
backfill from property_details.listing_events for pre-trigger history.
Climate risk First Street
- Flood 1/10 Low FEMA zone X (unshaded) · 0% chance over 30 yrs
- Wildfire 7/10 Severe
- Heat 5/10 Major 7 d/yr ≥94°F today · 20 d/yr by 30 yrs out
- Wind 1/10 Low
- Air quality 8/10 Severe 15 unhealthy d/yr today · 18 by 30 yrs out
Nearby sold comps map
Loading sold comps map…
Walkable amenities ~0.75 mi
Loading nearby amenities…
Taxation est. · year 1
- Rental income
- $72,620
- − Mortgage interest
- −$35,819
- − Property taxes
- −$9,592
- − Insurance
- −$3,197
- − Repairs & maintenance
- −$5,810
- − Management
- −$5,810
- − Depreciation
- −$18,602
- Taxable loss
- −$6,209
- Est. tax savings @ 24.0%
- +$1,490
- After-tax cash flow
- $5,831/yr
For passive investors: Depreciation is non-cash, so a rental often shows a tax loss while cash-flowing — sheltering income. Rental losses are passive: they offset passive income freely, and up to $25,000/yr can offset ordinary (W-2) income if you actively participate and your MAGI is under $100k (phasing out to $0 by $150k); unused losses carry forward. On sale, claimed depreciation is recaptured at up to 25%, and gains may owe capital-gains tax (a 1031 exchange can defer both). Figures are a year-1 estimate at your 24.0% rate — not tax advice; consult a CPA.
Condition & rehab AI · 4 photos
This home requires extensive repairs and updates to its roof, exterior, interior, and systems. Significant investment is needed to bring it up to a livable condition.
Repairs flagged
- Major roof — Significant damage and potential leaks.
- Major exterior siding — Severe wear and discoloration.
- Major interior walls/paint — No photos of interior walls or paint, but exterior condition suggests potential issues.
- Major flooring — No photos of flooring, but exterior condition suggests potential issues.
- Major systems — No photos of systems, but exterior condition suggests potential issues with plumbing, electrical, and HVAC systems.
Value-add opportunities
- Both New roof — A new roof would significantly improve the home's appearance and functionality.
- Both Exterior siding and paint — A fresh coat of paint and new siding would greatly enhance the home's curb appeal and value.
- Both Interior walls and paint — Fresh paint and repairs to interior walls would improve the home's condition and value.
- Both Flooring — New flooring would improve the home's condition and value.
- Both Systems (plumbing, electrical, HVAC) — Upgrades to these systems would improve the home's functionality and value.
Renovation cost estimate screening
| Repair item | Severity | Est. cost |
|---|---|---|
| roof · Significant damage and potential leaks. | Major | $15,000–50,000 |
| exterior siding · Severe wear and discoloration. | Major | $15,000–50,000 |
| interior walls/paint · No photos of interior walls or paint, but exterior condition suggests potential issues. | Major | $15,000–50,000 |
| flooring · No photos of flooring, but exterior condition suggests potential issues. | Major | $15,000–50,000 |
| systems · No photos of systems, but exterior condition suggests potential issues with plumbing, electrical, and HVAC systems. | Major | $15,000–50,000 |
| Total estimated repair cost · 5 items | $75,000–250,000 |
Value-add ROI direction
- Both New roof — A new roof would significantly improve the home's appearance and functionality. ↑
- Both Exterior siding and paint — A fresh coat of paint and new siding would greatly enhance the home's curb appeal and value. ↑
- Both Interior walls and paint — Fresh paint and repairs to interior walls would improve the home's condition and value. ↑
- Both Flooring — New flooring would improve the home's condition and value. ↑
- Both Systems (plumbing, electrical, HVAC) — Upgrades to these systems would improve the home's functionality and value. ↑
ⓘ Cost ranges are severity-bucket heuristics (US national rule-of-thumb). Get contractor quotes + a written scope before underwriting a rehab budget.
Schools (NCES district)
- District
- Washoe County School District
- NCES district ID
- 3200480
- Math proficiency
- 30% ▼ -9.00%
- Reading proficiency
- 44% ▼ -4.00%
- Median HH income
- $55,025
- Composite
- 32.44/100
- National rank
- #5721
- State rank
- #6 of 17 in NV
Livability — Spanish Springs
- Score
- 67/100
- State rank
- #35
- US rank
- #11102
Category grades
Schools grade is shown separately in the Schools card above.
Census & demographics
- Census place
- Spanish Springs, NV
- City population
- 13,854
- Population (ZIP)
- 13,854
Population outlook (Washoe County) Hauer SSP2
- Today (2025)
- 499,260 people
- By 2030
- 523,429 · +4.8%
- By 2040
- 564,420 · +13.1%
- By 2050
- 595,548 · +19.3%
- By 2075
- 652,375 · +30.7%
- By 2100
- 661,518 · +32.5%
Race, ethnicity, and origin ACS 2023
- Neighborhood character
- Predominantly White (74%)
- Race & ethnicity
- White 74% Hispanic / Latino 13% Two or more races 10% Native American 5% Asian 1%
- Hispanic origin (detail)
- Mexican 7%
- Common ancestry
- Italian 5% Lithuanian 3% Slovak 2%
- Foreign-born
- 3% · Canada, South Korea
- Languages at home
- 94% English-only · Spanish 3% Other Indo-European 1%
Political lean MEDSL · Washoe
- 2024 margin
- Toss-up / Even · D 49.3% · R 48.3% · Other 2.4%
- 2008→2024 swing
- -11.7pp toward R · 2008: 12.7pp · 2024: 1.0pp
- All cycles
- 2024: D+1.0 2020: D+4.5 2016: D+1.2 2012: D+3.6 2008: D+12.7
Not yet ingested
- Civics
- —
Market trends
- HPI YoY
- ▼ -74.99%
- Current HPI
- 330.2277
- Rent YoY
- —
- Metro
- —
- State GDP YoY
- ▲ 3.08%
- F500 in state
- 6
Industry mix (Fortune 500 HQ in NV)
| Industry | F500 HQs | Revenue |
|---|---|---|
| Hotels / Casinos | 3 | $36B |
|
||
Price history
1 event — show timeline
- 2025-08-06 Listed $579,900 Zillow
Cash-flow waterfall
monthlySold comps — $/sqft
last 12 mo · ≤1 miLoading sold comps…